Satellite Data Reveals Intra-Urban Heat Pockets In Poor Neighborhoods
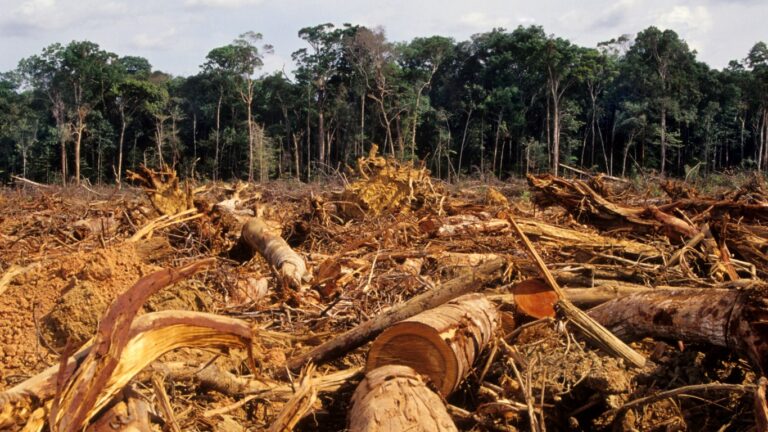
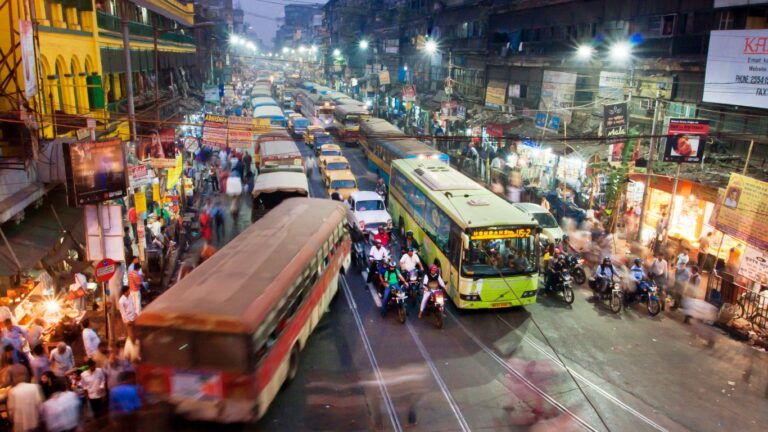
As the planet warms, the people least responsible for the climate crisis will suffer the most. Poor, less developed countries in tropical and subtropical areas are projected to experience more severe climate effects and greater economic disruption than the major world powers, despite having negligible carbon footprints in comparison.
While the world’s most vulnerable populations face disproportionate climate challenges on a macro scale, the same dynamic is at play on a smaller scale in U.S. cities. Analysis of the latest imagery data from the Landsat satellite program of the U.S. Geological Survey and NASA reveals that land surface temperatures can vary by more than 20 degrees Fahrenheit across neighborhoods within the same city, influenced in part by geographic factors like elevation, slope, and aspect.
But further analysis highlights another major determinant of urban temperatures: money. Using socioeconomic data from the U.S. Census Bureau, we found strong relationships between income and land surface temperature in almost every major U.S. city. Poor neighborhoods tend to be hotter than wealthy ones, and pose greater risk of heat-related illness and other negative effects of heat exposure.
The disparity in heat burden between rich and poor neighborhoods is far more pronounced in some cities than others. Throughout the United States, census tracts tend to be about 0.5 degrees Fahrenheit cooler for every $10,000 of additional income per capita among their residents. In some cities, however, an increase of $10,000 in per capita income is associated with a cooling effect of more than 2 degrees Fahrenheit .
Using data from the USGS and Census Bureau, we found the cities with the greatest heat inequity, where incomes and temperatures are the most closely intertwined – and where poorer neighborhoods are consequently most likely to suffer disproportionately from heat. We ranked cities on the relationship between income per capita and average land surface temperature in July and August, expressed as the decrease in average land surface temperature associated with an increase of $10,000 per capita income at the census tract level.
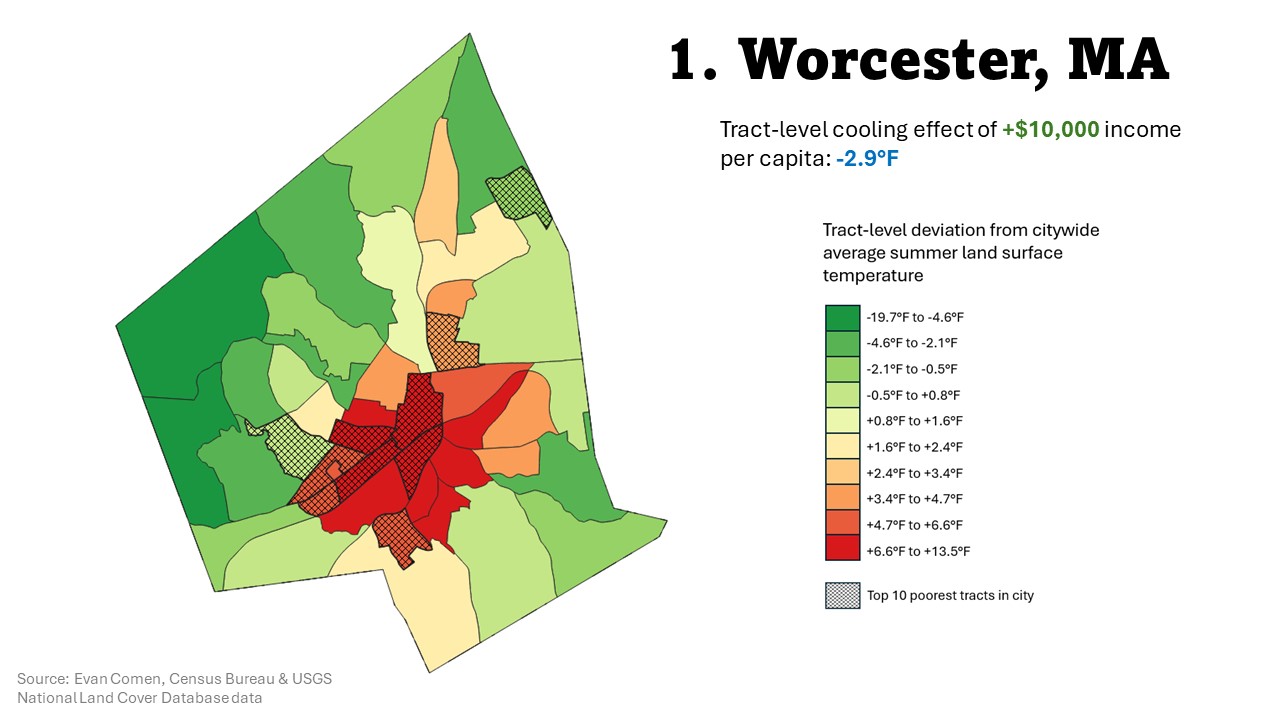
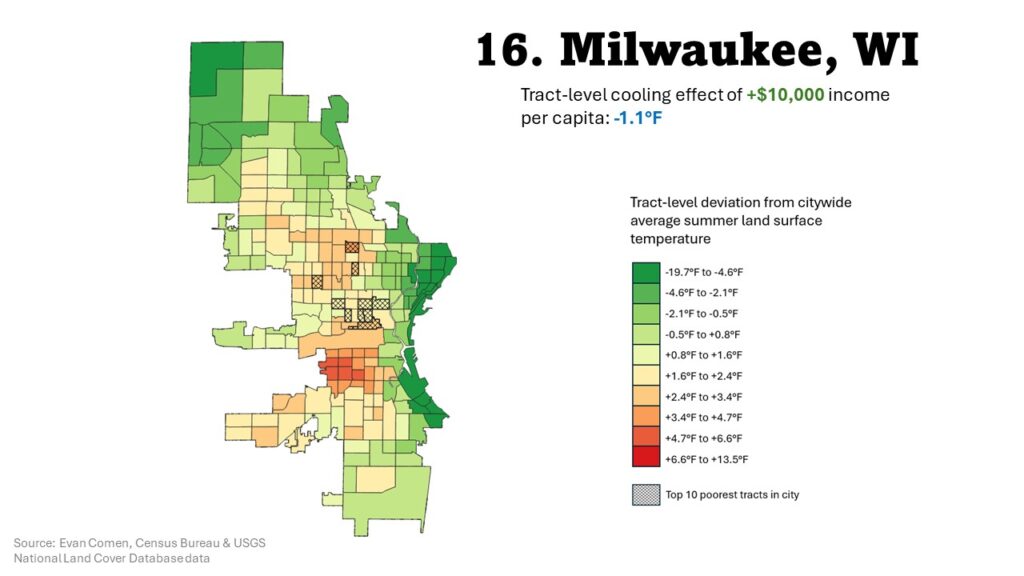
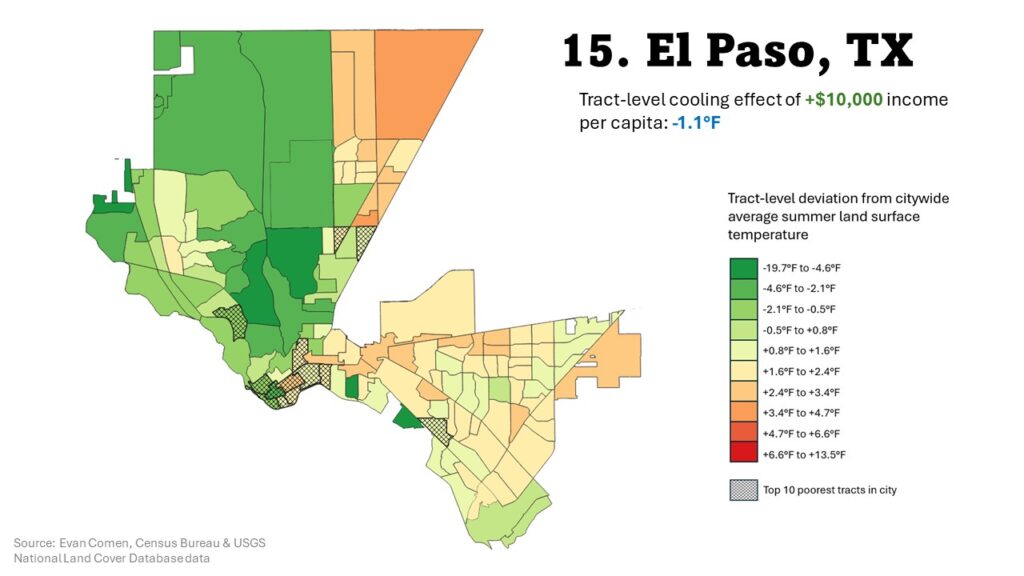
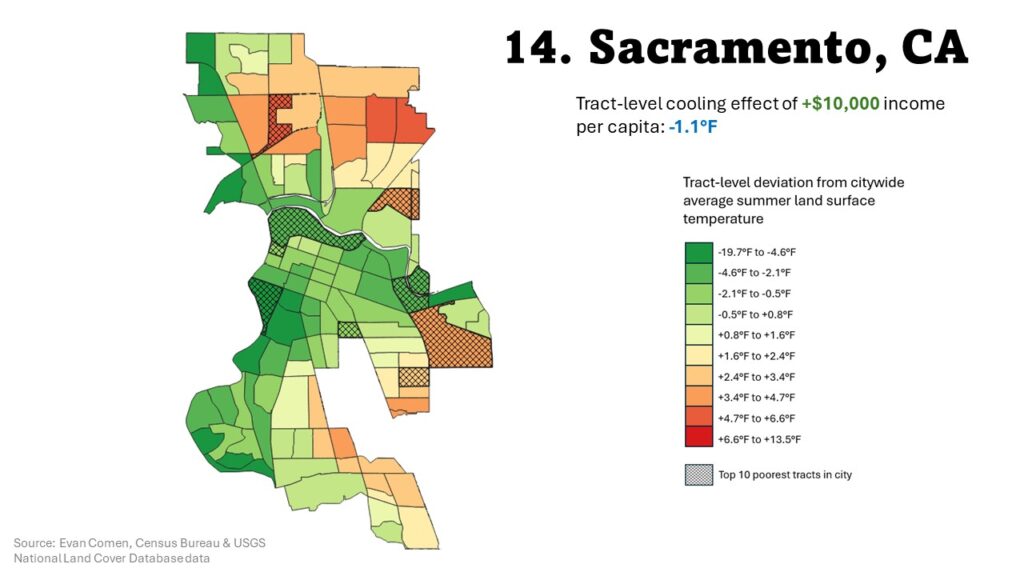
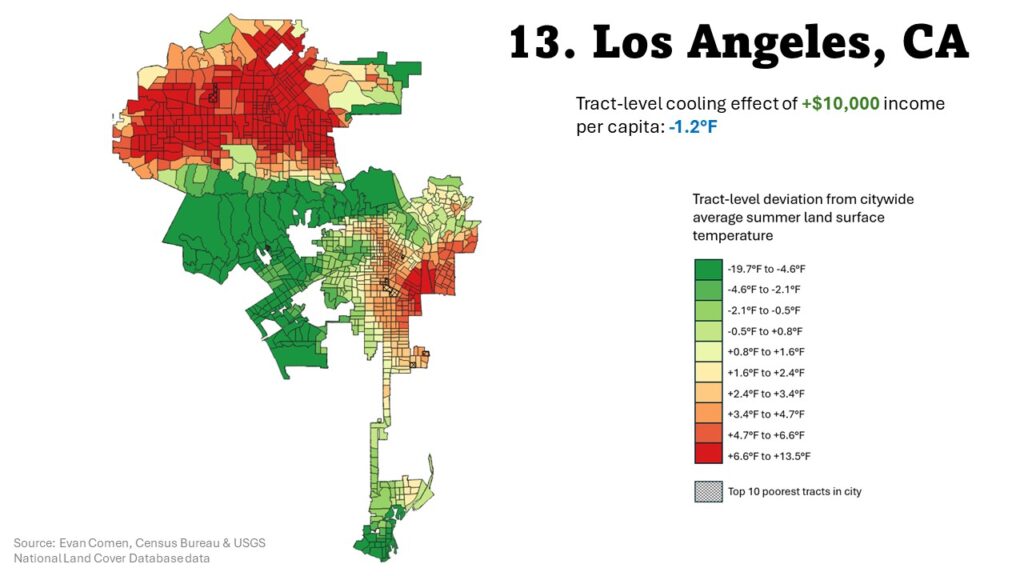
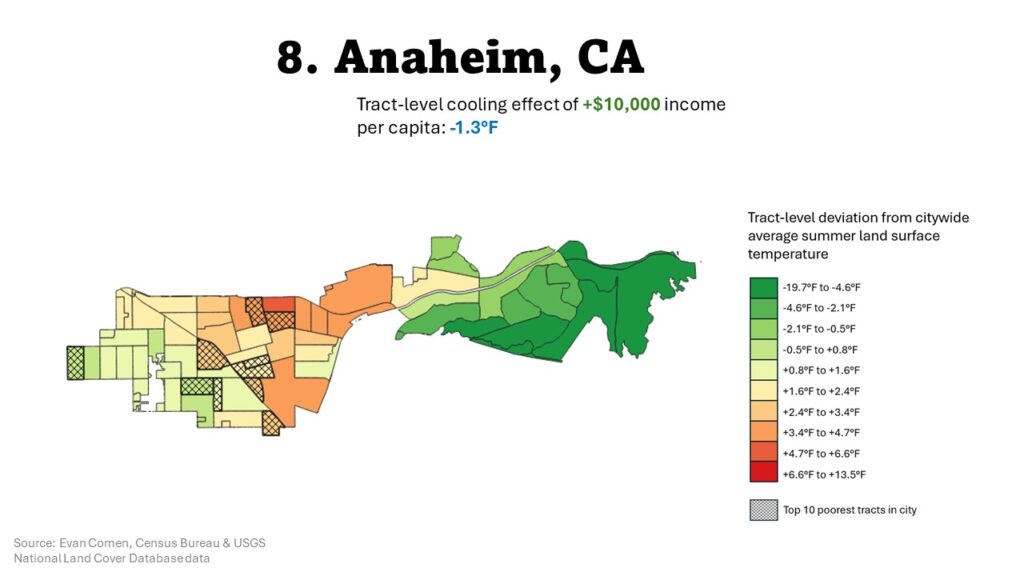
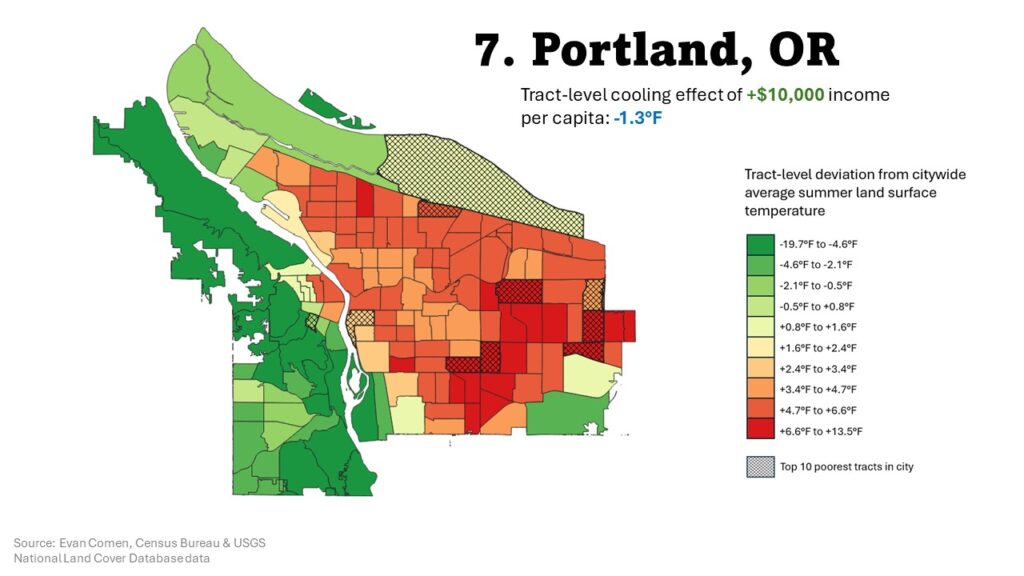
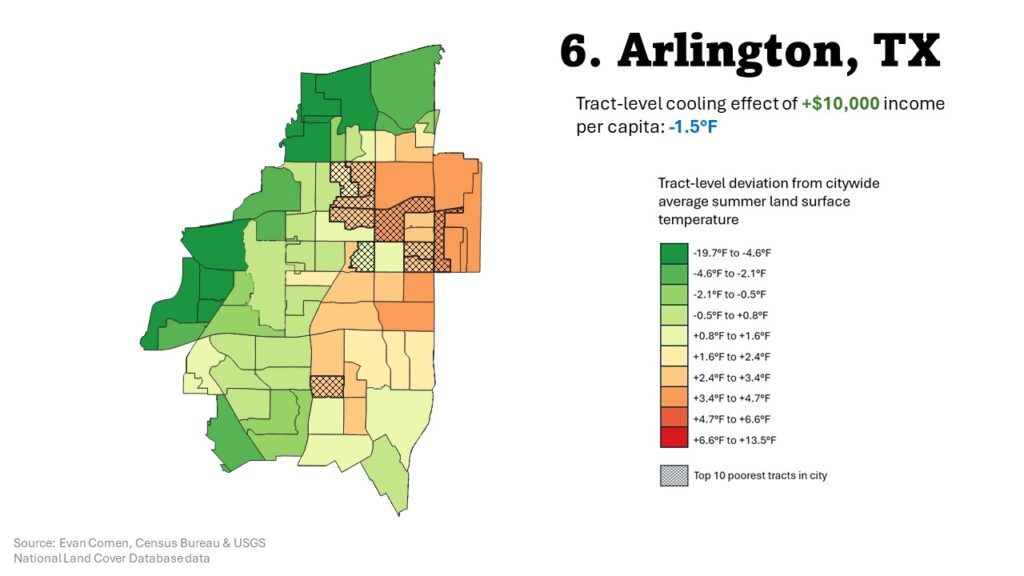
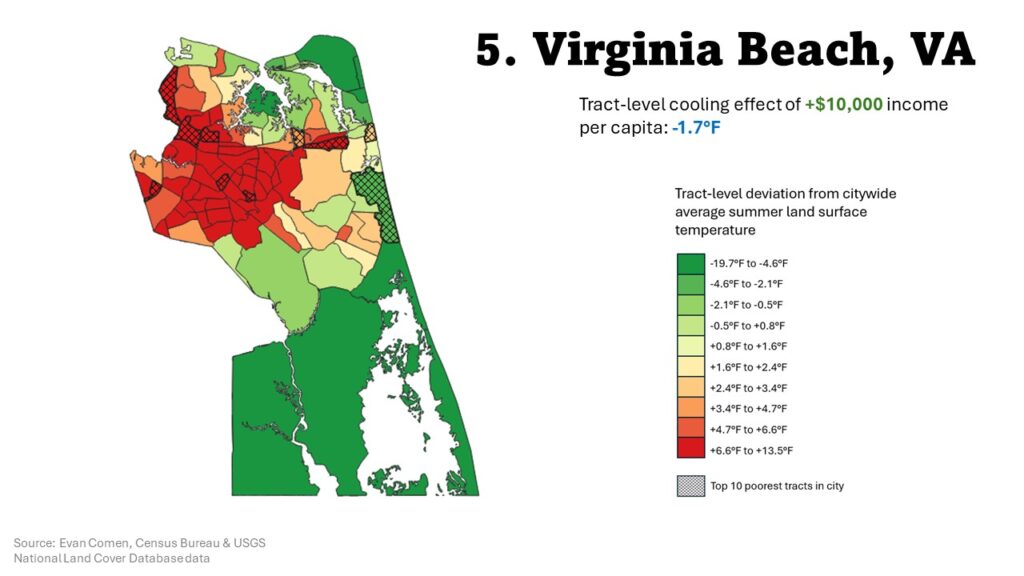
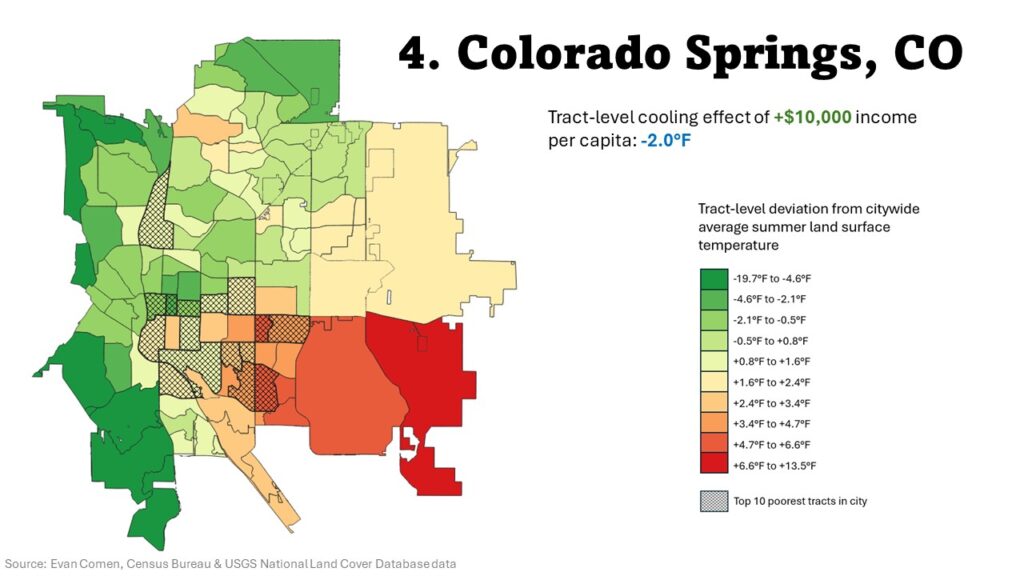
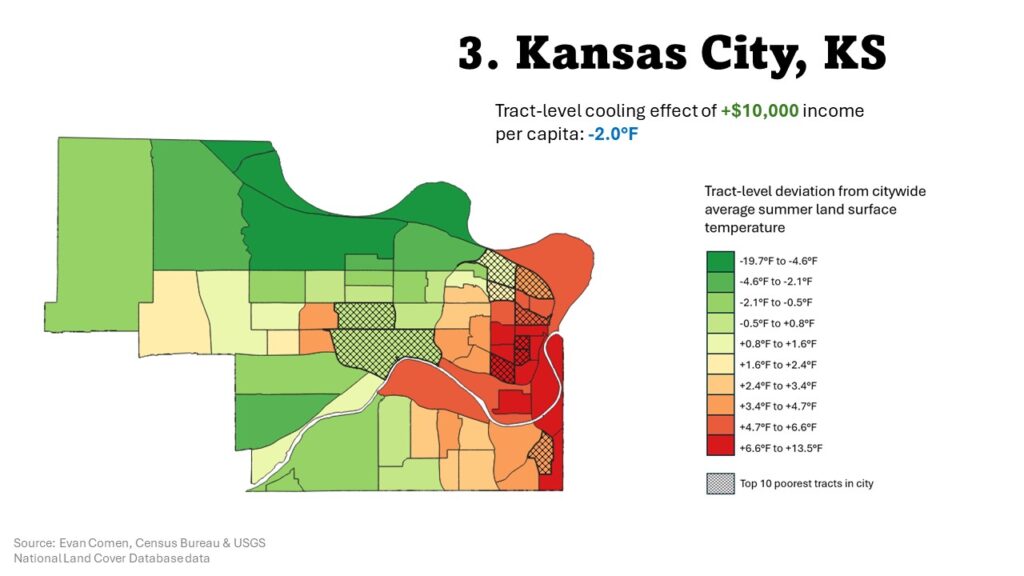
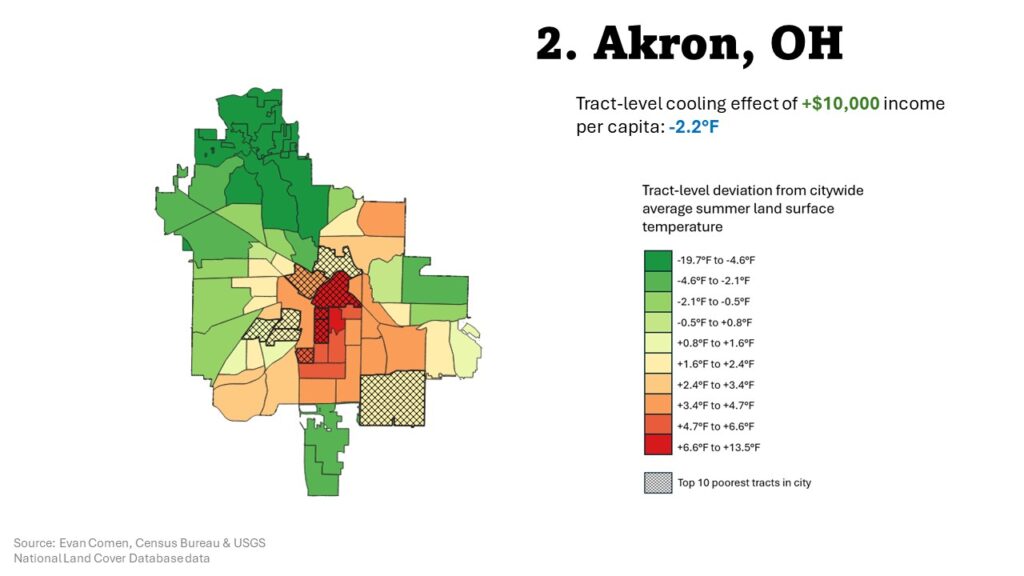
We mapped the 20 cities with the worst heat inequity, showing how land surface temperatures vary at the census tract level, and how the hottest tracts are often those with the highest poverty rates within a city:
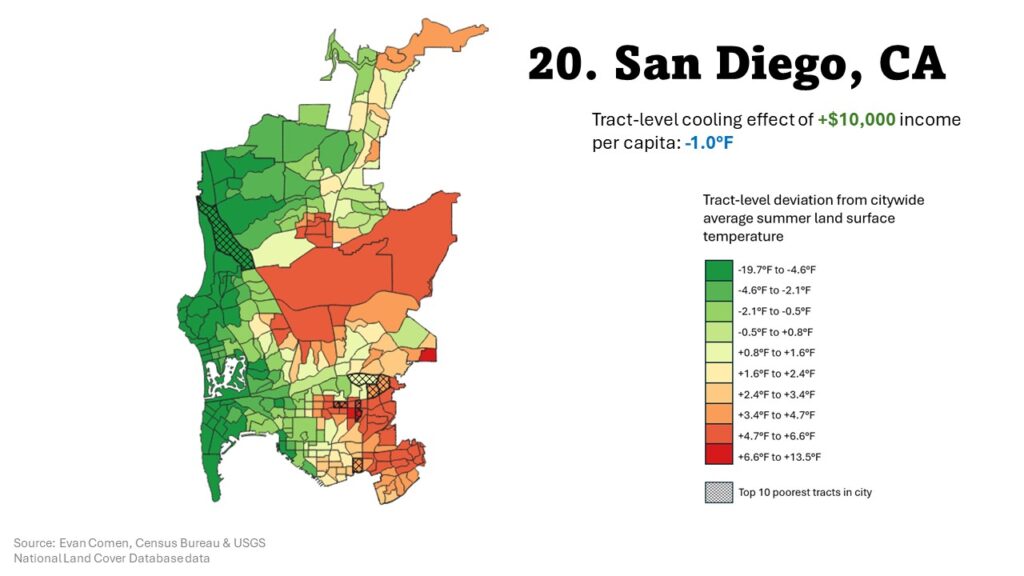
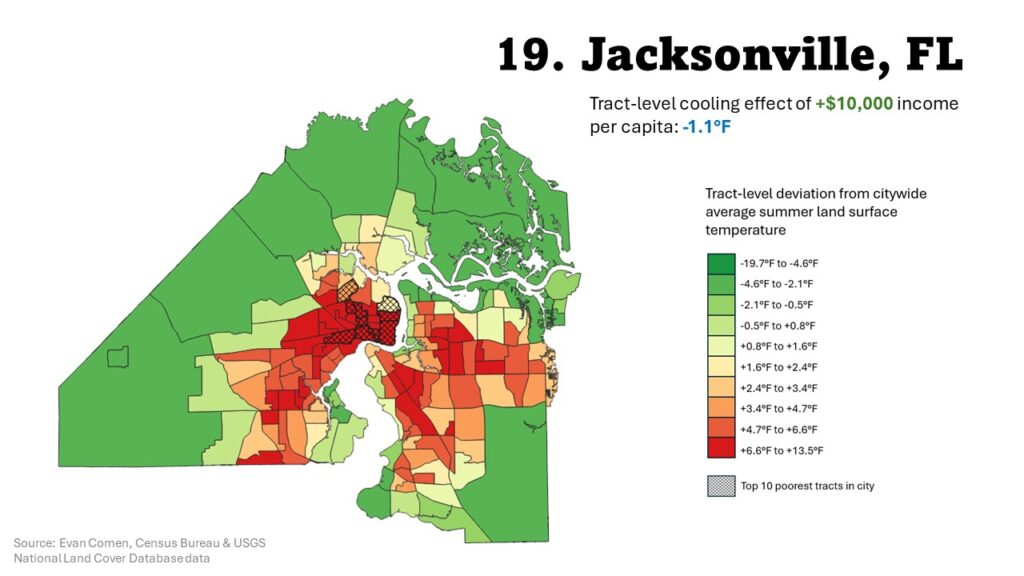
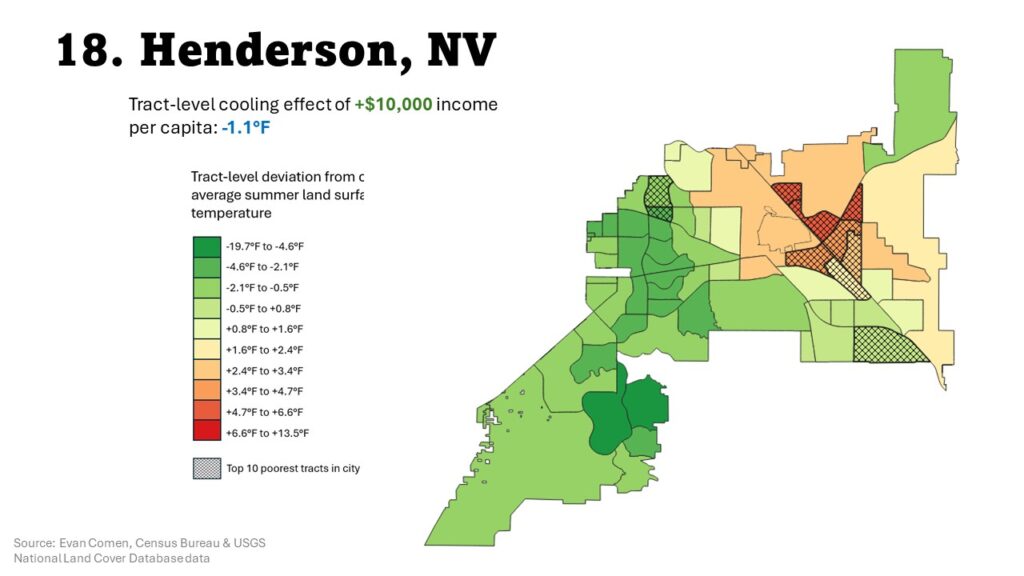
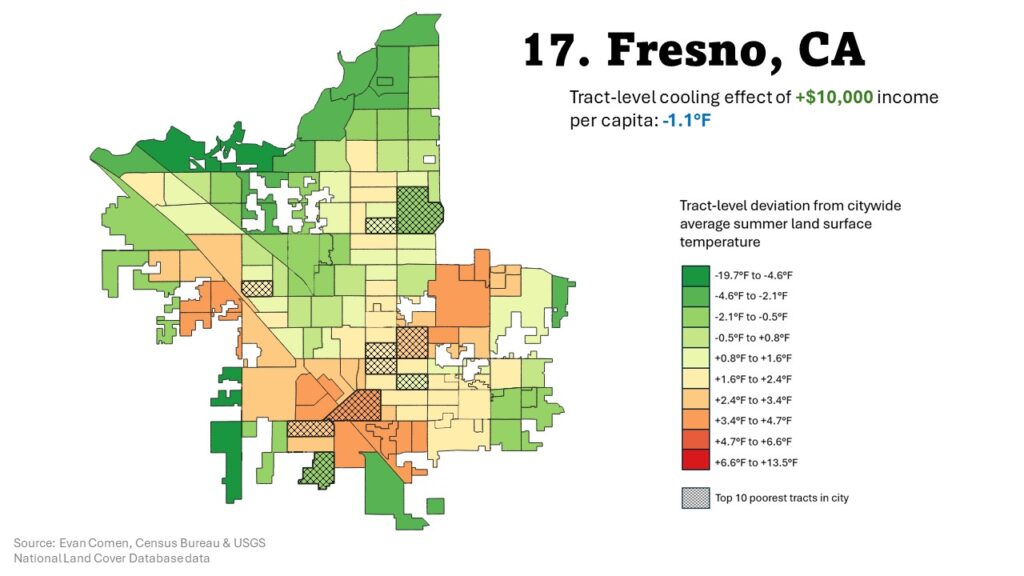
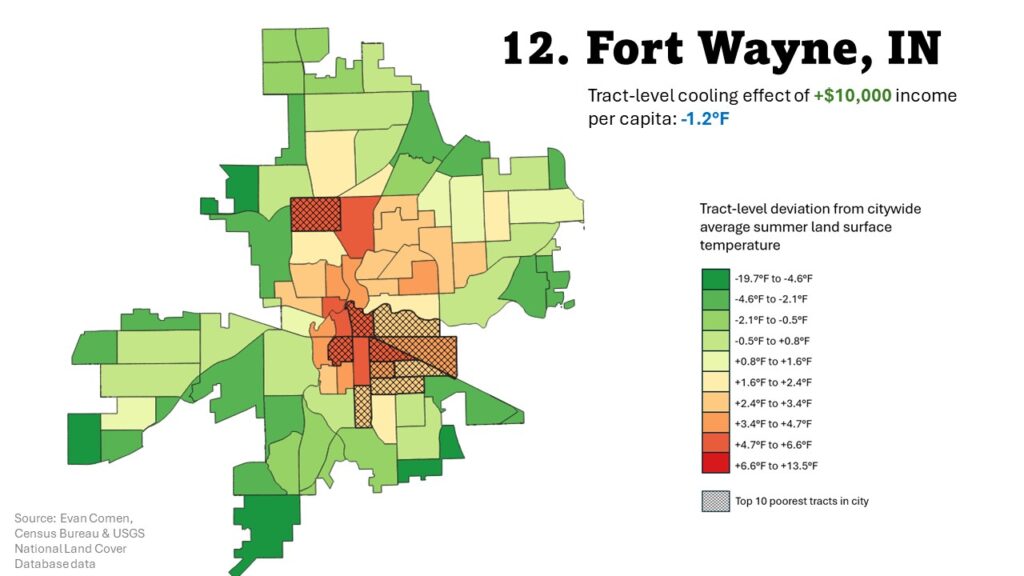
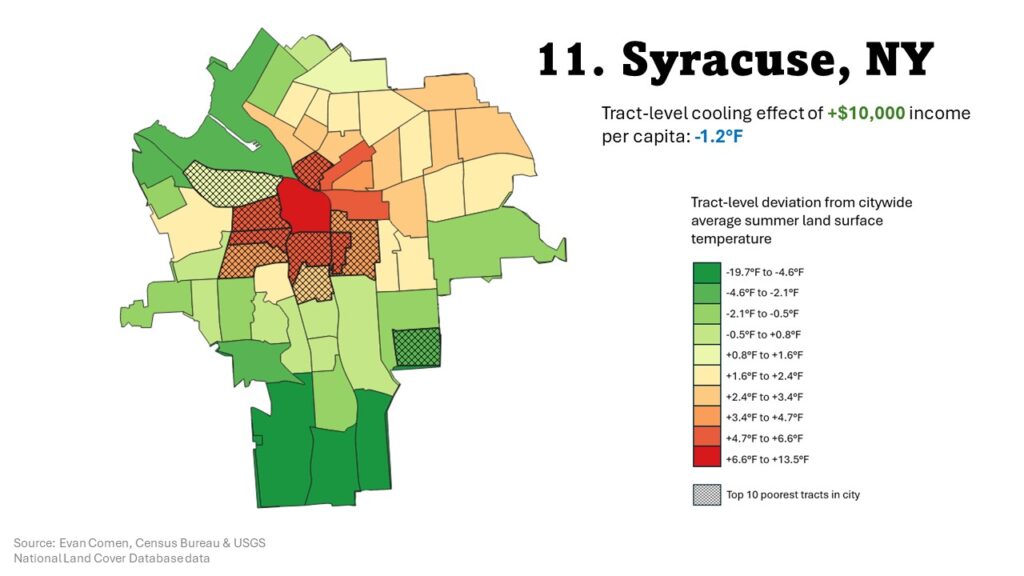
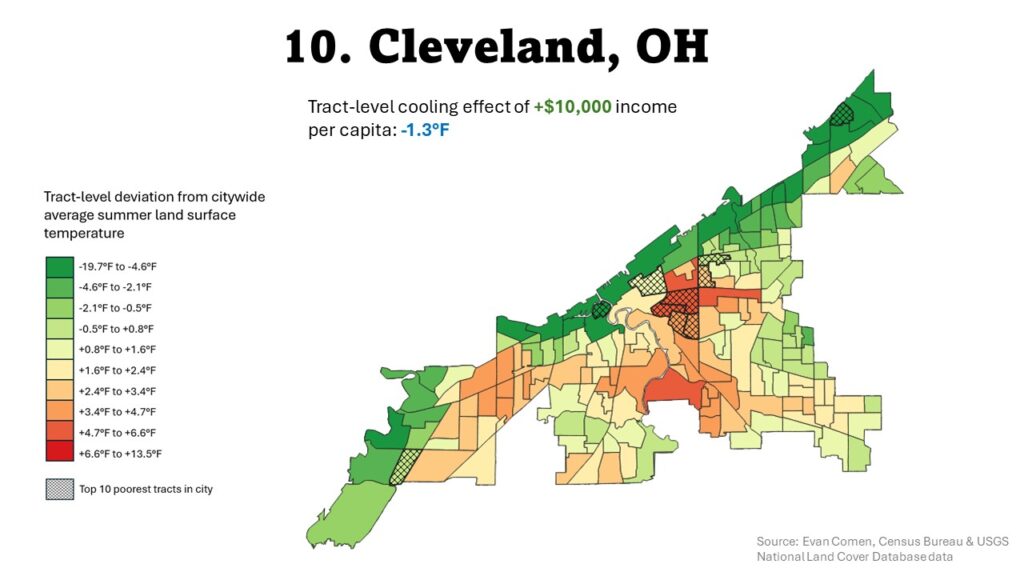
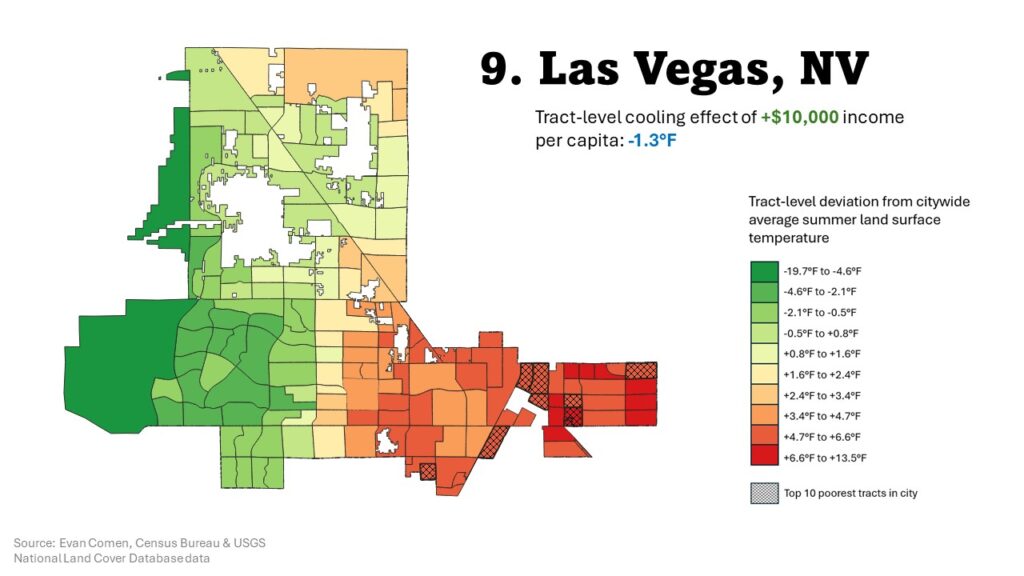

This table shows the associated effect of an increase of $10,000 income per capita on average summer land surface temperatures in the top 20 cities:
| City | Tract-level cooling effect of +$10,000 income per capita |
|---|---|
| Worcester, MA | -2.9°F |
| Akron, OH | -2.2°F |
| Kansas City, KS | -2.0°F |
| Colorado Springs, CO | -2.0°F |
| Virginia Beach, VA | -1.7°F |
| Arlington, TX | -1.5°F |
| Portland, OR | -1.3°F |
| Anaheim, CA | -1.3°F |
| Las Vegas, NV | -1.3°F |
| Cleveland, OH | -1.3°F |
| Syracuse, NY | -1.2°F |
| Fort Wayne, IN | -1.2°F |
| Los Angeles, CA | -1.2°F |
| Sacramento, CA | -1.1°F |
| El Paso, TX | -1.1°F |
| Milwaukee, WI | -1.1°F |
| Fresno, CA | -1.1°F |
| Henderson, NV | -1.1°F |
| Jacksonville, FL | -1.1°F |
| San Diego, CA | -1.0°F |
One of the main drivers of heat inequity is lack of tree cover. As nature’s air conditioners, trees cool their surroundings by releasing vapor absorbed through their roots, as well as by evaporating rainfall collected on their leaves and providing shade. But in most cities, green begets green; wealthier neighborhoods tend to have larger lots that can accommodate more tree canopy, and tend to attract a disproportionate investment in green spaces like parks and sidewalk tree beds.
Additional satellite data from the Multi-Resolution Land Characteristics Consortium National Land Cover Database shows strong relationships between income and tree cover that help explain variations in heat exposure. In Worcester, for example, there is a direct relationship between tree cover and poverty. While 23 of the 25 wealthiest census tracts in Worcester have at least 33% tree canopy coverage, according to satellite imagery data, just four of the 25 tracts with the highest poverty rates do. Another important variable associated with income and temperature is the amount of land covered by impervious surfaces like paved roads and parking lots, which absorb more solar radiation than green spaces and consequently compound heat in the poor neighborhoods in which they are most common.
This relationship between tree cover and land surface temperature is strongest in hot, dry cities with high sun exposure like Henderson, Las Vegas, Anaheim, and San Diego.
LIke many intra-urban disparities existing today, the lack of trees in poor neighborhoods stems in part from historical discriminatory housing practices like redlining that systematically segregated minorities into poor neighborhoods nearly a century ago. In cities with long-enduring redlining programs like Cleveland and Los Angeles, many of the warmest tracts today are the same ones marked “D” – or “hazardous” – on redlining maps in the 1930s that cut off downtown minority neighborhoods from the investment and economic growth that would go into mostly-white suburbs.
While today the delineation of hot and cool neighborhoods in U.S. cities is often coterminous with the boundary separating downtown and the outer suburbs, local governments can invest in new vegetation to help bridge the heat inequality gap. The City of Detroit, for example, planted 5,500 trees between 2017 and 2022 in an effort to improve health equity, and plans to plant 5,000 more. From 2017 to 2015, New York City planted over one million trees across all five boroughs, filling park edges and scattered slivers of land with new trees with the help of volunteers and property owners. Both cities have relatively weak relationships between income and heat compared to other metro areas.
As cities get hotter, the disparity in heat across urban tracts will become more dangerous, with poor neighborhoods facing disproportionate risk of heat-related illness like exhaustion and heat stroke. By seeing how temperature interacts with socioeconomic factors like income – or race, age, or other measures – cities and advocacy organizations can implement better solutions for reducing heat inequity and help combat climate change overall.
Methodology:
To determine the cities where income and temperatures are most strongly correlated, we reviewed tract-level data on land surface temperature from the USGS Landsat program and the U.S. Census Bureau’s 2022 American Community Survey. Cities were ranked based on the regression coefficient of average land surface temperature in July and August and income per capita. Census tract data were aggregated to the Census place level using spatial boundary definitions from the U.S. Census Bureau. Only cities with at least 50 census tracts overlapping with their boundaries were included in our study. Supplemental data on tree canopy coverage is from the Multi-Resolution Land Characteristics Consortium National Land Cover Database.