
Where Did The Trees Go? 25 Areas That Are Razing Forests at an Alarmingly Rapid Pace
 https://climate-crisis-247-bucket.nyc3.cdn.digitaloceanspaces.com/wp-content/uploads/2024/12/07233845/2490189-150x150.jpeg
According to a recent USDA study, approximately 36 million trees are destroyed in U.S. urban areas every year. Rapid urbanization in the 21st century has contributed to the loss of more than five million acres of tree cover throughout the country, resulting in higher carbon emissions and reduced air quality for city dwellers nationwide.
Hot property? From Maui to Malibu, These Affluent Enclaves Are Becoming Wildfire Hotspots
Grounded? Extreme Weather Events Are Causing More Delays at These Airports
In dozens of fast-growing cities throughout the Southeast, forested areas are being transformed into medium density development at a shocking pace, with more than half of all tree cover being converted to residential and commercial buildings. A look at recent satellite imagery reveals the cities that are destroying their forests at the fastest pace.
To determine the cities getting rid of their forests the fastest, Climate Crisis 247 reviewed data on land cover by class from the IPUMS NHGIS program of the Minnesota Population Center at the Institute for Social Research & Data Innovation at the University of Minnesota. Cities, towns, villages, and census-designated places were ranked based on the percentage-point change in forest as a percentage of total land cover from 2001 to 2021. Forest land cover includes the land cover classes deciduous forest, evergreen forest, and mixed forest. Supplemental data on population is from the U.S. Census Bureau.
25. Savannah, GA
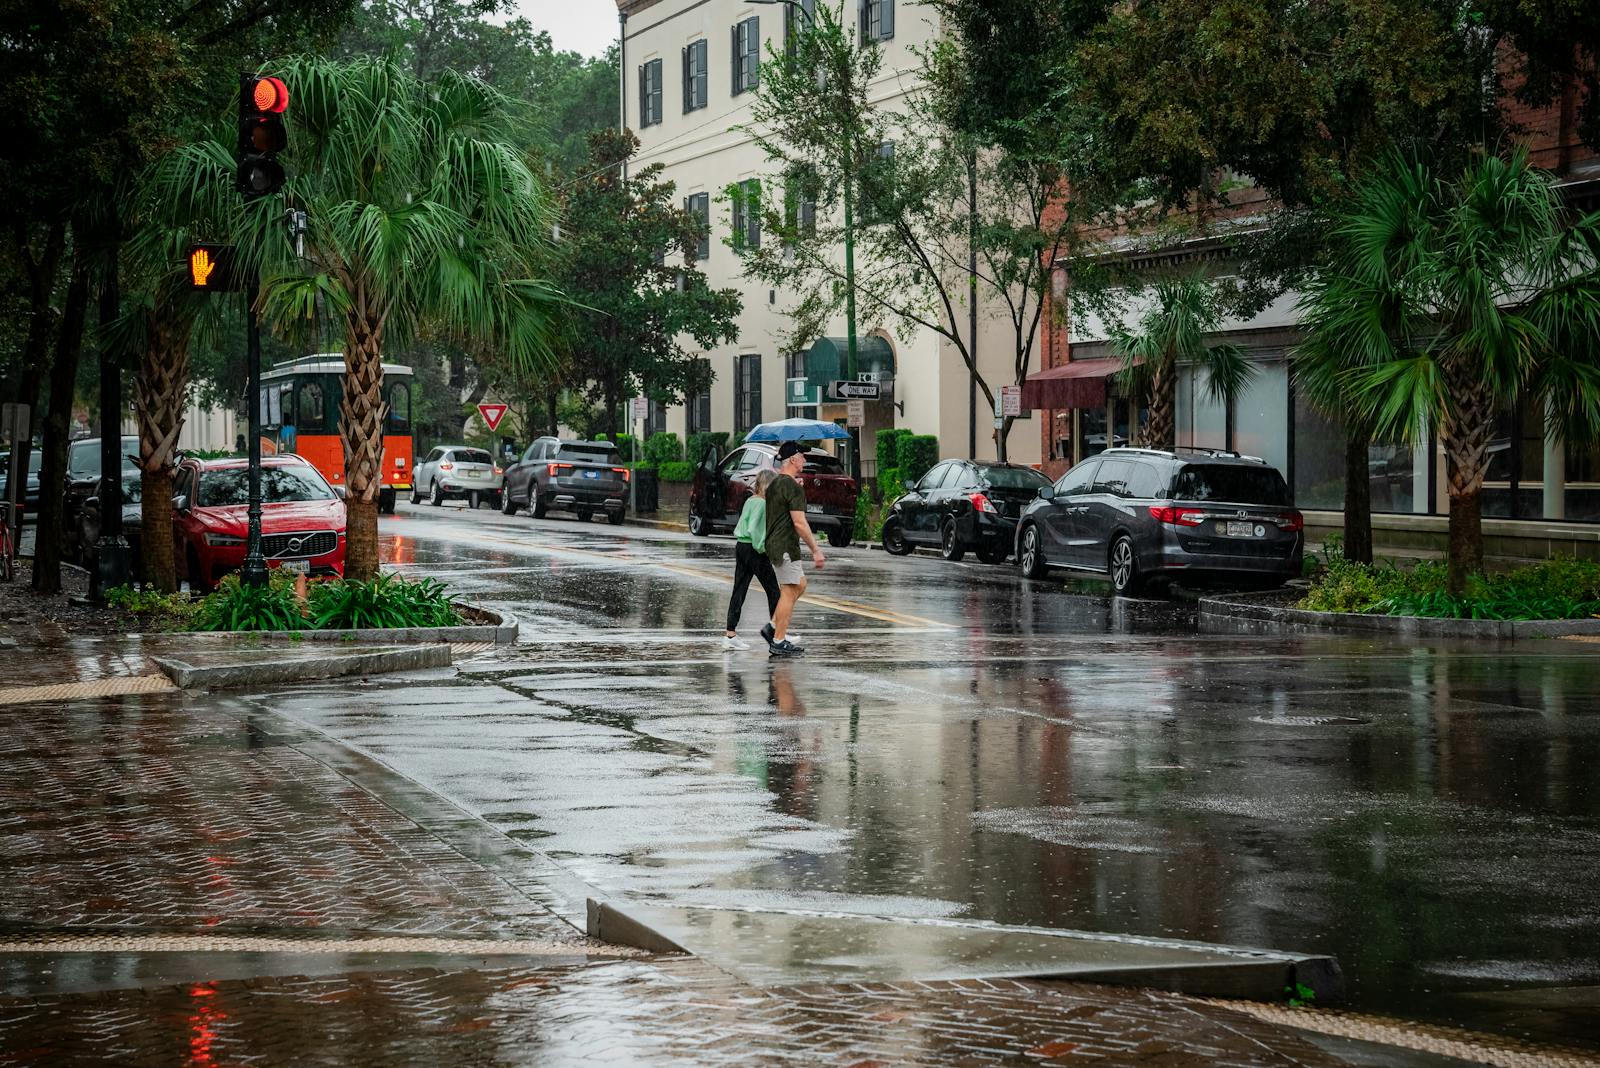
- Forest as percentage of land cover, 2021: 13.3% (-6.3 ppts from 2001)
- Forest as percentage of land cover, 2001: 19.6%
- Population change, 2000 to 2023: +12.2%
- Total population, 2023: 147,546
24. Pearland, TX
- Forest as percentage of land cover, 2021: 2.8% (-6.5 ppts from 2001)
- Forest as percentage of land cover, 2001: 9.3%
- Population change, 2000 to 2023: +234.7%
- Total population, 2023: 125,983
23. Tallahassee, FL
- Forest as percentage of land cover, 2021: 26.6% (-6.7 ppts from 2001)
- Forest as percentage of land cover, 2001: 33.3%
- Population change, 2000 to 2023: +32.6%
- Total population, 2023: 199,696
22. Little Rock, AR
- Forest as percentage of land cover, 2021: 22.3% (-7.1 ppts from 2001)
- Forest as percentage of land cover, 2001: 29.4%
- Population change, 2000 to 2023: +10.7%
- Total population, 2023: 202,739
21. Greenville, SC
- Forest as percentage of land cover, 2021: 10.9% (-7.2 ppts from 2001)
- Forest as percentage of land cover, 2001: 18.1%
- Population change, 2000 to 2023: +28.1%
- Total population, 2023: 71,755
20. Tyler, TX
- Forest as percentage of land cover, 2021: 14.2% (-7.2 ppts from 2001)
- Forest as percentage of land cover, 2001: 21.4%
- Population change, 2000 to 2023: +28.8%
- Total population, 2023: 107,718
19. Jacksonville, NC
- Forest as percentage of land cover, 2021: 15.9% (-7.6 ppts from 2001)
- Forest as percentage of land cover, 2001: 23.5%
- Population change, 2000 to 2023: +10.2%
- Total population, 2023: 73,507
18. O'Fallon, MO
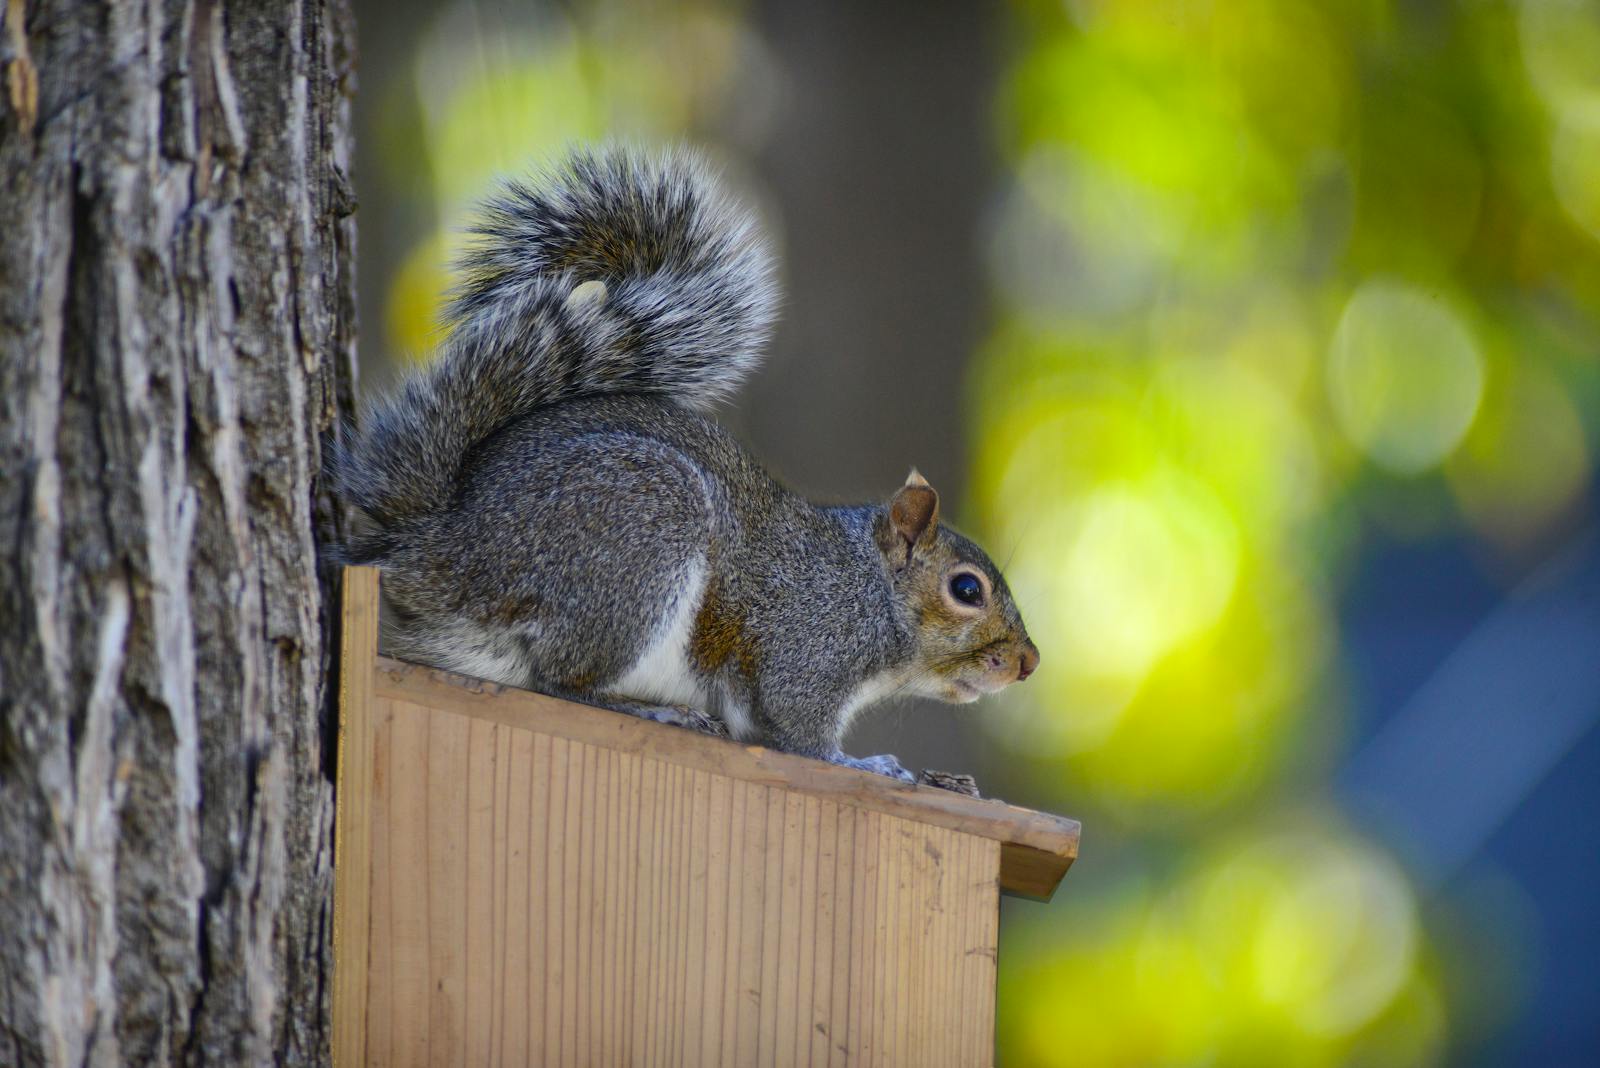
- Forest as percentage of land cover, 2021: 8.4% (-7.7 ppts from 2001)
- Forest as percentage of land cover, 2001: 16.1%
- Population change, 2000 to 2023: +100.8%
- Total population, 2023: 92,697
17. Raleigh, NC
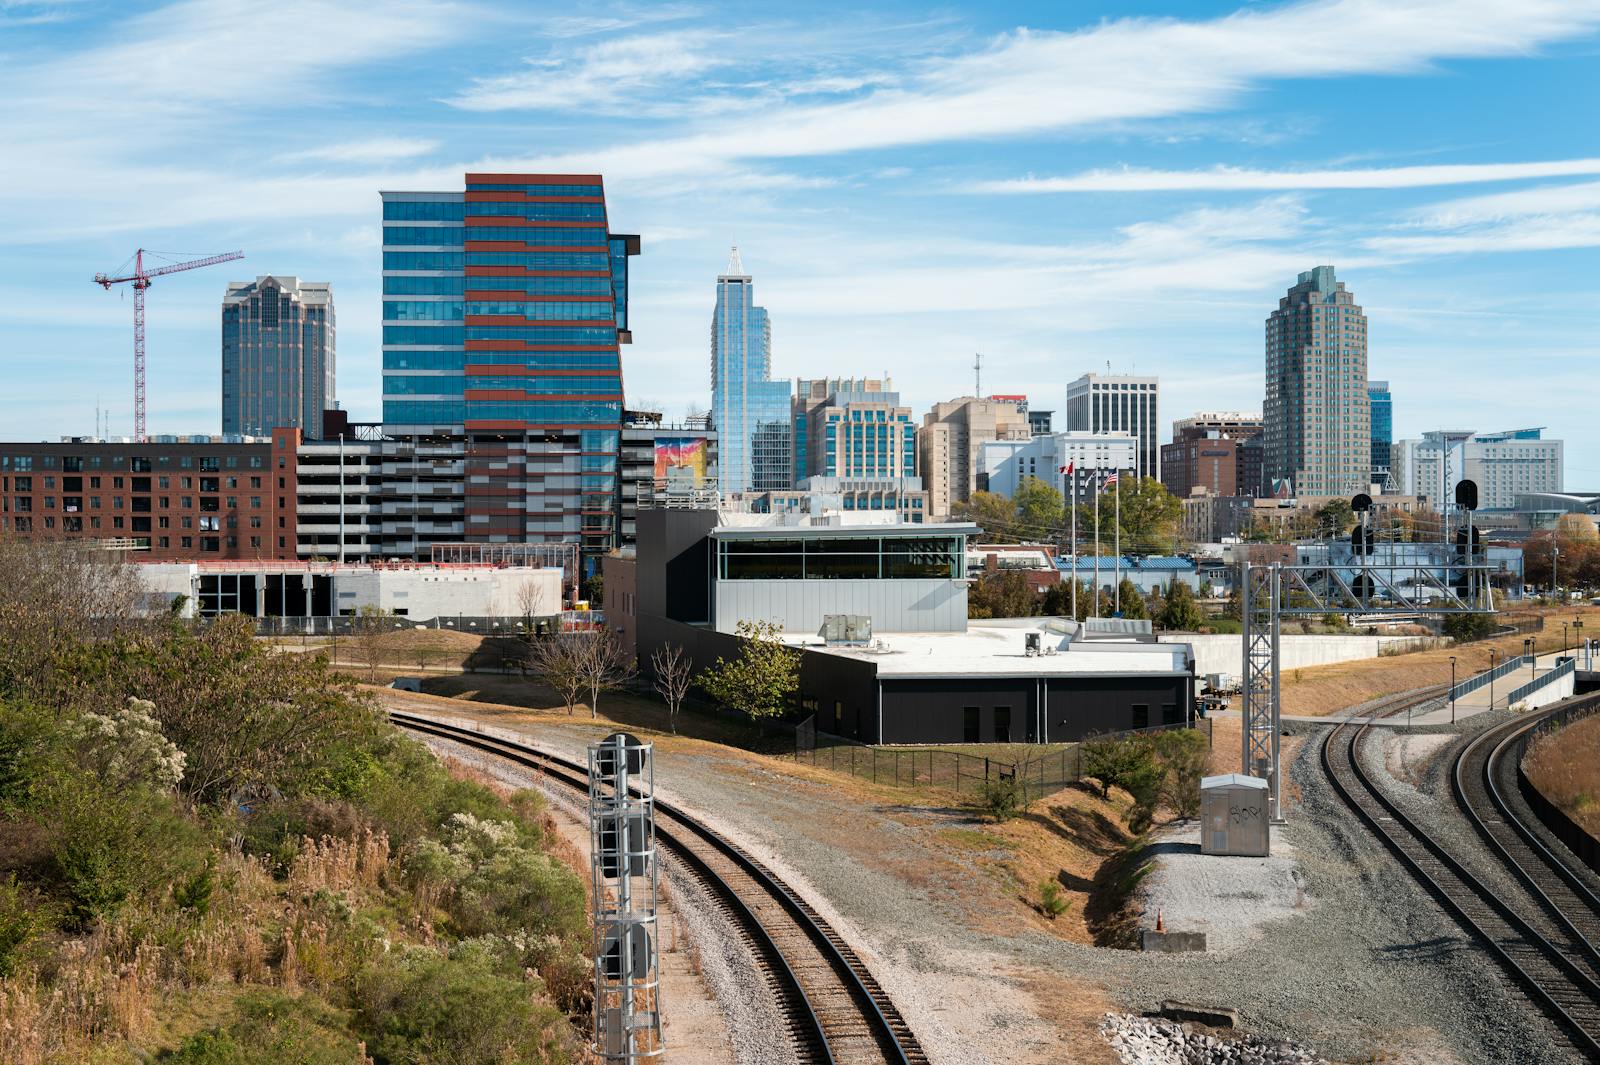
- Forest as percentage of land cover, 2021: 15.6% (-7.9 ppts from 2001)
- Forest as percentage of land cover, 2001: 23.5%
- Population change, 2000 to 2023: +70.5%
- Total population, 2023: 470,763
16. League City, TX
- Forest as percentage of land cover, 2021: 4.0% (-8.0 ppts from 2001)
- Forest as percentage of land cover, 2001: 12.0%
- Population change, 2000 to 2023: +152.8%
- Total population, 2023: 114,885
15. Warner Robins, GA
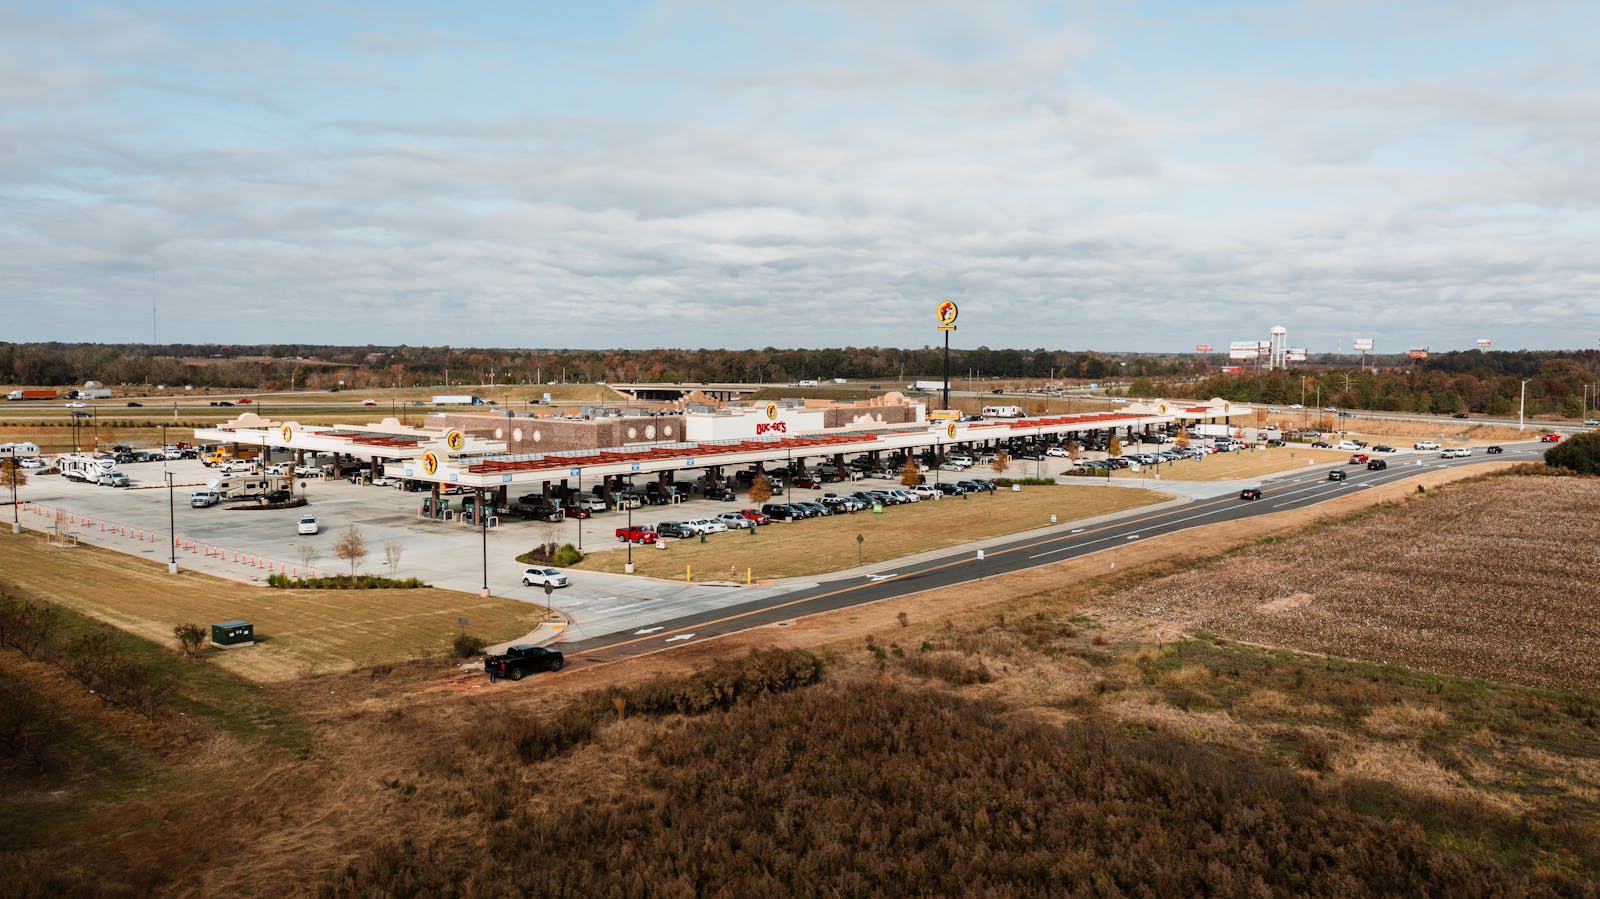
- Forest as percentage of land cover, 2021: 10.7% (-8.2 ppts from 2001)
- Forest as percentage of land cover, 2001: 18.9%
- Population change, 2000 to 2023: +66.9%
- Total population, 2023: 81,438
14. Mount Pleasant, SC
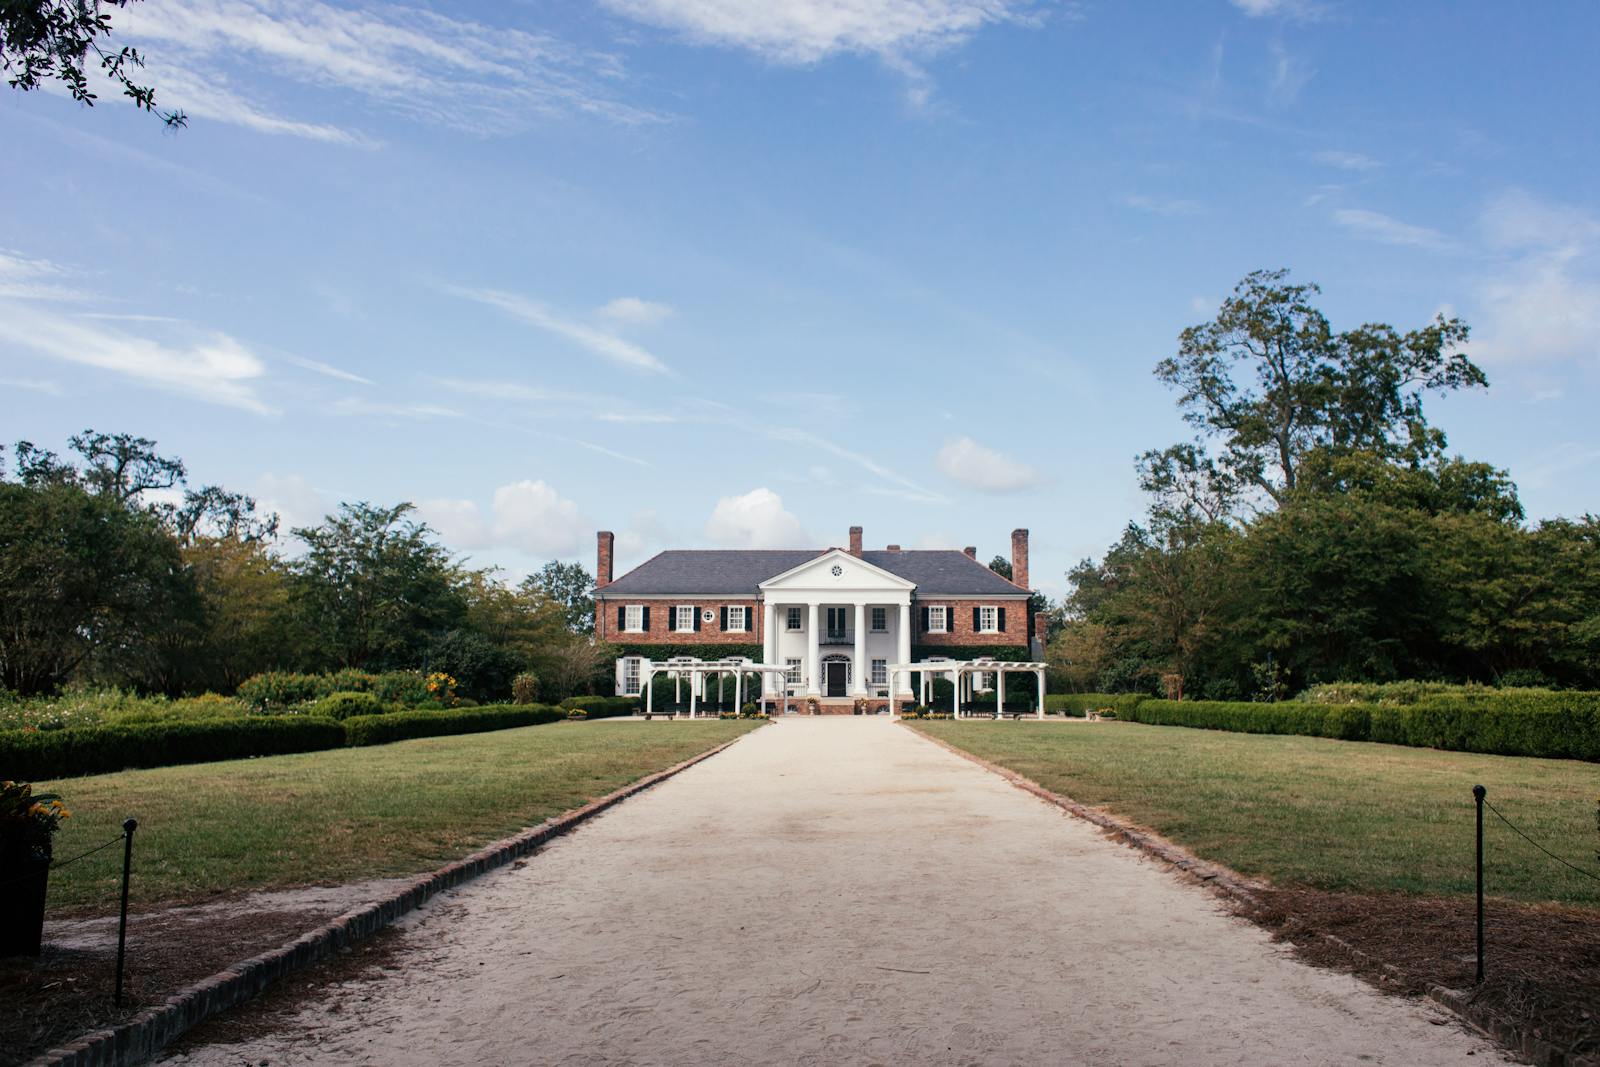
- Forest as percentage of land cover, 2021: 11.4% (-8.4 ppts from 2001)
- Forest as percentage of land cover, 2001: 19.8%
- Population change, 2000 to 2023: +94.6%
- Total population, 2023: 92,662
13. Alpharetta, GA

- Forest as percentage of land cover, 2021: 13.6% (-8.5 ppts from 2001)
- Forest as percentage of land cover, 2001: 22.2%
- Population change, 2000 to 2023: +90.4%
- Total population, 2023: 66,355
12. Concord, NC
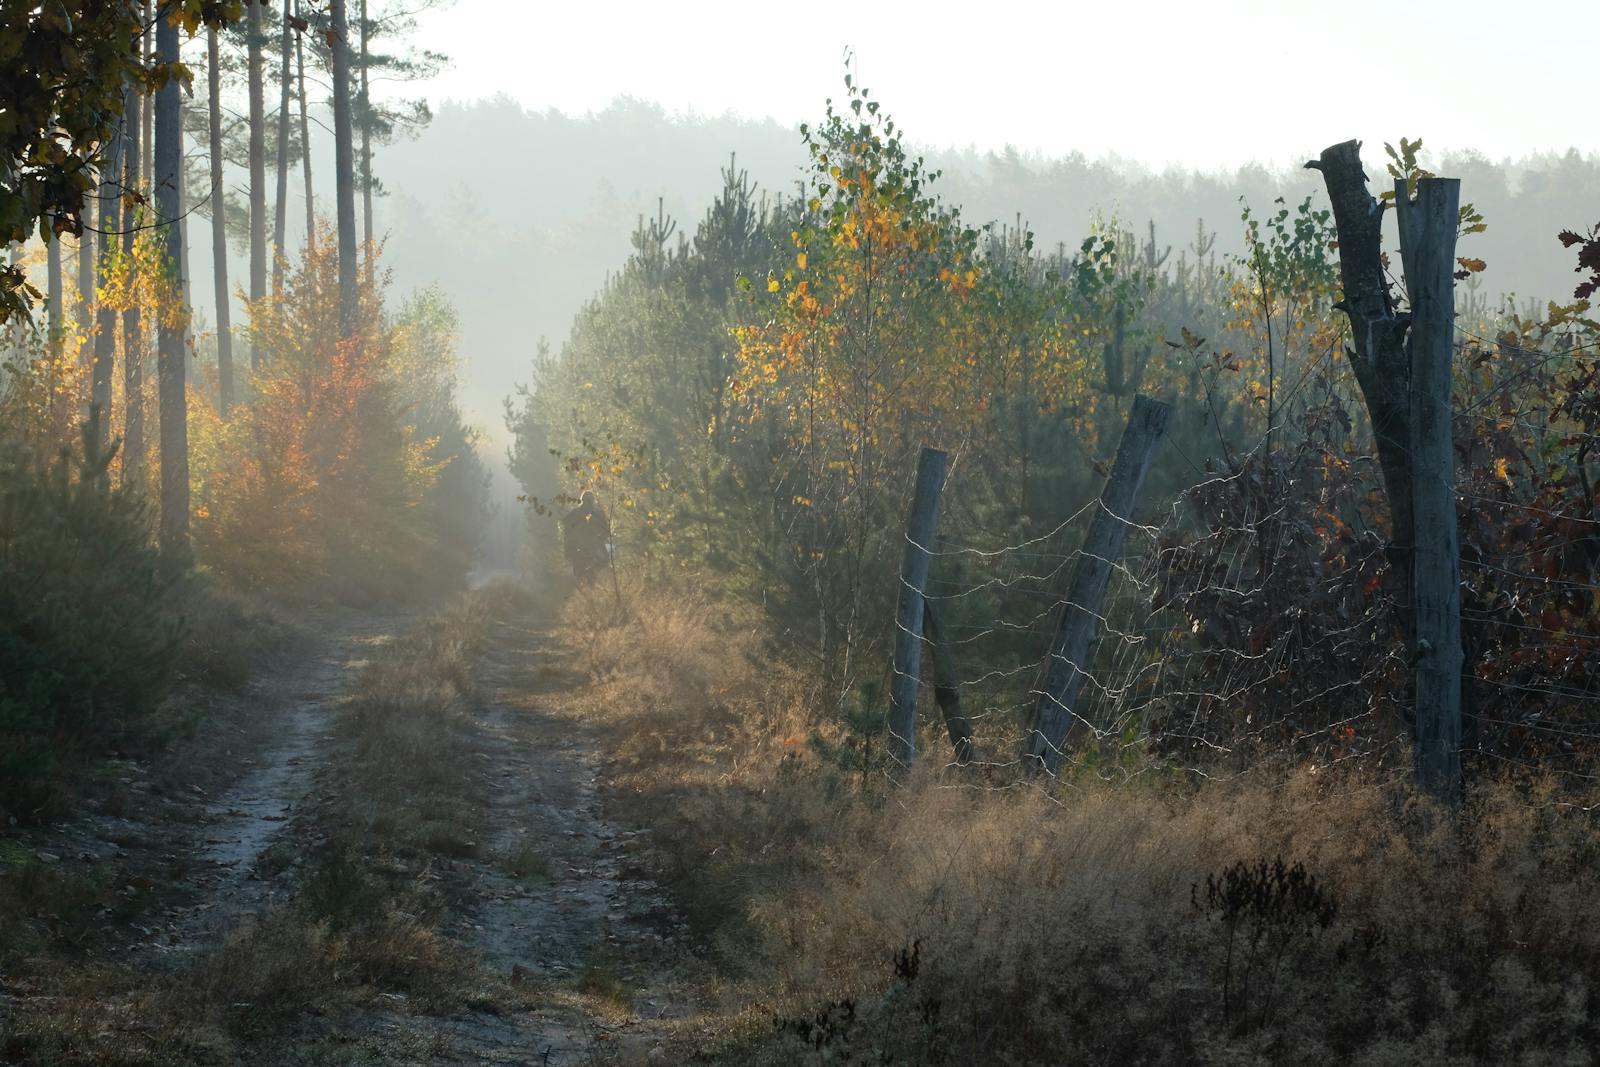
- Forest as percentage of land cover, 2021: 17.1% (-9.2 ppts from 2001)
- Forest as percentage of land cover, 2001: 26.3%
- Population change, 2000 to 2023: +90.3%
- Total population, 2023: 106,518
11. Rock Hill, SC

- Forest as percentage of land cover, 2021: 23.3% (-9.3 ppts from 2001)
- Forest as percentage of land cover, 2001: 32.5%
- Population change, 2000 to 2023: +50.2%
- Total population, 2023: 74,769
10. Durham, NC
- Forest as percentage of land cover, 2021: 19.7% (-9.5 ppts from 2001)
- Forest as percentage of land cover, 2001: 29.3%
- Population change, 2000 to 2023: +54.2%
- Total population, 2023: 288,465
9. Auburn, AL
- Forest as percentage of land cover, 2021: 36.0% (-11.7 ppts from 2001)
- Forest as percentage of land cover, 2001: 47.7%
- Population change, 2000 to 2023: +83.2%
- Total population, 2023: 78,738
8. Conroe, TX
- Forest as percentage of land cover, 2021: 25.0% (-13.6 ppts from 2001)
- Forest as percentage of land cover, 2001: 38.5%
- Population change, 2000 to 2023: +163.4%
- Total population, 2023: 96,976
7. Hoover, AL
- Forest as percentage of land cover, 2021: 29.9% (-15.2 ppts from 2001)
- Forest as percentage of land cover, 2001: 45.0%
- Population change, 2000 to 2023: +47.3%
- Total population, 2023: 92,401
6. Leander, TX
- Forest as percentage of land cover, 2021: 26.5% (-16.5 ppts from 2001)
- Forest as percentage of land cover, 2001: 43.0%
- Population change, 2000 to 2023: +793.6%
- Total population, 2023: 67,880
5. Cary, NC
- Forest as percentage of land cover, 2021: 13.6% (-17.8 ppts from 2001)
- Forest as percentage of land cover, 2001: 31.3%
- Population change, 2000 to 2023: +86.9%
- Total population, 2023: 176,686
4. Cedar Park, TX
- Forest as percentage of land cover, 2021: 16.0% (-18.2 ppts from 2001)
- Forest as percentage of land cover, 2001: 34.3%
- Population change, 2000 to 2023: +197.4%
- Total population, 2023: 77,474
3. The Woodlands, TX
- Forest as percentage of land cover, 2021: 7.8% (-19.7 ppts from 2001)
- Forest as percentage of land cover, 2001: 27.5%
- Population change, 2000 to 2023: +110.3%
- Total population, 2023: 116,916
2. Apex, NC
- Forest as percentage of land cover, 2021: 22.4% (-22.4 ppts from 2001)
- Forest as percentage of land cover, 2001: 44.8%
- Population change, 2000 to 2023: +235.3%
- Total population, 2023: 67,765
1. Atascocita, TX
- Forest as percentage of land cover, 2021: 12.6% (-27.4 ppts from 2001)
- Forest as percentage of land cover, 2001: 40.0%
- Population change, 2000 to 2023: +162.4%
- Total population, 2023: 93,926