
The 10 Counties Hardest Hit by Drought This Summer
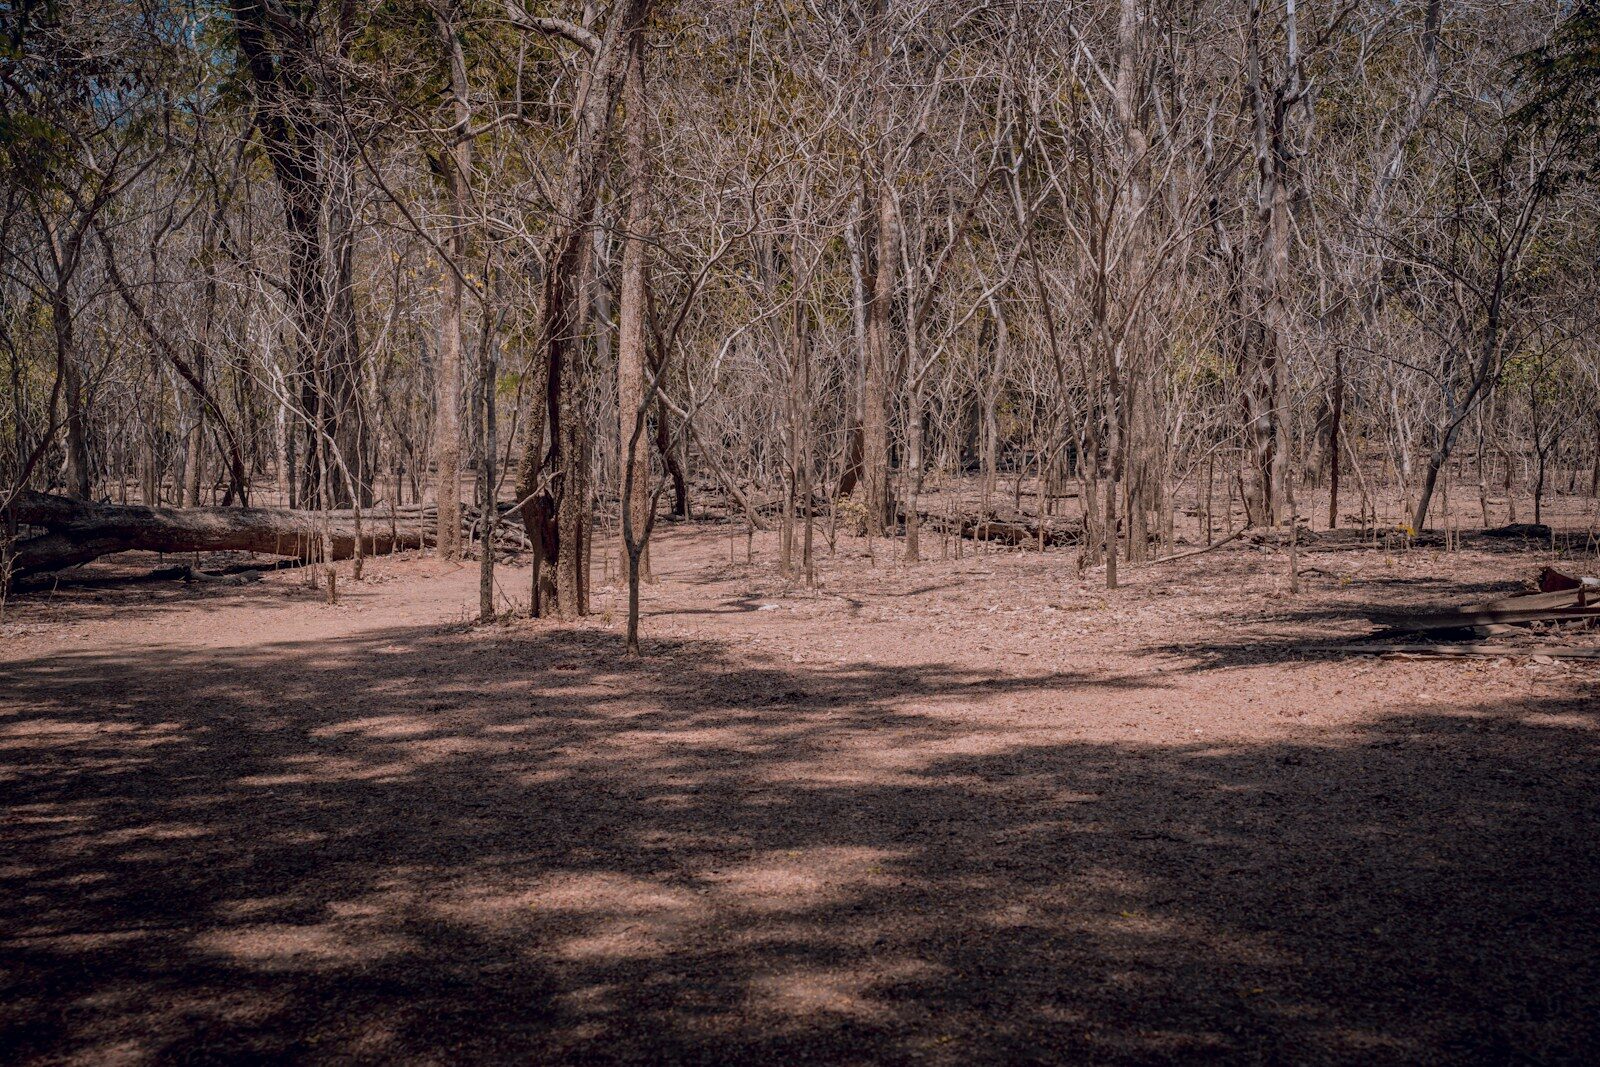
This summer, the United States is facing a widespread and historically devastating drought. According to the U.S. Drought Monitor, only about a third of land area across the 50 states is drought free. As of mid-July, the extent of the ongoing drought is farther reaching than in any other year in the 21st century, with the exception of 2012 and 2022.
To express the intensity of drought conditions in a given area, the U.S. Drought Monitor uses a five-tier classification system: D0 for abnormally dry, D1 for moderate drought, D2 for severe drought, D3 for extreme drought, and D4 for exceptional drought. Currently, most impacted areas are either abnormally dry or in a moderate drought, and only about 29% of the country is reporting severe or worse drought conditions.
But in some of the hardest hit states, largely concentrated along the Eastern Seaboard and in the Rocky Mountain region, limited precipitation and unusually high temperatures have fueled extreme or exceptional drought conditions across entire counties. In many of these places, droughts have led to water use restrictions and significantly increased wildfire risk.
Using data from the U.S. Drought Monitor, Climate Crisis 247 identified the counties hardest hit by drought this summer. We ranked all U.S. counties on the share of land area reporting exceptional drought. Only the 10 counties where all land area is in an extreme drought or worse are listed. Supplemental data on county-wide, 20th century temperature averages are from the National Oceanic and Atmospheric Administration. Additional data on rainfall, average temperatures, and high temperatures in 2026, as reported by individual weather stations within the relevant county, are from NOAA’s Northeast Regional Climate Center.
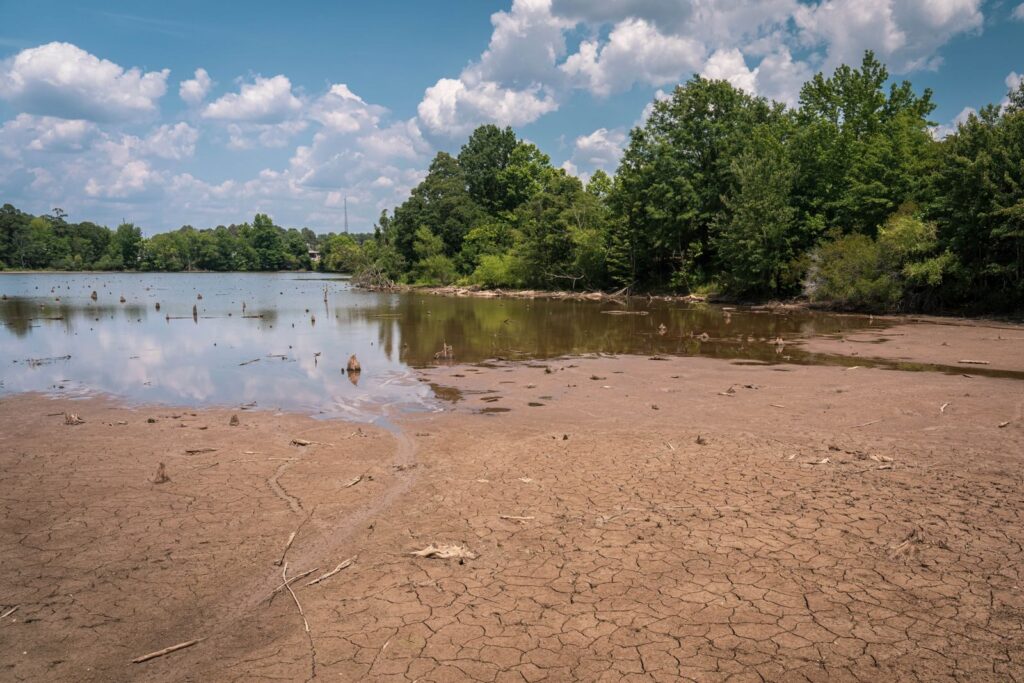
10. Orange County, North Carolina
- Drought conditions by land area in county: 35.6% extreme drought, 64.4% exceptional drought
- Total rainfall in the last 30 days: 2.4 inches (50.0% of normal rainfall)
- Total rainfall in the last 60 days: 4.7 inches (53.0% of normal rainfall)
- Total rainfall in the last 90 days: 6.4 inches (51.5% of normal rainfall)
- Highest reported temp. in county, June 1 – July 21, 2026: 101°F
- Average temp. in county, June 1 – July 21, 2026: 78.7°F (3.4°F higher than 20th century June-July avg.)
9. Caswell County, North Carolina
- Drought conditions by land area in county: 31.1% extreme drought, 68.9% exceptional drought
- Total rainfall in the last 30 days: 2.4 inches (58.5% of normal rainfall)
- Total rainfall in the last 60 days: 3.9 inches (44.2% of normal rainfall)
- Total rainfall in the last 90 days: 6.2 inches (48.0% of normal rainfall)
- Highest reported temp. in county, June 1 – July 21, 2026: 103°F
- Average temp. in county, June 1 – July 21, 2026: 77.7°F (2.2°F higher than 20th century June-July avg.)
8. Alamance County, North Carolina
- Drought conditions by land area in county: 27.8% extreme drought, 72.2% exceptional drought
- Total rainfall in the last 30 days: 3.0 inches (68.7% of normal rainfall)
- Total rainfall in the last 60 days: 6.4 inches (73.2% of normal rainfall)
- Total rainfall in the last 90 days: 8.2 inches (67.8% of normal rainfall)
- Highest reported temp. in county, June 1 – July 21, 2026: 101°F
- Average temp. in county, June 1 – July 21, 2026: 78.9°F (3.2°F higher than 20th century June-July avg.)
7. Chaffee County, Colorado
- Drought conditions by land area in county: 22.1% extreme drought, 77.9% exceptional drought
- Total rainfall in the last 30 days: 1.0 inches (83.5% of normal rainfall)
- Total rainfall in the last 60 days: 1.1 inches (57.8% of normal rainfall)
- Total rainfall in the last 90 days: 2.1 inches (68.6% of normal rainfall)
- Highest reported temp. in county, June 1 – July 21, 2026: 93°F
- Average temp. in county, June 1 – July 21, 2026: 66.0°F (11.1°F higher than 20th century June-July avg.)
6. Person County, North Carolina
- Drought conditions by land area in county: 21.4% extreme drought, 78.6% exceptional drought
- Total rainfall in the last 30 days: 2.9 inches (76.7% of normal rainfall)
- Total rainfall in the last 60 days: 4.6 inches (56.1% of normal rainfall)
- Total rainfall in the last 90 days: 6.3 inches (53.7% of normal rainfall)
- Highest reported temp. in county, June 1 – July 21, 2026: 104°F
- Average temp. in county, June 1 – July 21, 2026: 81.2°F (6.4°F higher than 20th century June-July avg.)
5. Summit County, Colorado
- Drought conditions by land area in county: 12.3% extreme drought, 87.7% exceptional drought
- Total rainfall in the last 30 days: 0.8 inches (50.0% of normal rainfall)
- Total rainfall in the last 60 days: 0.8 inches (30.6% of normal rainfall)
- Total rainfall in the last 90 days: 2.8 inches (69.7% of normal rainfall)
- Highest reported temp. in county, June 1 – July 21, 2026: 87°F
- Average temp. in county, June 1 – July 21, 2026: 57.2°F (4.7°F higher than 20th century June-July avg.)
4. Guilford County, North Carolina
- Drought conditions by land area in county: 4.7% extreme drought, 95.3% exceptional drought
- Total rainfall in the last 30 days: 2.7 inches (68.9% of normal rainfall)
- Total rainfall in the last 60 days: 5.3 inches (67.7% of normal rainfall)
- Total rainfall in the last 90 days: 6.7 inches (59.6% of normal rainfall)
- Highest reported temp. in county, June 1 – July 21, 2026: 100°F
- Average temp. in county, June 1 – July 21, 2026: 79.2°F (3.8°F higher than 20th century June-July avg.)
3. Eagle County, Colorado
- Drought conditions by land area in county: 100% exceptional drought
- Total rainfall in the last 30 days: 1.5 inches (82.0% of normal rainfall)
- Total rainfall in the last 60 days: 1.5 inches (48.6% of normal rainfall)
- Total rainfall in the last 90 days: 4.3 inches (77.8% of normal rainfall)
- Highest reported temp. in county, June 1 – July 21, 2026: 100°F
- Average temp. in county, June 1 – July 21, 2026: 65.7°F (8.7°F higher than 20th century June-July avg.)
2. Lake County, Colorado
- Drought conditions by land area in county: 100% exceptional drought
- Total rainfall in the last 30 days: 0.4 inches (30.2% of normal rainfall)
- Total rainfall in the last 60 days: 0.6 inches (26.4% of normal rainfall)
- Total rainfall in the last 90 days: 1.4 inches (40.3% of normal rainfall)
- Highest reported temp. in county, June 1 – July 21, 2026: 84°F
- Average temp. in county, June 1 – July 21, 2026: 59.1°F (7.9°F higher than 20th century June-July avg.)
1. Pitkin County, Colorado
- Drought conditions by land area in county: 100% exceptional drought
- Total rainfall in the last 30 days: 0.5 inches (33.6% of normal rainfall)
- Total rainfall in the last 60 days: 0.5 inches (24.3% of normal rainfall)
- Total rainfall in the last 90 days: 1.8 inches (46.0% of normal rainfall)
- Highest reported temp. in county, June 1 – July 21, 2026: 96°F
- Average temp. in county, June 1 – July 21, 2026: 66.3°F (11.6°F higher than 20th century June-July avg.)
More from ClimateCrisis 247
- Highest Record-Breaking Temperatures this Summer Were Well Above 100F
- America’s largest Data Center Uses More Electricity Than Houston
- Most ER Visits Due To Heat Related Illness in the US From 2018 to 2025
- The Four Worst Droughts In US History





