10 Coastal Counties Americans are Leaving

The number of Americans who move each year has been on a steady downward trend for decades. According to the U.S. Census Bureau, only 11.6% of the population moved to a new home in 2025, down from 16.8% 20 years earlier. But the latest population-change data shows that, while fewer Americans are moving, they are leaving certain places far faster than others–and climate change is likely a factor behind the trend.
Of all predictable consequences associated with climate change, sea level rise is likely among the most disruptive and devastating. Even if greenhouse gas emissions are substantially reduced, sea levels along the U.S. coast are expected to rise 2 feet by the end of the century–and by over 7 feet in a high emissions scenario. Absent major infrastructure projects, such increases would be devastating to coastal communities.
Awareness of the threats climate change can pose appears to be growing. Census Bureau polling statistics show that the share of Americans who cited climate change or natural disasters as a reason for relocating rose from 1% to 1.2% between 2021 and 2022, the latest years of available data. More recently population data shows that, in many coastal communities, people are moving out much faster than they are moving in.
Using data from the U.S. Census Bureau, Climate Crisis 247 identified the coastal counties Americans are fleeing. We ranked all coastal counties and county equivalents, with populations of at least 250,000, on the relative population change reported between 2024 and 2025. Supplemental data on projected sea level rise is from the Coastal Risk Finder. Data on cost and length of sea walls necessary to protect these places is from the Center for Climate Integrity. While we only ranked coastal counties, every county on this list also ranks among the top 20 of all U.S. counties with populations of at least a quarter million for population decline in the last year.
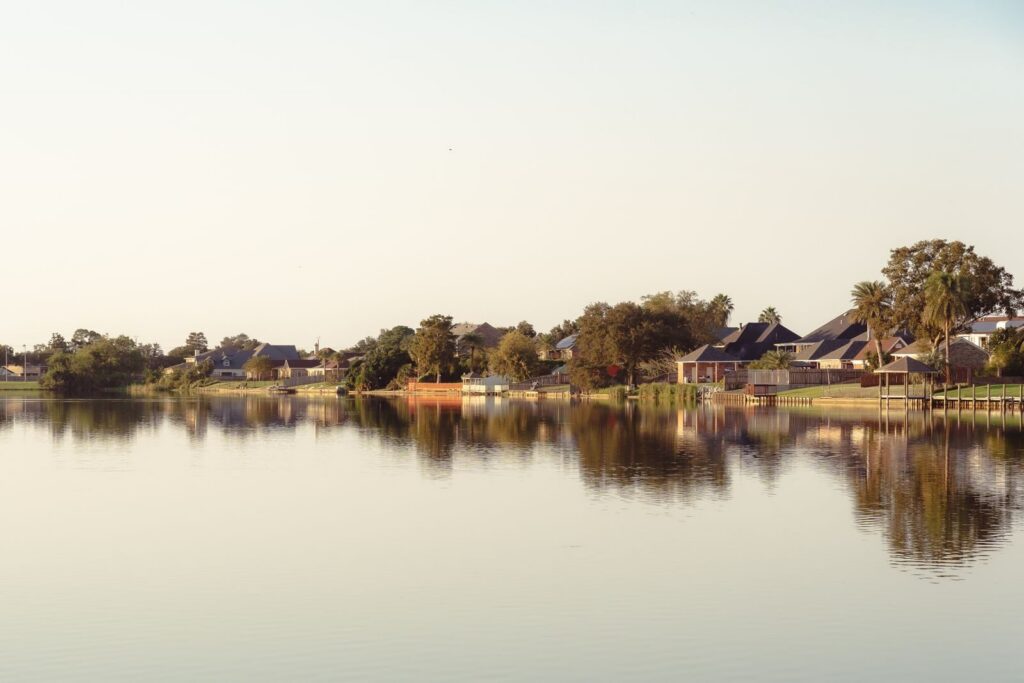
10. Jefferson Parish, Louisiana (Gulf Coast)
- Population change, 2024-2025: -0.2% (-1,006 people)
- Population decline rank among all large U.S. counties: 19th largest
- Local population by year: 431,398 in 2025; 432,404 2024
- Projected sea level rise by year: 1.70 feet by 2050, 4.0 feet by 2100
- Length of protective sea walls needed by 2050: 253 miles (estimated cost of$1.5 billion)
9. Orange County, California (Pacific Coast)
- Population change, 2024-2025: -0.3% (-8,520 people)
- Population decline rank among all large U.S. counties: 17th largest
- Local population by year: 3,149,507 in 2025; 3,158,027 2024
- Projected sea level rise by year: 0.60 feet by 2050, 1.6 feet by 2100
- Length of protective sea walls needed by 2050: 50 miles (estimated cost of$766.1 million)
8. Ventura County, California (Pacific Coast)
- Population change, 2024-2025: -0.3% (-2,580 people)
- Population decline rank among all large U.S. counties: 14th largest
- Local population by year: 830,851 in 2025; 833,431 2024
- Projected sea level rise by year: 0.60 feet by 2050, 1.6 feet by 2100
- Length of protective sea walls needed by 2050: 16 miles (estimated cost of$409.7 million)
7. Miami-Dade County, Florida (Atlantic Coast)
- Population change, 2024-2025: -0.4% (-10,115 people)
- Population decline rank among all large U.S. counties: 11th largest
- Local population by year: 2,802,029 in 2025; 2,812,144 2024
- Projected sea level rise by year: 0.95 feet by 2050, 2.3 feet by 2100
- Length of protective sea walls needed by 2050: 267 miles (estimated cost of$3.2 billion)
6. Orleans Parish, Louisiana (Gulf Coast)
- Population change, 2024-2025: -0.4% (-1,323 people)
- Population decline rank among all large U.S. counties: 10th largest
- Local population by year: 362,154 in 2025; 363,477 2024
- Projected sea level rise by year: 1.60 feet by 2050, 3.5 feet by 2100
- Length of protective sea walls needed by 2050: 136 miles (estimated cost of$724.5 million)
5. Queens County, New York (Atlantic Coast)
- Population change, 2024-2025: -0.4% (-8,852 people)
- Population decline rank among all large U.S. counties: 9th largest
- Local population by year: 2,358,182 in 2025; 2,367,034 2024
- Projected sea level rise by year: 1.20 feet by 2050, 2.7 feet by 2100
- Length of protective sea walls needed by 2050: 43 miles (estimated cost of$588.6 million)
4. Los Angeles County, California (Pacific Coast)
- Population change, 2024-2025: -0.6% (-53,934 people)
- Population decline rank among all large U.S. counties: 7th largest
- Local population by year: 9,694,934 in 2025; 9,748,868 2024
- Projected sea level rise by year: 0.57 feet by 2050, 1.6 feet by 2100
- Length of protective sea walls needed by 2050: 43 miles (estimated cost of$523.5 million)
3. Marin County, California (Pacific Coast)
- Population change, 2024-2025: -0.8% (-2,010 people)
- Population decline rank among all large U.S. counties: 4th largest
- Local population by year: 253,694 in 2025; 255,704 2024
- Projected sea level rise by year: 0.64 feet by 2050, 1.8 feet by 2100
- Length of protective sea walls needed by 2050: 133 miles (estimated cost of$1.1 billion)
2. Santa Cruz County, California (Pacific Coast)
- Population change, 2024-2025: -1.0% (-2,565 people)
- Population decline rank among all large U.S. counties: 2nd largest
- Local population by year: 258,852 in 2025; 261,417 2024
- Projected sea level rise by year: 0.60 feet by 2050, 1.6 feet by 2100
- Length of protective sea walls needed by 2050: 26 miles (estimated cost of$758.9 million)
1. Pinellas County, Florida (Gulf Coast)
- Population change, 2024-2025: -1.2% (-11,834 people)
- Population decline rank among all large U.S. counties: the largest
- Local population by year: 948,563 in 2025; 960,397 2024
- Projected sea level rise by year: 1.00 feet by 2050, 2.4 feet by 2100
- Length of protective sea walls needed by 2050: 240 miles (estimated cost of$3.0 billion)
More from ClimateCrisis 247
- Global Warming Remains Unchecked, Experts Warn at UN’s COP31 Climate Summit
- The World’s Cleanest Nations That Power AI Data Centers
- US Counties With the Most Snowfall in November So Far
- These 15 cities Likely to get the most snow this winter