25 US Cities With Looming Water Crises
 https://climate-crisis-247-bucket.nyc3.cdn.digitaloceanspaces.com/wp-content/uploads/2025/10/20215121/Annual-water-withdrawals-as-share-of-renewable-water-supply-150x150.png
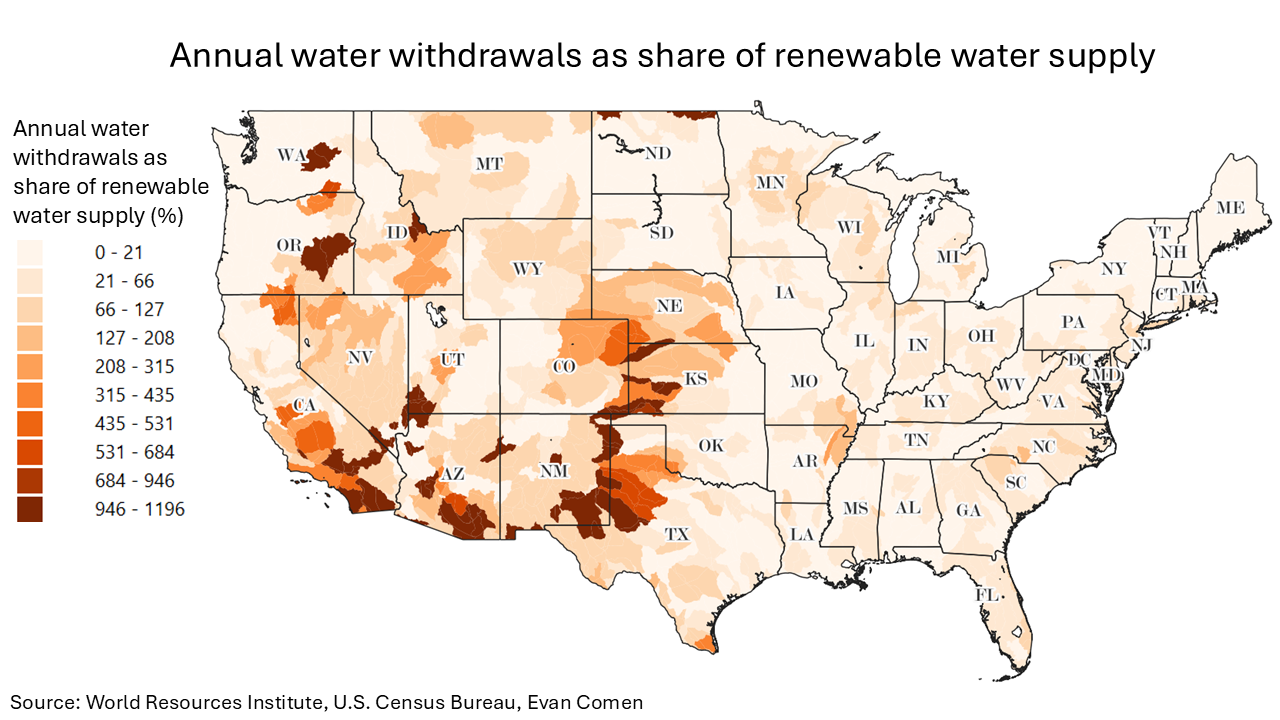
In most U.S. counties, water supply outweighs demand. With a bulk of the population living in sustainable water basins – where the supply of renewable water is greater than its withdrawal – the United States ranks 71st out of 181 countries in baseline water stress.
In some municipalities, however, net consumption of water is far greater than renewable
freshwater available at the sub-basin level. In water-scare cities like Lubbock, Texas and Chandler, Arizona – where year-round water consumption outweighs renewable water supply by sevenfold –residential and industrial consumers depend on non-renewable and imported water sources, relying on river diversions from hundreds of miles away or groundwater pumps that can draw down aquifers and result in overdrafting. A closer look at the data reveals the cities where water demand outpaces supply the most.
To determine the U.S. cities with looming water crises, Climate Crisis 247 reviewed data on water demand and supply from the World Resources Institute. Cities are ranked based on average baseline water stress – the ratio of net water consumption to available renewable freshwater available to a sub-basin, which includes surface flow, interflow, and groundwater recharge. Data was aggregated from the sub-basin level to cities using QGIS. Supplemental data on drought conditions are from the U.S. Drought Monitor. Only cities with at least 100,000 residents were considered, with only the highest-ranking city in each county included.
25. Boise City, ID
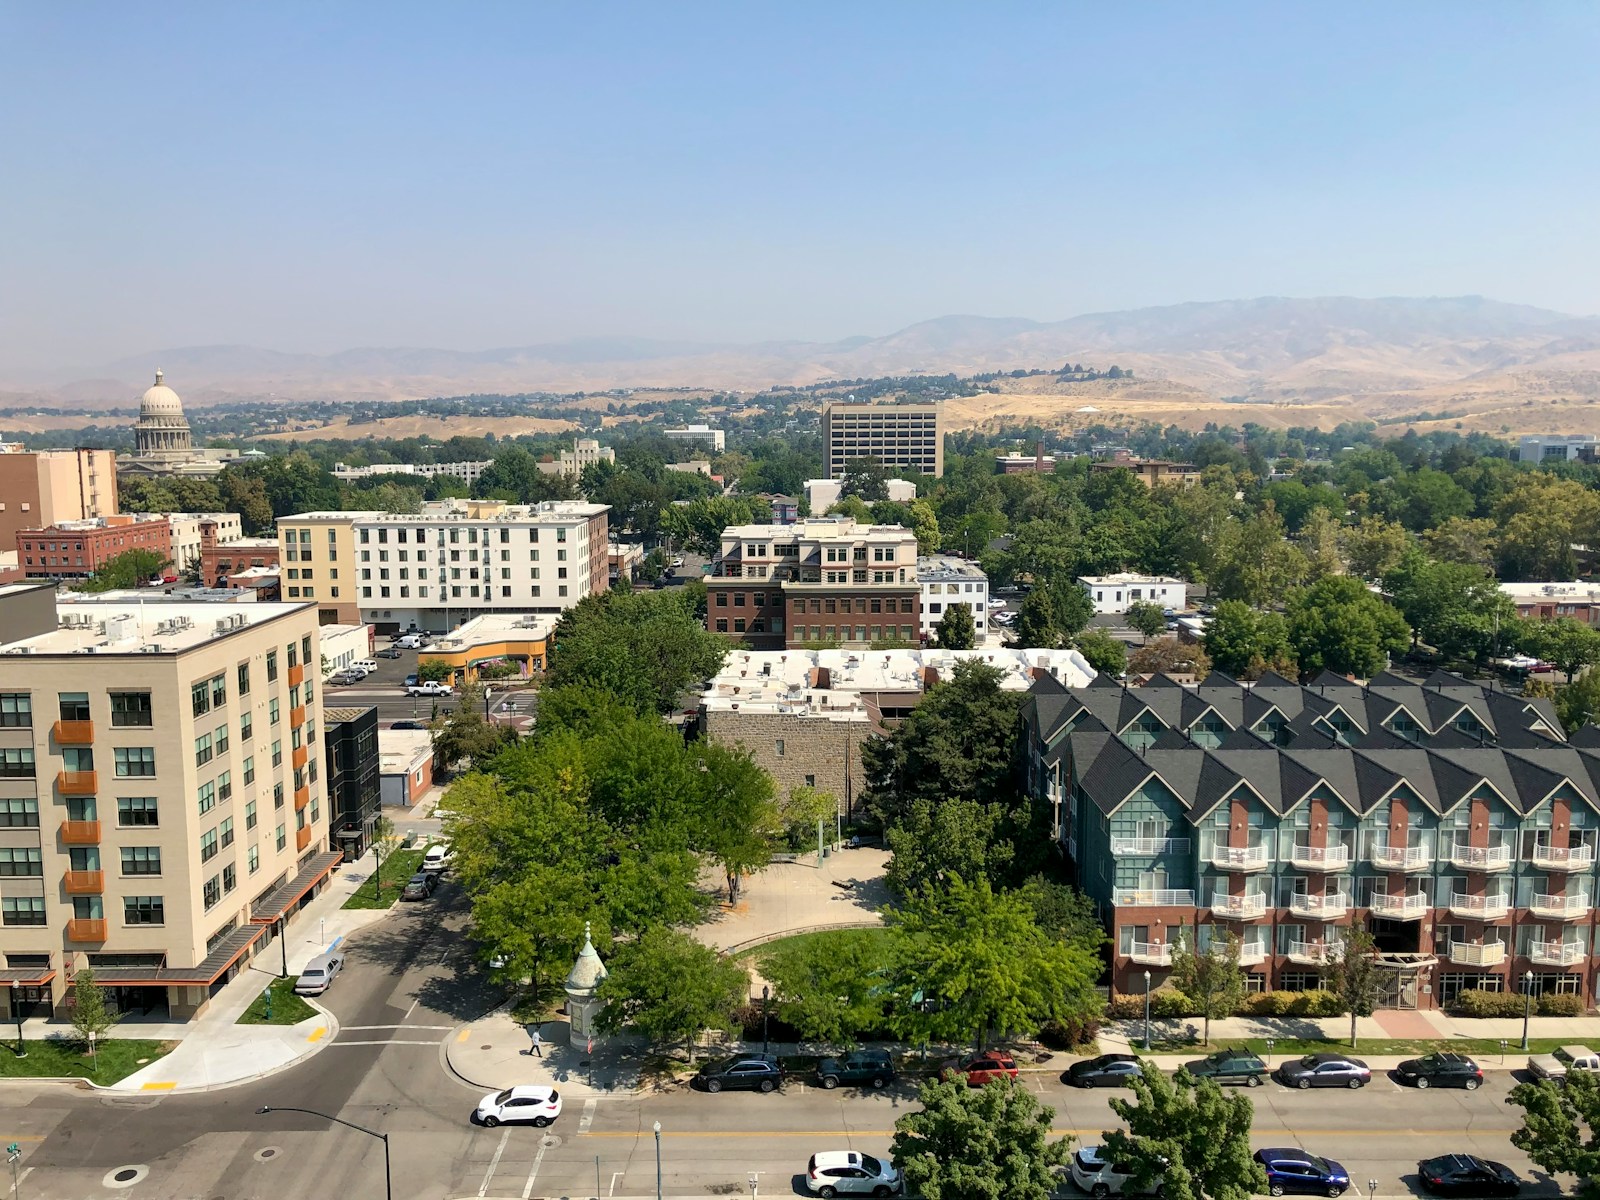
- Annual water withdrawals: 162.7% of renewable supply
- Land area that is abnormally dry: 100.0%
- Value of all homes: $28.4 billion
- Total population: 234,192
24. Concord, NC
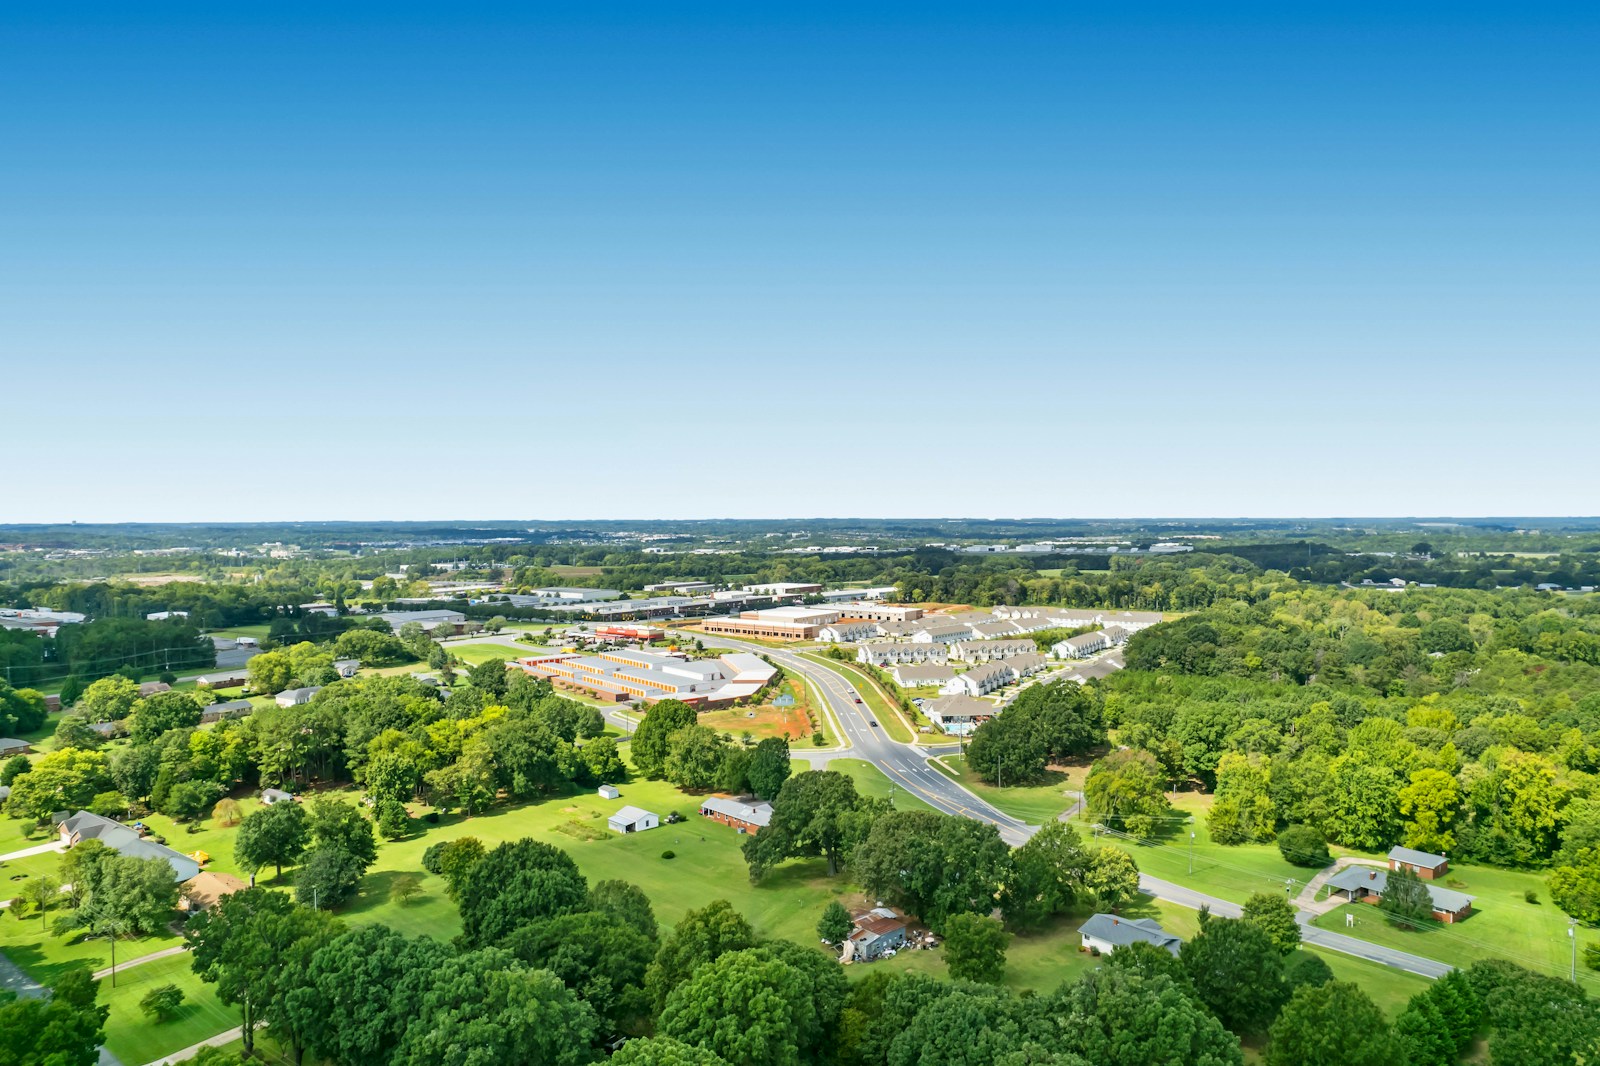
- Annual water withdrawals: 172.1% of renewable supply
- Land area that is abnormally dry: 64.2%
- Value of all homes: $7.8 billion
- Total population: 105,335
23. Amarillo, TX
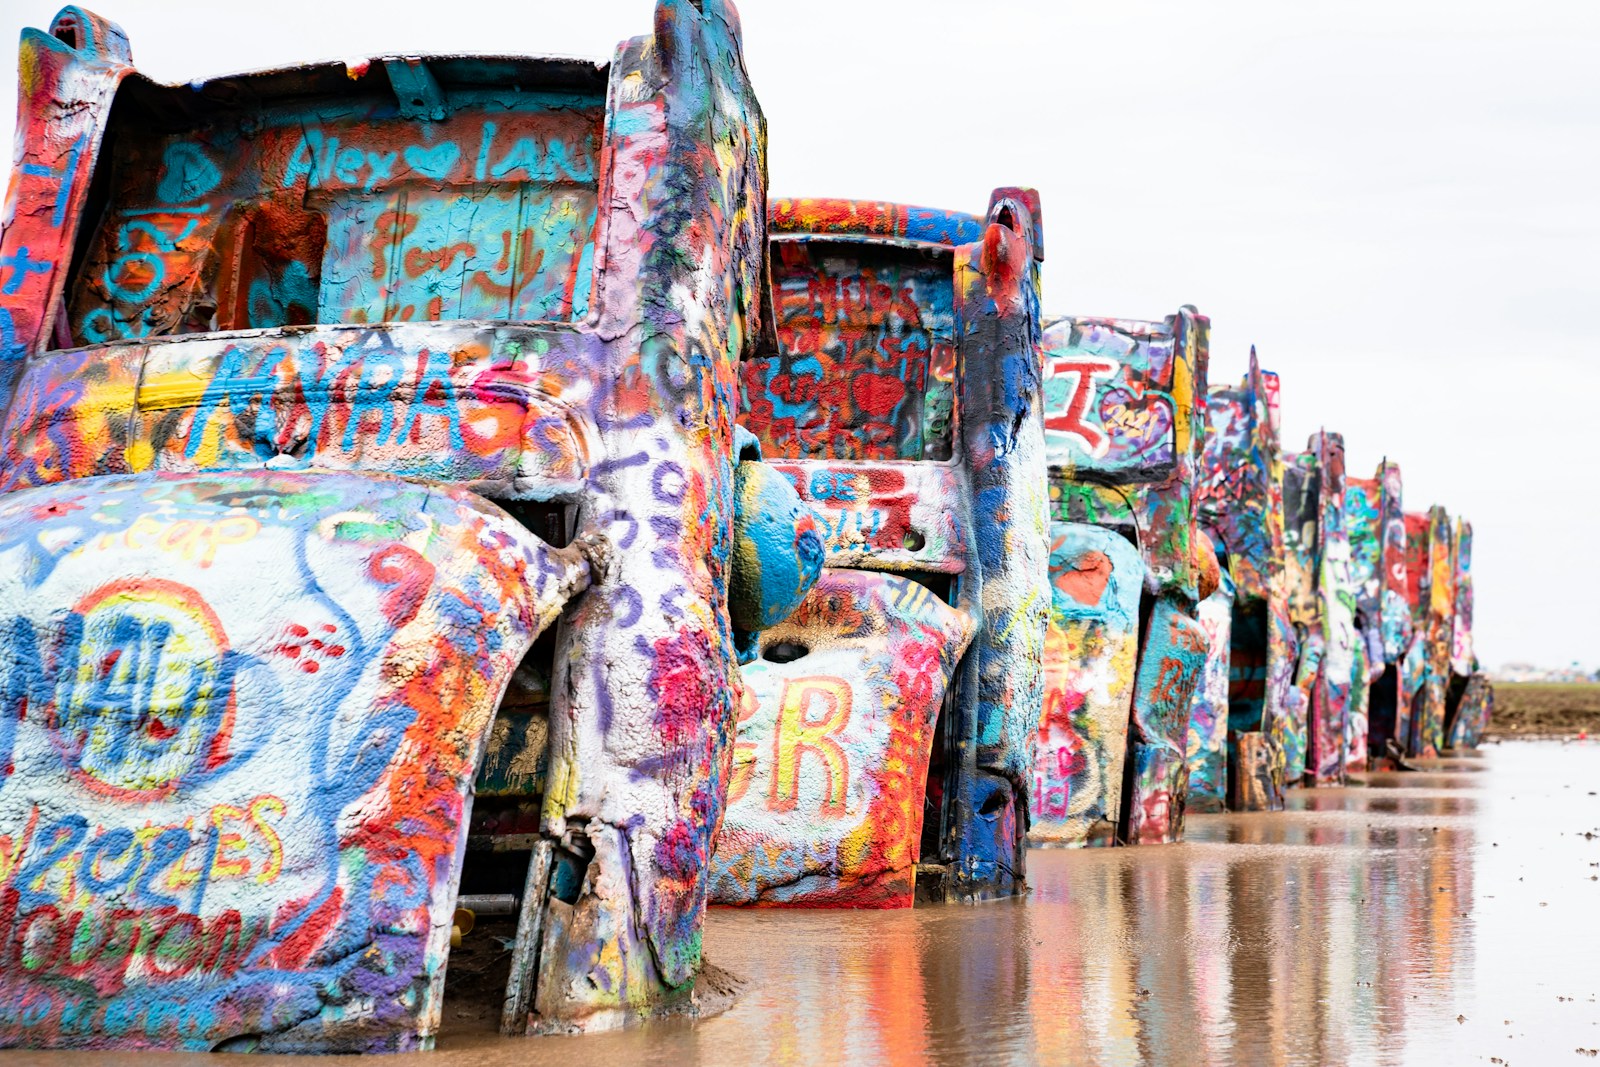
- Annual water withdrawals: 212.1% of renewable supply
- Land area that is abnormally dry: 0.0%
- Value of all homes: $9.8 billion
- Total population: 200,360
22. Highlands Ranch, CO
- Annual water withdrawals: 224.3% of renewable supply
- Land area that is abnormally dry: 100.0%
- Value of all homes: $20.1 billion
- Total population: 101,514
21. Boulder, CO
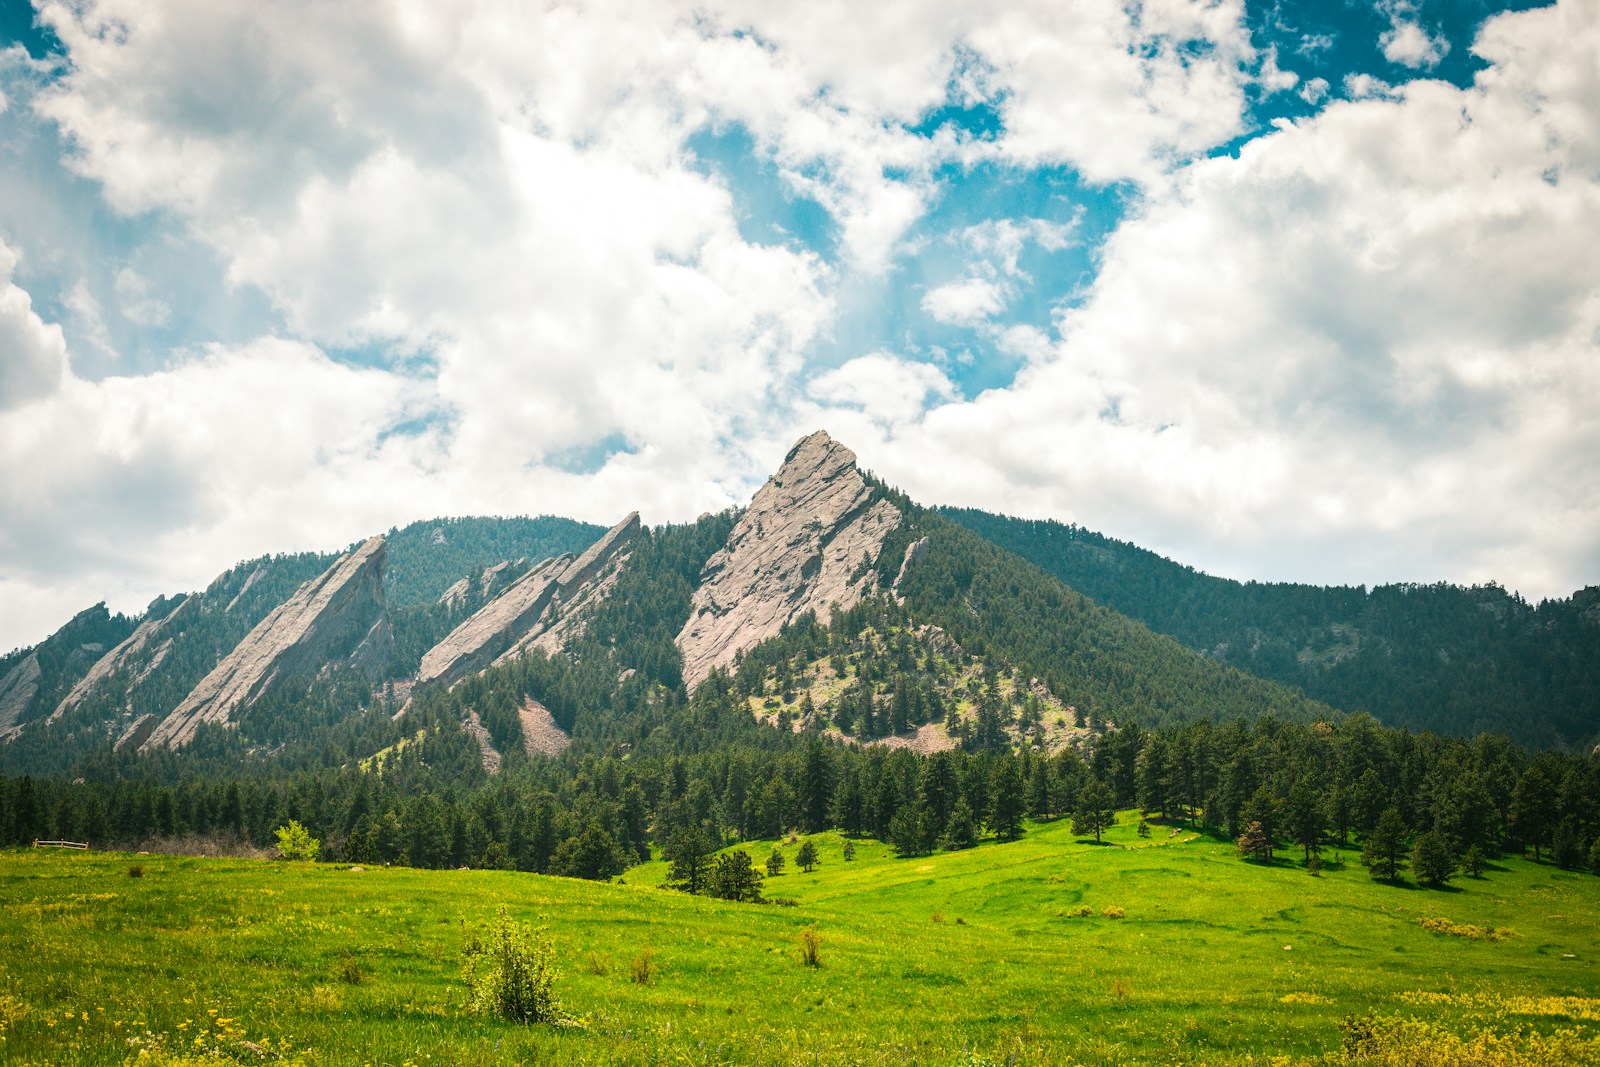
- Annual water withdrawals: 224.3% of renewable supply
- Land area that is abnormally dry: 0.0%
- Value of all homes: $23.4 billion
- Total population: 106,598
20. Greeley, CO
- Annual water withdrawals: 224.3% of renewable supply
- Land area that is abnormally dry: 0.8%
- Value of all homes: $8.3 billion
- Total population: 107,949
19. Thornton, CO
- Annual water withdrawals: 224.3% of renewable supply
- Land area that is abnormally dry: 0.0%
- Value of all homes: $16.6 billion
- Total population: 141,799
18. Lakewood, CO
- Annual water withdrawals: 224.3% of renewable supply
- Land area that is abnormally dry: 99.3%
- Value of all homes: $21.0 billion
- Total population: 156,149
17. Fort Collins, CO
- Annual water withdrawals: 224.3% of renewable supply
- Land area that is abnormally dry: 100.0%
- Value of all homes: $19.6 billion
- Total population: 168,758
16. Aurora, CO
- Annual water withdrawals: 224.3% of renewable supply
- Land area that is abnormally dry: 28.4%
- Value of all homes: $39.8 billion
- Total population: 387,349
15. Denver, CO
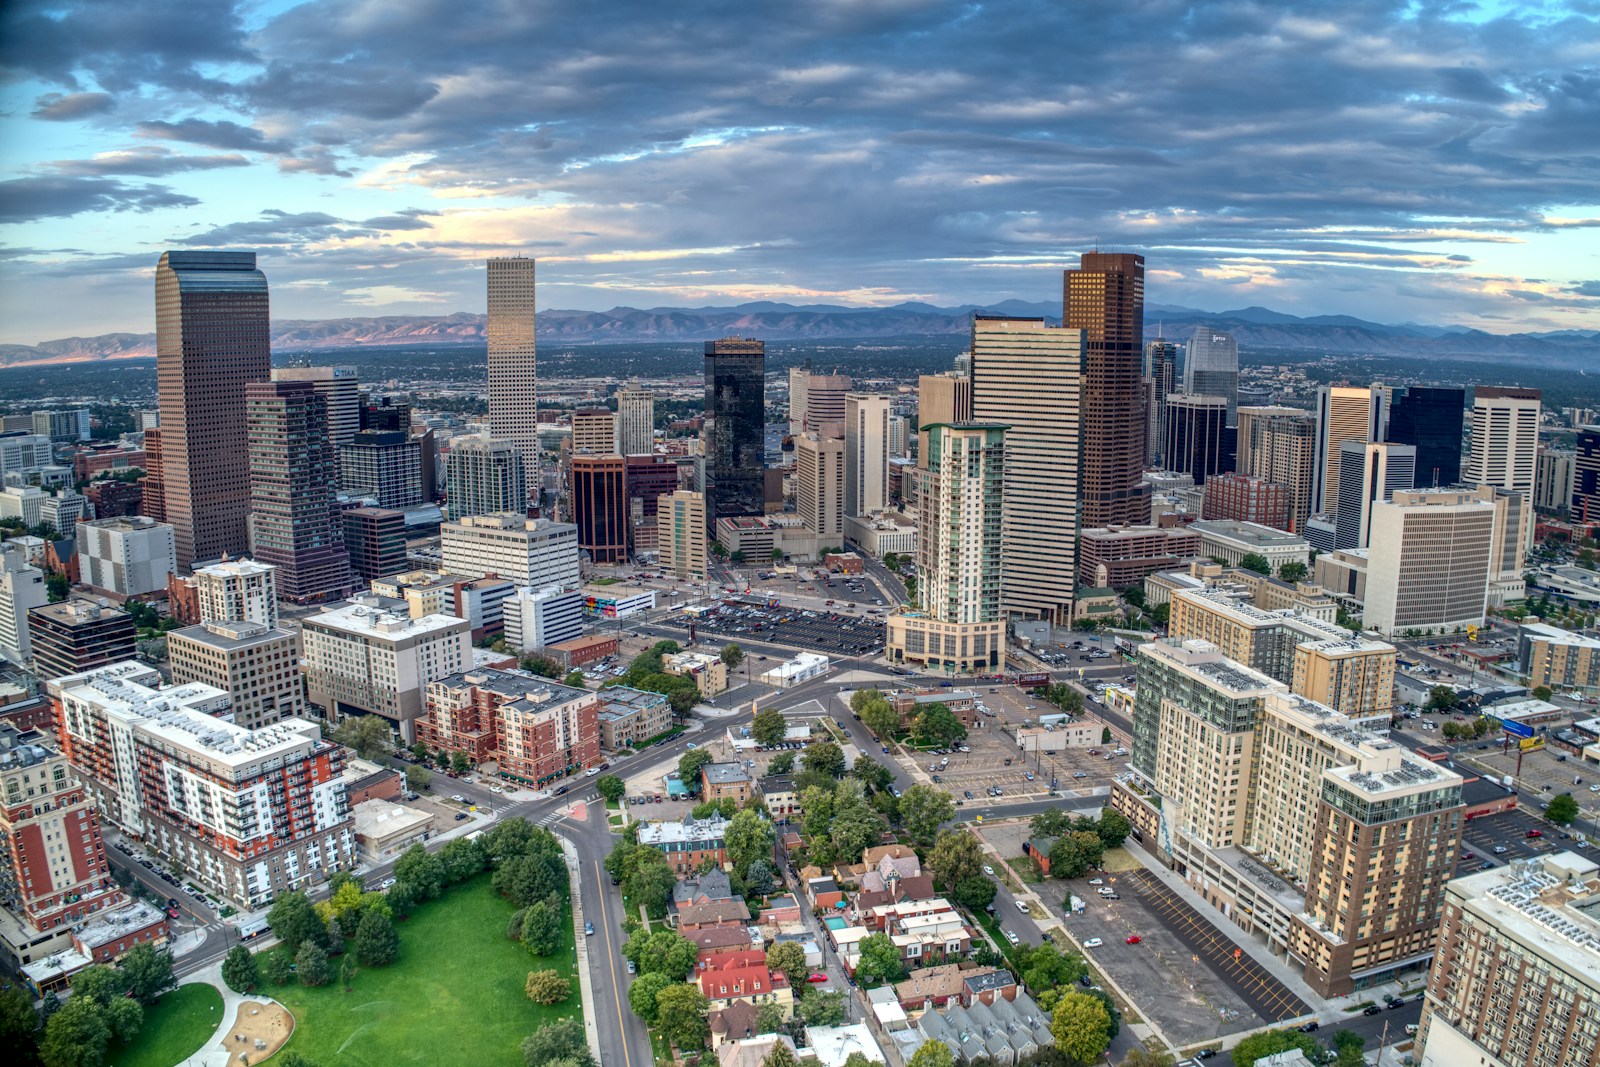
- Annual water withdrawals: 224.3% of renewable supply
- Land area that is abnormally dry: 35.3%
- Value of all homes: $104.5 billion
- Total population: 710,800
14. Clovis, CA
- Annual water withdrawals: 280.5% of renewable supply
- Land area that is abnormally dry: 100.0%
- Value of all homes: $12.2 billion
- Total population: 120,607
13. Brownsville, TX
- Annual water withdrawals: 299.1% of renewable supply
- Land area that is abnormally dry: 0.0%
- Value of all homes: $4.7 billion
- Total population: 186,999
12. San Diego, CA
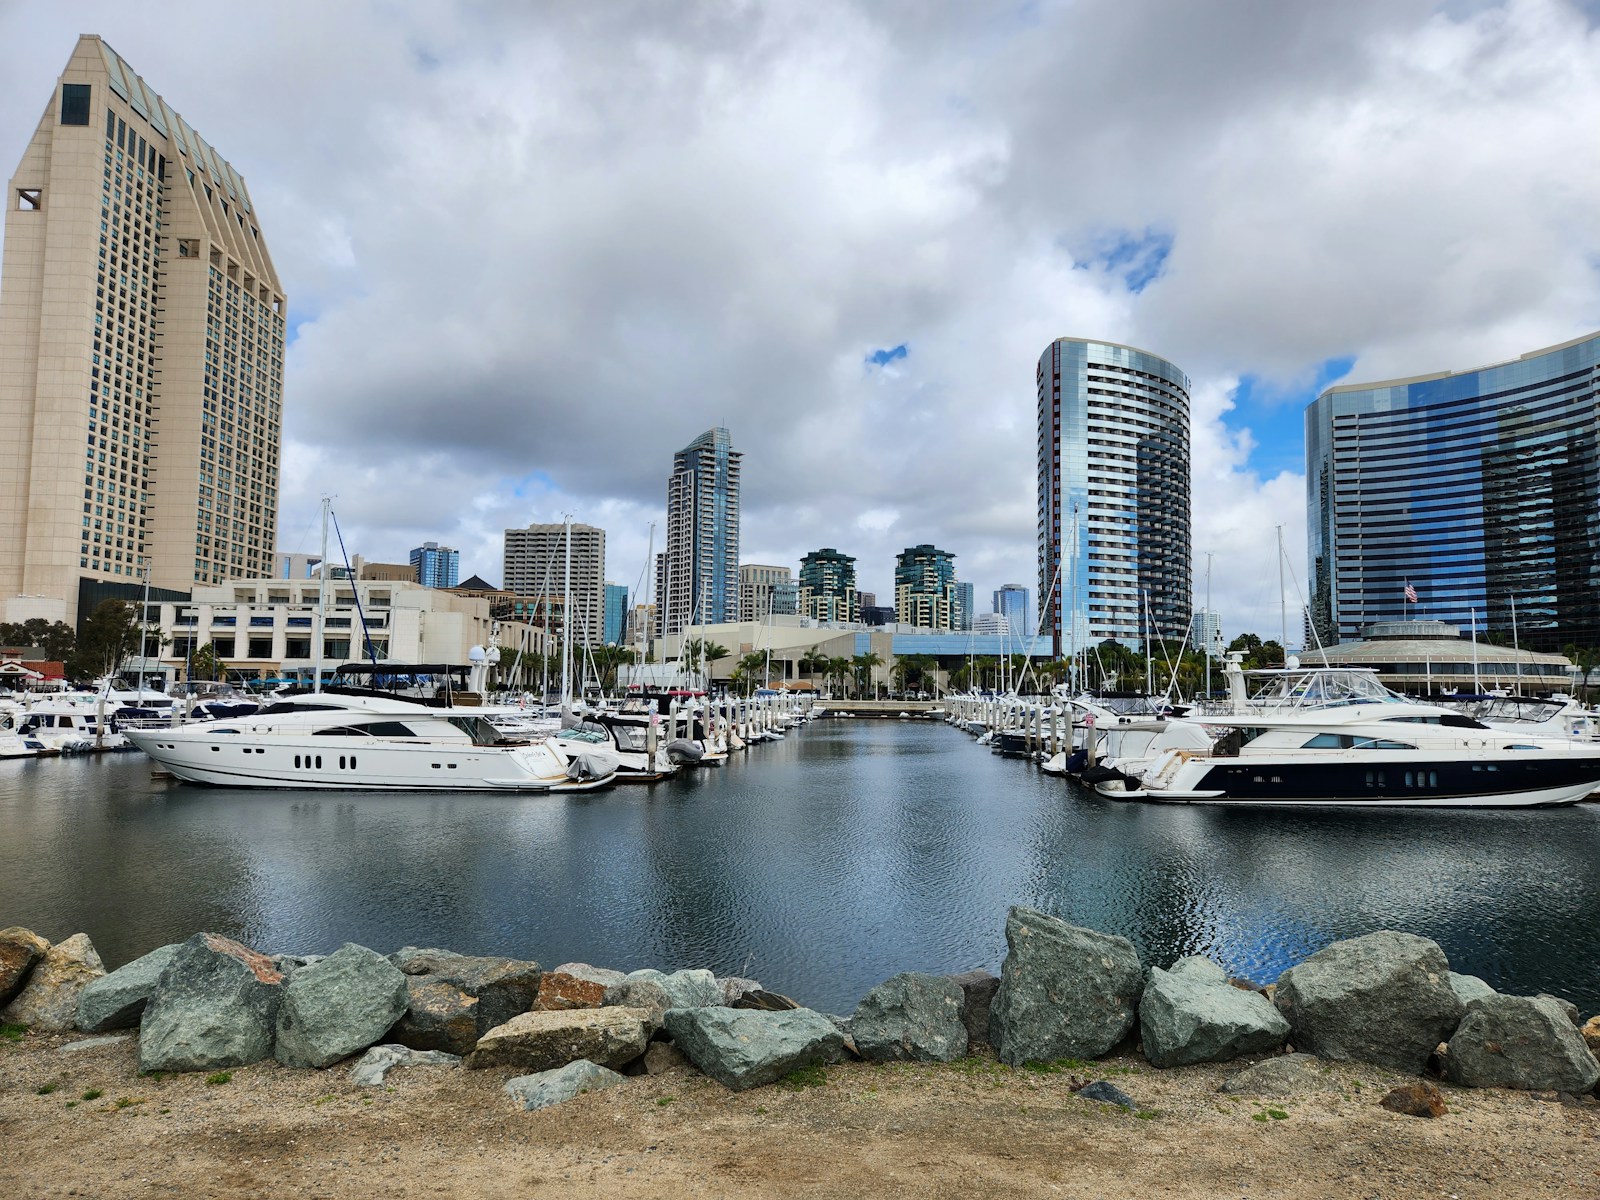
- Annual water withdrawals: 339.5% of renewable supply
- Land area that is abnormally dry: 88.8%
- Value of all homes: $236.0 billion
- Total population: 1.4 million
11. Oxnard, CA
- Annual water withdrawals: 349.8% of renewable supply
- Land area that is abnormally dry: 68.9%
- Value of all homes: $16.8 billion
- Total population: 202,279
10. Bakersfield, CA
- Annual water withdrawals: 364.1% of renewable supply
- Land area that is abnormally dry: 100.0%
- Value of all homes: $26.3 billion
- Total population: 404,321
9. Pomona, CA
- Annual water withdrawals: 440.8% of renewable supply
- Land area that is abnormally dry: 100.0%
- Value of all homes: $11.6 billion
- Total population: 149,831
8. Edinburg, TX

- Annual water withdrawals: 458.0% of renewable supply
- Land area that is abnormally dry: 0.0%
- Value of all homes: $3.2 billion
- Total population: 100,964
7. Visalia, CA
- Annual water withdrawals: 497.9% of renewable supply
- Land area that is abnormally dry: 100.0%
- Value of all homes: $9.3 billion
- Total population: 141,466
6. San Bernardino, CA
- Annual water withdrawals: 530.7% of renewable supply
- Land area that is abnormally dry: 100.0%
- Value of all homes: $11.2 billion
- Total population: 221,041
5. Santa Ana, CA
- Annual water withdrawals: 530.7% of renewable supply
- Land area that is abnormally dry: 100.0%
- Value of all homes: $22.5 billion
- Total population: 311,379
4. Riverside, CA
- Annual water withdrawals: 530.7% of renewable supply
- Land area that is abnormally dry: 100.0%
- Value of all homes: $26.9 billion
- Total population: 316,076
3. Lubbock, TX
- Annual water withdrawals: 671.1% of renewable supply
- Land area that is abnormally dry: 0.0%
- Value of all homes: $12.0 billion
- Total population: 258,190
2. San Tan Valley, AZ
- Annual water withdrawals: 684.3% of renewable supply
- Land area that is abnormally dry: 100.0%
- Value of all homes: $9.4 billion
- Total population: 101,207
1. Chandler, AZ
- Annual water withdrawals: 684.3% of renewable supply
- Land area that is abnormally dry: 100.0%
- Value of all homes: $31.8 billion
- Total population: 275,618
Sponsor
Find a Vetted Financial Advisor
- Finding a fiduciary financial advisor doesn't have to be hard. SmartAsset's free tool matches you with up to 3 financial advisors that serve your area in 5 minutes.
- Each advisor has been vetted by SmartAsset and is held to a fiduciary standard to act in your best interests. Get on the path toward achieving your financial goals!