As Heat Dome Broils the Pacific Northwest, These 25 Cities Will Face the Most Extreme Heat
 https://climatecrisis247.com/wp-content/uploads/2025/06/Forecast-maximum-temperature-June-11-to-13-150x150.png
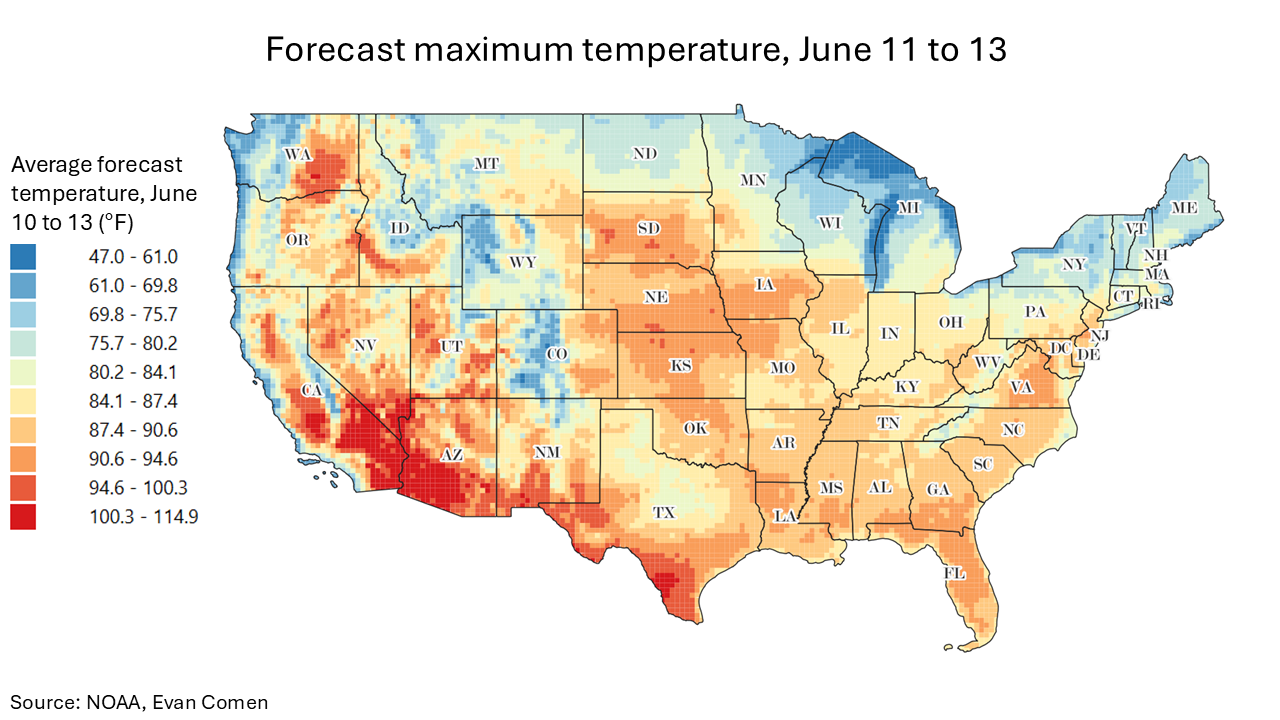
This week, a powerful heat dome is parked over the Pacific Northwest, pushing temperatures to abnormal and – in some cases – record highs in dozens of cities. Temperatures are forecast to rise to more than 25 degrees above seasonal norms, triggering health warnings from local officials and putting vulnerable populations at extreme risk.
Not in Kansas anymore? Tornado Alley Is Expanding South Into These Cities
Hot property? From Maui to Malibu, These Affluent Enclaves Are Becoming Wildfire Hotspots
The National Weather Service has issued heat warnings for 18 counties, representing more than six million Americans. There are 13 counties where temperatures are expected to reach over 100°F, setting temperature records for dozens of cities from Nevada to Washington. A closer look at the data reveals the cities where residents will experience the most extreme heat this week.
To determine the cities where it will be abnormally warm this week, Climate Crisis 247 reviewed 72-hour temperature forecasts and historical station-level daily temperature readings from the NOAA. Cities were ranked based on the difference between the forecast maximum temperature for June 11-13, 2025, and the average observed minimum temperature for June 11-13 from 2006 to 2020. Gridded forecast data are from the National Digital Forecast Database, while historical temperature normals are from the Global Historical Climatology Network daily program of the National Centers for Environmental Information. Weather stations were matched to places using nearest neighbor analysis and were limited to cities within 50 miles of the city centroid. Only cities with at least 25,000 residents were considered.
25. Redlands, CA
- Forecast maximum, June 11-13: 93.1°F (+16.7°F above climate normal)
- Normal June 11-13 maximum, 2006-2020: 76.4°F
- Total population: 73,234
24. Moscow, ID

- Forecast maximum, June 11-13: 87.7°F (+16.8°F above climate normal)
- Normal June 11-13 maximum, 2006-2020: 70.9°F
- Total population: 25,616
23. St. George, UT

- Forecast maximum, June 11-13: 103.1°F (+17.1°F above climate normal)
- Normal June 11-13 maximum, 2006-2020: 86.0°F
- Total population: 96,174
22. Highland, CA

- Forecast maximum, June 11-13: 93.7°F (+17.3°F above climate normal)
- Normal June 11-13 maximum, 2006-2020: 76.4°F
- Total population: 56,789
21. Pullman, WA

- Forecast maximum, June 11-13: 88.3°F (+17.4°F above climate normal)
- Normal June 11-13 maximum, 2006-2020: 70.9°F
- Total population: 31,972
20. Bend, OR

- Forecast maximum, June 11-13: 90.4°F (+17.4°F above climate normal)
- Normal June 11-13 maximum, 2006-2020: 73.0°F
- Total population: 99,442
19. Coeur d'Alene, ID

- Forecast maximum, June 11-13: 90.5°F (+17.9°F above climate normal)
- Normal June 11-13 maximum, 2006-2020: 72.6°F
- Total population: 54,599
18. Spokane Valley, WA

- Forecast maximum, June 11-13: 93.0°F (+18.0°F above climate normal)
- Normal June 11-13 maximum, 2006-2020: 75.0°F
- Total population: 103,761
17. Walla Walla, WA

- Forecast maximum, June 11-13: 97.7°F (+18.3°F above climate normal)
- Normal June 11-13 maximum, 2006-2020: 79.4°F
- Total population: 33,842
16. Yakima, WA
- Forecast maximum, June 11-13: 98.2°F (+18.3°F above climate normal)
- Normal June 11-13 maximum, 2006-2020: 79.9°F
- Total population: 96,764
15. Pasco, WA

- Forecast maximum, June 11-13: 99.7°F (+18.4°F above climate normal)
- Normal June 11-13 maximum, 2006-2020: 81.3°F
- Total population: 77,274
14. Spokane, WA

- Forecast maximum, June 11-13: 93.4°F (+18.4°F above climate normal)
- Normal June 11-13 maximum, 2006-2020: 75.0°F
- Total population: 227,922
13. Kennewick, WA

- Forecast maximum, June 11-13: 99.8°F (+18.5°F above climate normal)
- Normal June 11-13 maximum, 2006-2020: 81.3°F
- Total population: 83,823
12. Missoula, MT
- Forecast maximum, June 11-13: 92.1°F (+18.7°F above climate normal)
- Normal June 11-13 maximum, 2006-2020: 73.4°F
- Total population: 74,627
11. Carson City, NV

- Forecast maximum, June 11-13: 85.5°F (+18.8°F above climate normal)
- Normal June 11-13 maximum, 2006-2020: 66.7°F
- Total population: 58,249
10. Richland, WA

- Forecast maximum, June 11-13: 100.6°F (+19.3°F above climate normal)
- Normal June 11-13 maximum, 2006-2020: 81.3°F
- Total population: 60,867
9. Moses Lake, WA

- Forecast maximum, June 11-13: 98.8°F (+19.5°F above climate normal)
- Normal June 11-13 maximum, 2006-2020: 79.3°F
- Total population: 25,155
8. Medford, OR

- Forecast maximum, June 11-13: 97.4°F (+19.5°F above climate normal)
- Normal June 11-13 maximum, 2006-2020: 77.9°F
- Total population: 85,539
7. Wenatchee, WA

- Forecast maximum, June 11-13: 98.0°F (+19.7°F above climate normal)
- Normal June 11-13 maximum, 2006-2020: 78.3°F
- Total population: 35,365
6. Kalispell, MT

- Forecast maximum, June 11-13: 89.9°F (+19.8°F above climate normal)
- Normal June 11-13 maximum, 2006-2020: 70.1°F
- Total population: 25,473
5. Alamogordo, NM
- Forecast maximum, June 11-13: 96.7°F (+20.1°F above climate normal)
- Normal June 11-13 maximum, 2006-2020: 76.6°F
- Total population: 30,996
4. Lewiston, ID
- Forecast maximum, June 11-13: 98.6°F (+20.4°F above climate normal)
- Normal June 11-13 maximum, 2006-2020: 78.2°F
- Total population: 34,270
3. Redmond, OR

- Forecast maximum, June 11-13: 92.8°F (+21.5°F above climate normal)
- Normal June 11-13 maximum, 2006-2020: 71.3°F
- Total population: 34,191
2. Grants Pass, OR
- Forecast maximum, June 11-13: 95.8°F (+28.4°F above climate normal)
- Normal June 11-13 maximum, 2006-2020: 67.4°F
- Total population: 39,131
1. Pahrump, NV

- Forecast maximum, June 11-13: 103.6°F (+28.7°F above climate normal)
- Normal June 11-13 maximum, 2006-2020: 74.9°F
- Total population: 44,711
More from ClimateCrisis 247
- Canadian Wildfires Causing These U.S. Cities to Have Terrible Air Quality
- The Billion-Dollar Disaster Data Trump Doesn’t Want You to See
- Miami, Galveston and The Cities With the Most Category 3+ Hurricanes
- From Minnesota to Texas, 25 Cities Forecasted To Get Hit Hard By Storms, Flash Floods This Week