Dry Vegetation, Strong Winds Make Fireworks Particularly Dangerous in These Wildfire Hotspots This 4th of July
 https://climate-crisis-247-bucket.nyc3.cdn.digitaloceanspaces.com/wp-content/uploads/2025/07/07213727/Wildland-Fire-Potential-Index-for-July-4th-2025-150x150.png
On Tuesday, a fire in a fireworks warehouse in Esparto, California set off a dramatic explosion, triggering a massive pyrotechnics display and injuring at least two people. The sheriff’s office issued a one-mile evacuation order around the facility, while seven people remain unaccounted for a day after the explosion.
Hot property? From Maui to Malibu, These Affluent Enclaves Are Becoming Wildfire Hotspots
Hold on to your hats! The U.S. Counties Getting Windier Every Year
According to the National Fire Protection Association, fireworks started more than 30,000 fires in 2024, and caused $142 million in property damage. Firework activity peaks around the Fourth of July, with U.S. hospital emergency rooms treating 9,700 people for fireworks injuries from June 16, 2023 to July 16, 2023.
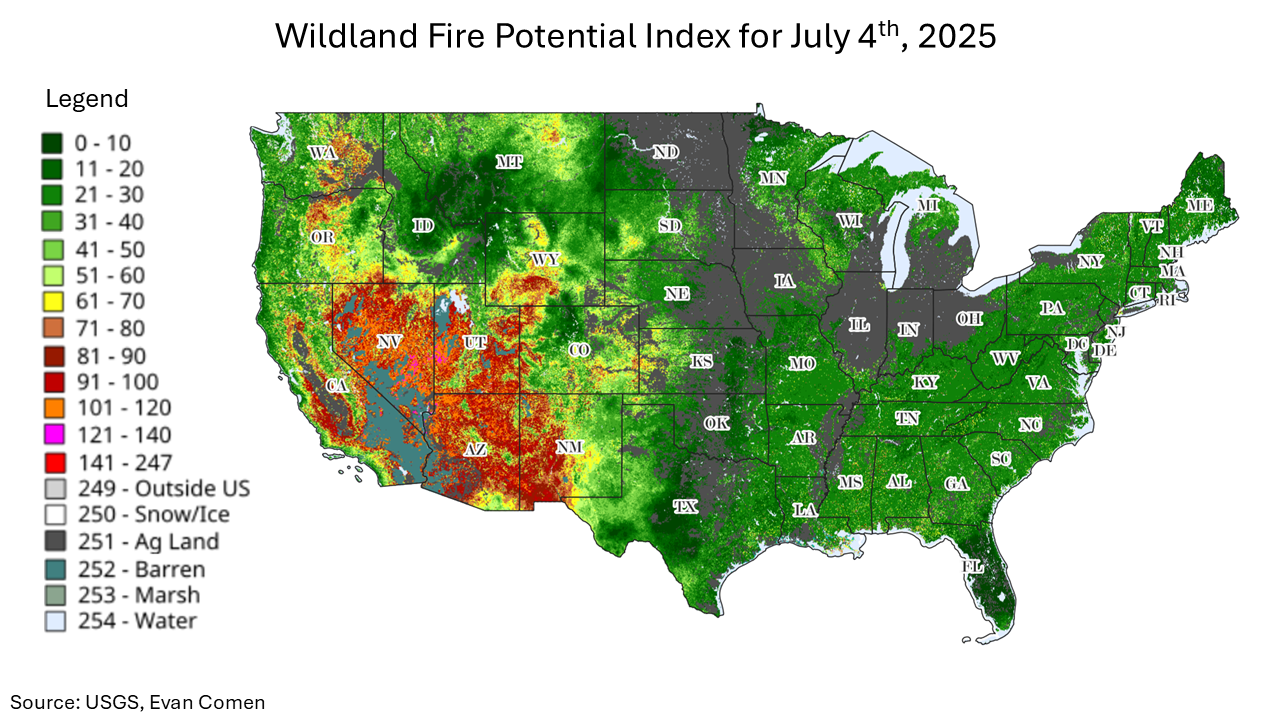
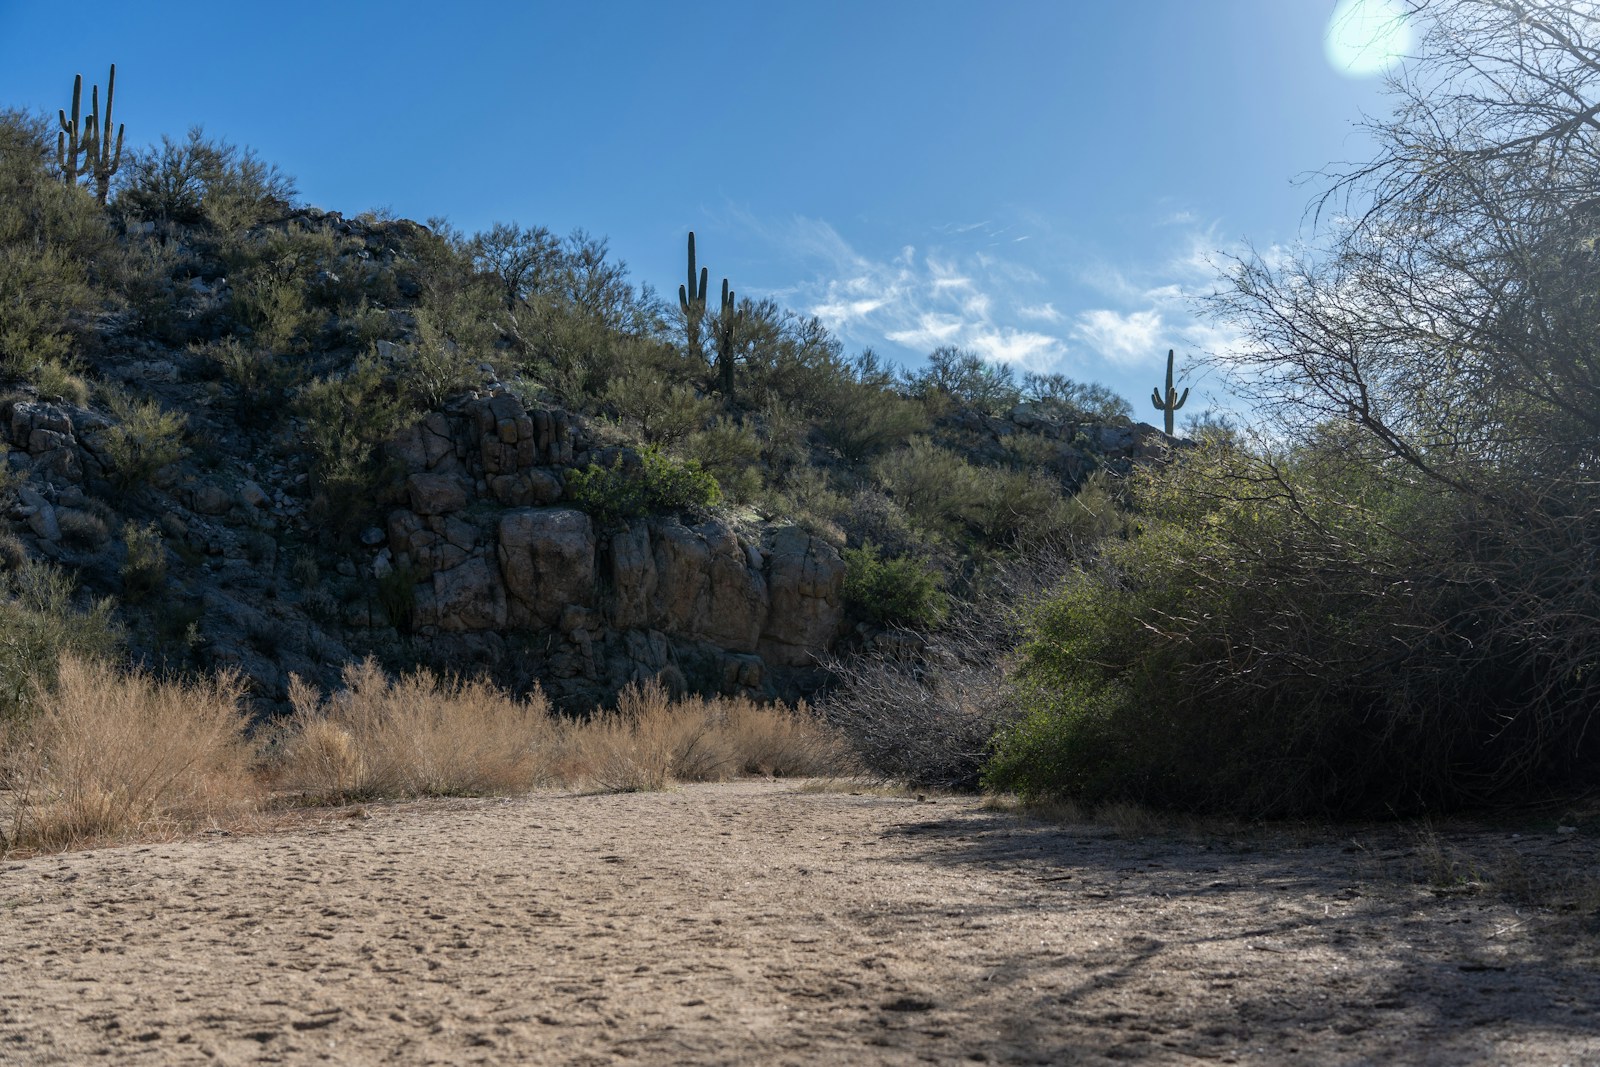
To help assess fire risk, the United States Geological Survey publishes a daily Wildland Fire Potential Index. This year, persistent drought and dry weather have created ideal conditions for wildfire, raising the risk of firework-related outbreaks on July 4th. Several major cities are forecast to have WFPI values above 80 on the Fourth of July, an indication of severe fire risk. A closer look at the data reveals which cities face the greatest fire risk this Independence Day.
To determine the cities facing the highest wildfire risk this Fourth of July, Climate Crisis 247 reviewed data from the U.S. Geological Survey. Cities were ranked based on average Wildland Fire Potential Index for July 4th, 2025. Supplemental data on maximum temperature are based on forecasts from the NOAA. Only cities with at least 25,000 residents were considered. Data on population and home value are from the U.S. Census Bureau.
25. Flagstaff, AZ
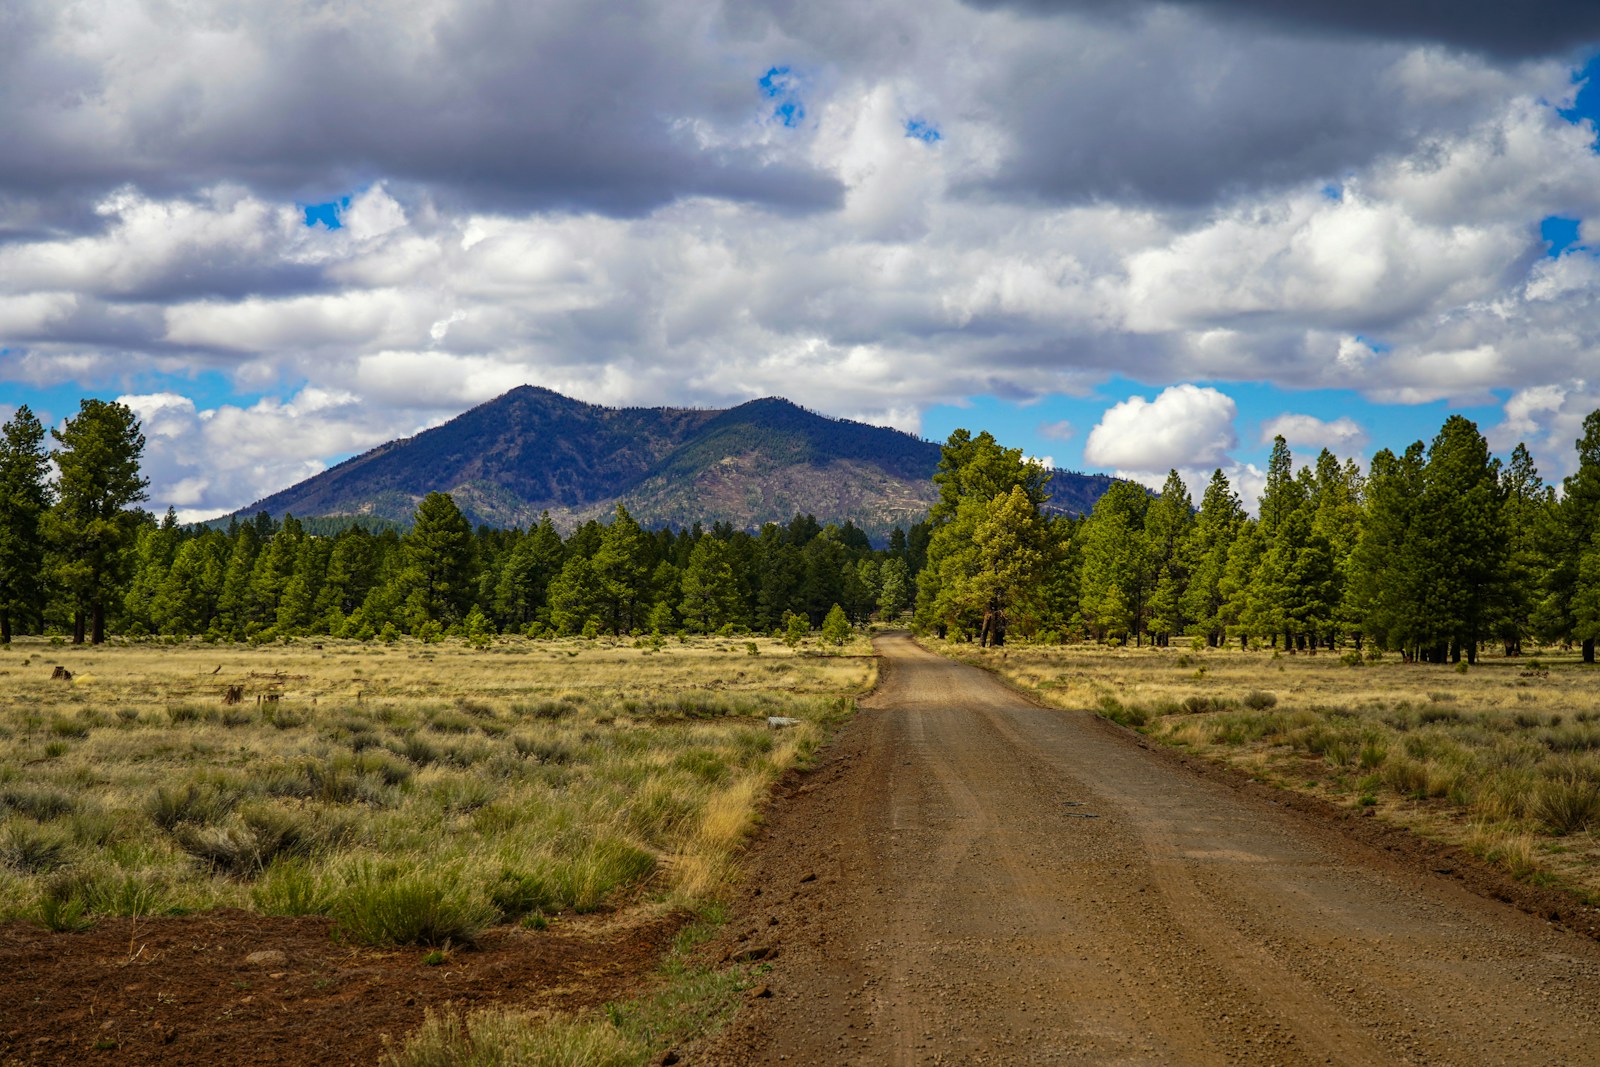
- Wildland Fire Potential Index, July 4th, 2025: 62.5
- Maximum temperature, July 4th, 2025: 77.7°F
- Total home value: $6.2 billion
- Total population: 76,177
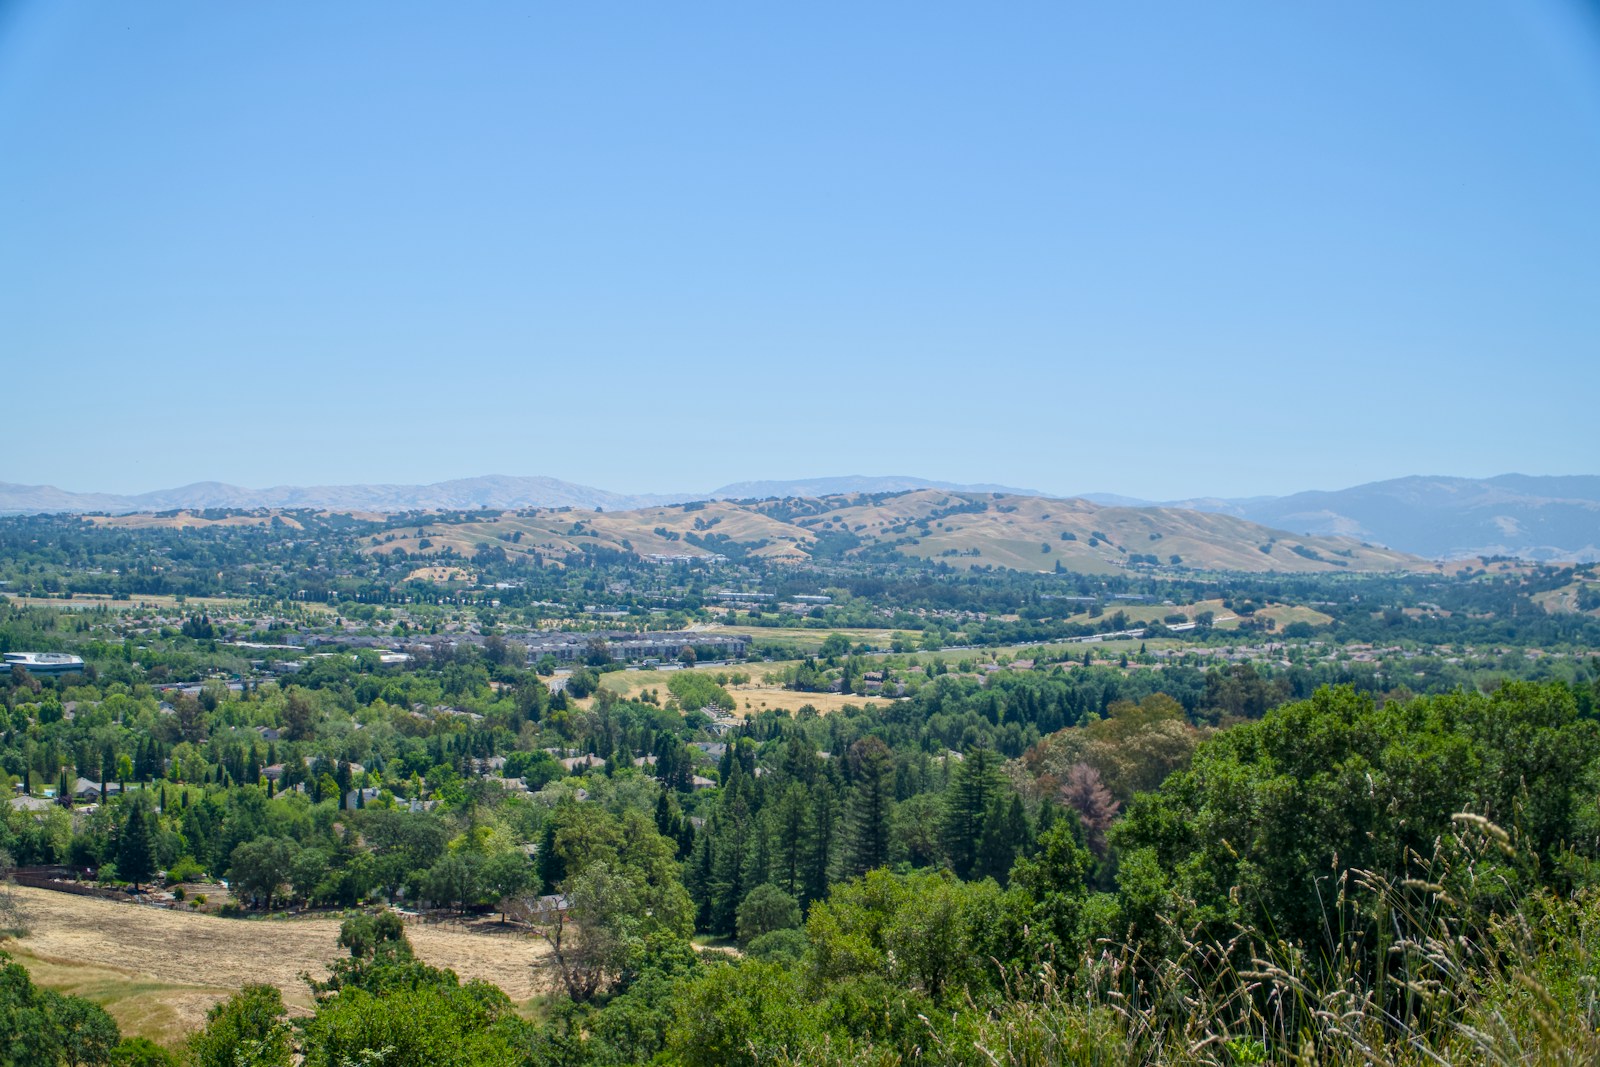
24. Foothill Farms, CA

- Wildland Fire Potential Index, July 4th, 2025: 62.7
- Maximum temperature, July 4th, 2025: 92.9°F
- Total home value: $2.1 billion
- Total population: 37,635
23. Alamogordo, NM
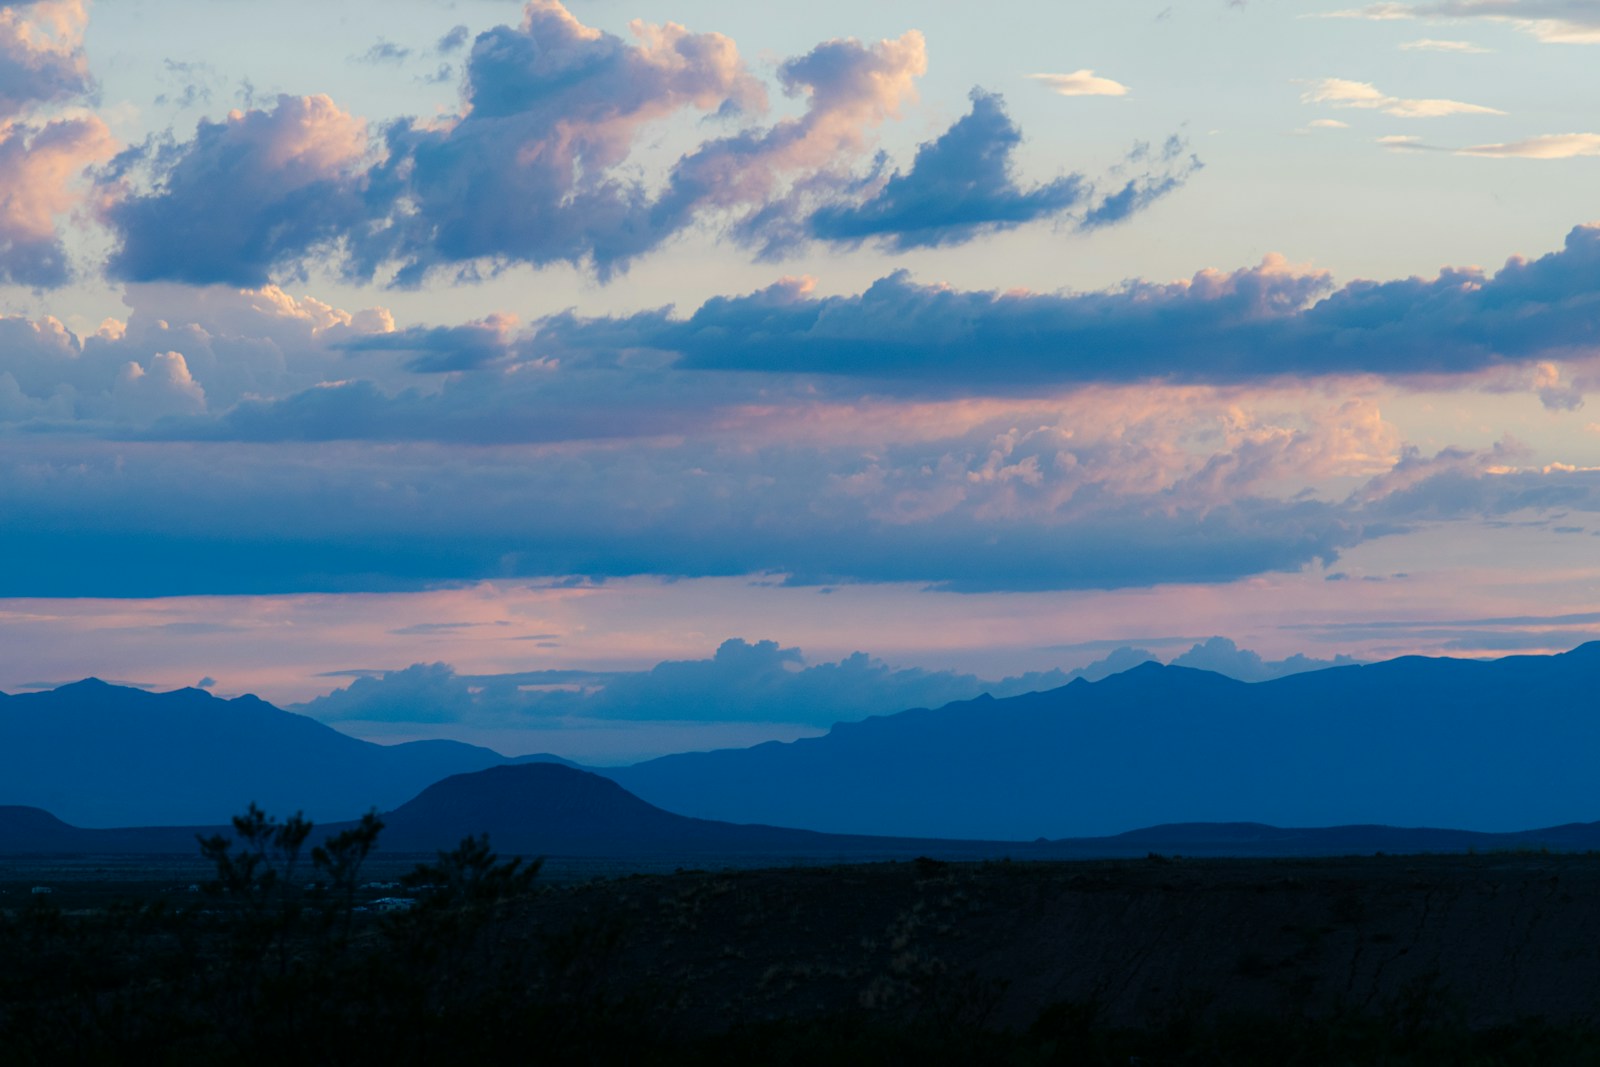
- Wildland Fire Potential Index, July 4th, 2025: 63.6
- Maximum temperature, July 4th, 2025: 84.2°F
- Total home value: $1.4 billion
- Total population: 30,996
22. French Valley, CA
- Wildland Fire Potential Index, July 4th, 2025: 64.5
- Maximum temperature, July 4th, 2025: 85.6°F
- Total home value: $6.2 billion
- Total population: 41,239
21. Antelope, CA

- Wildland Fire Potential Index, July 4th, 2025: 65.2
- Maximum temperature, July 4th, 2025: 92.7°F
- Total home value: $4.4 billion
- Total population: 47,629
20. Atwater, CA

- Wildland Fire Potential Index, July 4th, 2025: 65.4
- Maximum temperature, July 4th, 2025: 96.0°F
- Total home value: $1.7 billion
- Total population: 31,841
19. Oro Valley, AZ
- Wildland Fire Potential Index, July 4th, 2025: 65.5
- Maximum temperature, July 4th, 2025: 97.0°F
- Total home value: $7.6 billion
- Total population: 47,053
18. Eastvale, CA

- Wildland Fire Potential Index, July 4th, 2025: 65.7
- Maximum temperature, July 4th, 2025: 85.4°F
- Total home value: $9.3 billion
- Total population: 69,594
17. Union City, NJ

- Wildland Fire Potential Index, July 4th, 2025: 66.0
- Maximum temperature, July 4th, 2025: 89.3°F
- Total home value: $2.2 billion
- Total population: 67,258
16. Florin, CA

- Wildland Fire Potential Index, July 4th, 2025: 71.0
- Maximum temperature, July 4th, 2025: 90.4°F
- Total home value: $3.0 billion
- Total population: 49,992
15. Beaumont, CA
- Wildland Fire Potential Index, July 4th, 2025: 71.9
- Maximum temperature, July 4th, 2025: 89.5°F
- Total home value: $5.5 billion
- Total population: 53,544
14. Socorro, TX

- Wildland Fire Potential Index, July 4th, 2025: 73.0
- Maximum temperature, July 4th, 2025: 86.6°F
- Total home value: $1.1 billion
- Total population: 35,429
13. San Jacinto, CA
- Wildland Fire Potential Index, July 4th, 2025: 74.8
- Maximum temperature, July 4th, 2025: 92.0°F
- Total home value: $3.8 billion
- Total population: 54,077
12. Kearns, UT

- Wildland Fire Potential Index, July 4th, 2025: 76.2
- Maximum temperature, July 4th, 2025: 85.9°F
- Total home value: $2.8 billion
- Total population: 36,862
11. Paso Robles, CA

- Wildland Fire Potential Index, July 4th, 2025: 77.5
- Maximum temperature, July 4th, 2025: 90.9°F
- Total home value: $4.6 billion
- Total population: 31,595
10. Prescott, AZ

- Wildland Fire Potential Index, July 4th, 2025: 77.8
- Maximum temperature, July 4th, 2025: 86.0°F
- Total home value: $7.6 billion
- Total population: 46,054
9. Oildale, CA

- Wildland Fire Potential Index, July 4th, 2025: 78.2
- Maximum temperature, July 4th, 2025: 101.0°F
- Total home value: $1.1 billion
- Total population: 34,796
8. East Niles, CA

- Wildland Fire Potential Index, July 4th, 2025: 79.1
- Maximum temperature, July 4th, 2025: 101.5°F
- Total home value: $1.1 billion
- Total population: 29,981
7. Prescott Valley, AZ

- Wildland Fire Potential Index, July 4th, 2025: 81.5
- Maximum temperature, July 4th, 2025: 87.7°F
- Total home value: $4.8 billion
- Total population: 47,015
6. Sun City, AZ
- Wildland Fire Potential Index, July 4th, 2025: 82.3
- Maximum temperature, July 4th, 2025: 103.9°F
- Total home value: $5.5 billion
- Total population: 37,748
5. Banning, CA

- Wildland Fire Potential Index, July 4th, 2025: 82.4
- Maximum temperature, July 4th, 2025: 89.0°F
- Total home value: $2.3 billion
- Total population: 29,929
4. Sparks, NV

- Wildland Fire Potential Index, July 4th, 2025: 84.4
- Maximum temperature, July 4th, 2025: 88.7°F
- Total home value: $11.2 billion
- Total population: 108,025
3. Kingman, AZ
- Wildland Fire Potential Index, July 4th, 2025: 105.3
- Maximum temperature, July 4th, 2025: 91.6°F
- Total home value: $2.5 billion
- Total population: 33,052
2. Whitney, NV

- Wildland Fire Potential Index, July 4th, 2025: 111.8
- Maximum temperature, July 4th, 2025: 103.0°F
- Total home value: $2.7 billion
- Total population: 44,720
1. Winchester, NV

- Wildland Fire Potential Index, July 4th, 2025: 111.8
- Maximum temperature, July 4th, 2025: 101.7°F
- Total home value: $1.5 billion
- Total population: 37,531
Sponsor
Find a Vetted Financial Advisor
- Finding a fiduciary financial advisor doesn't have to be hard. SmartAsset's free tool matches you with up to 3 financial advisors that serve your area in 5 minutes.
- Each advisor has been vetted by SmartAsset and is held to a fiduciary standard to act in your best interests. Get on the path toward achieving your financial goals!