From the Great Plains to the Southwest: Where Dust Storm Activity Is on the Rise
 https://climate-crisis-247-bucket.nyc3.cdn.digitaloceanspaces.com/wp-content/uploads/2025/05/07221917/Increase-of-National-Weather-Service-Dust-Storm-Warnings-2006-2024-150x150.png
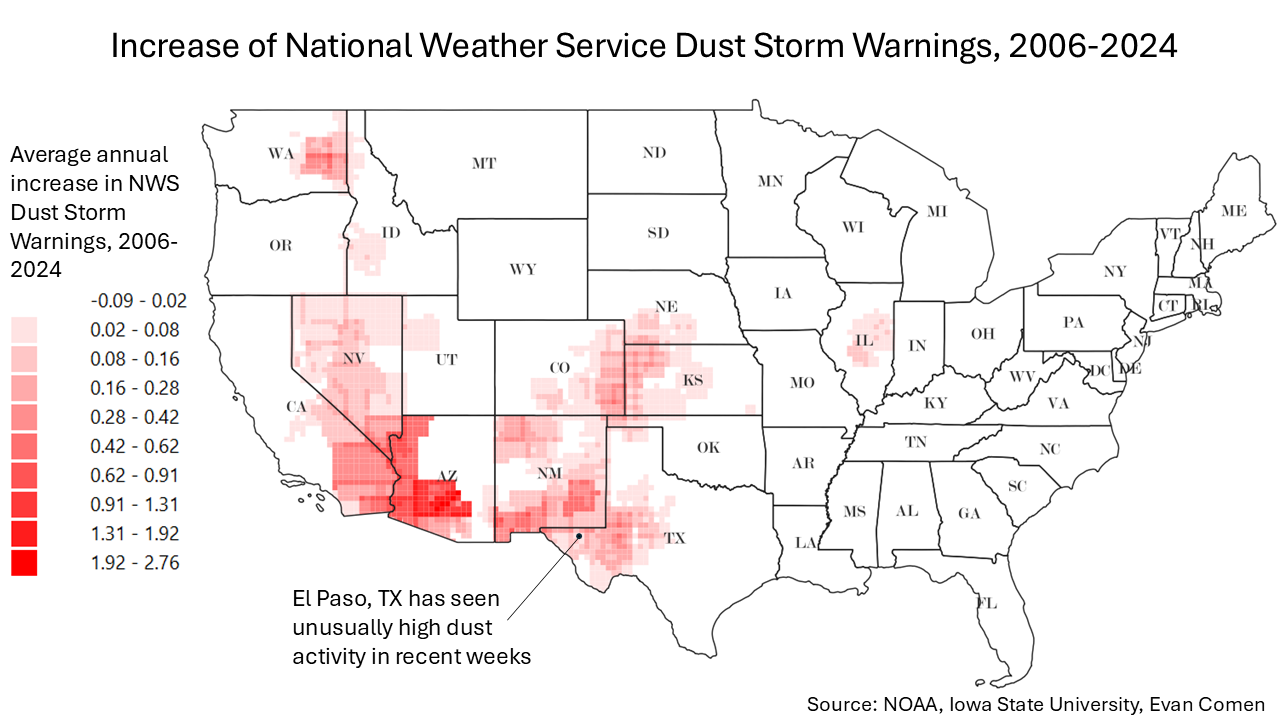
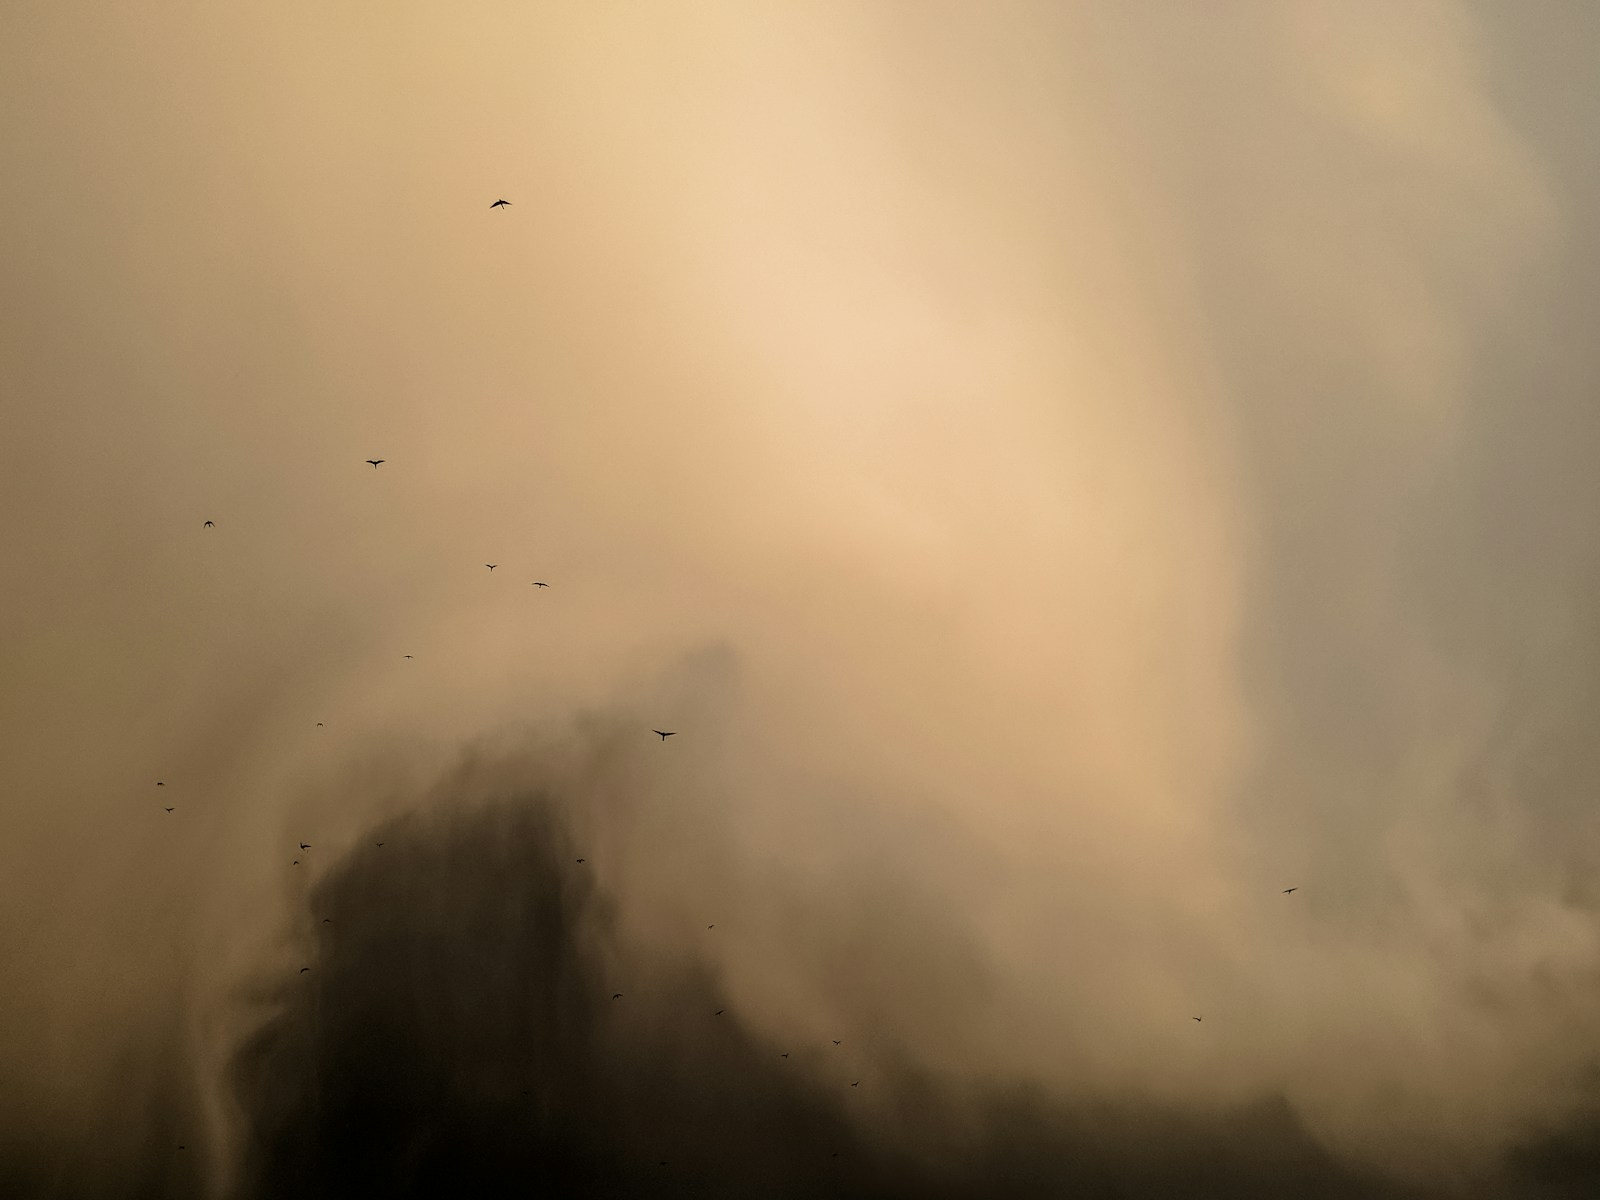
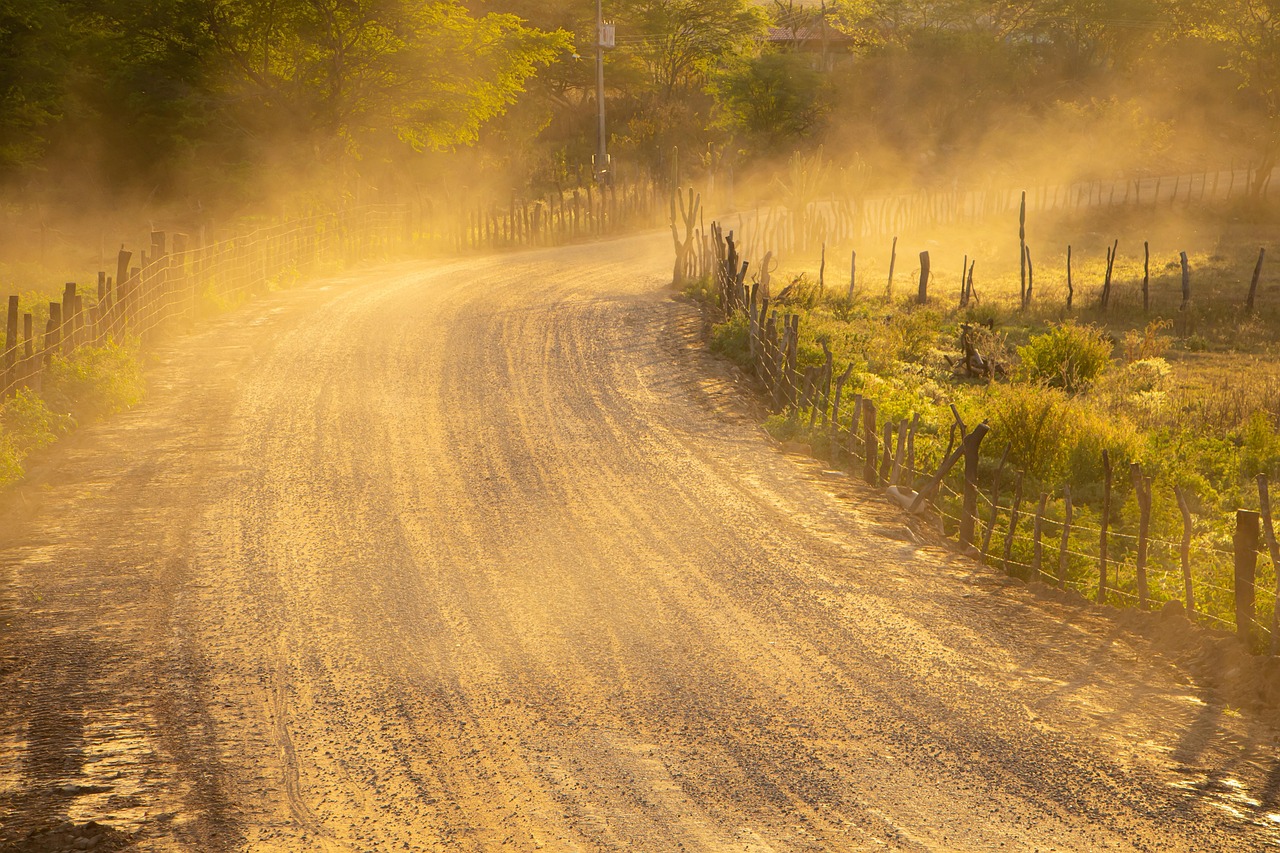
By most measures, El Paso has experienced its worst dusty season this year since the Dust Bowl days of the 1930s. The border town has experienced nearly a full day of brownout conditions, with blowing dust posing significant threats to property, transportation, and public health.
Not in Kansas anymore? Tornado Alley Is Expanding South Into These Cities
Dying for air? Climate Activism Is Turning Deadly In These Cities
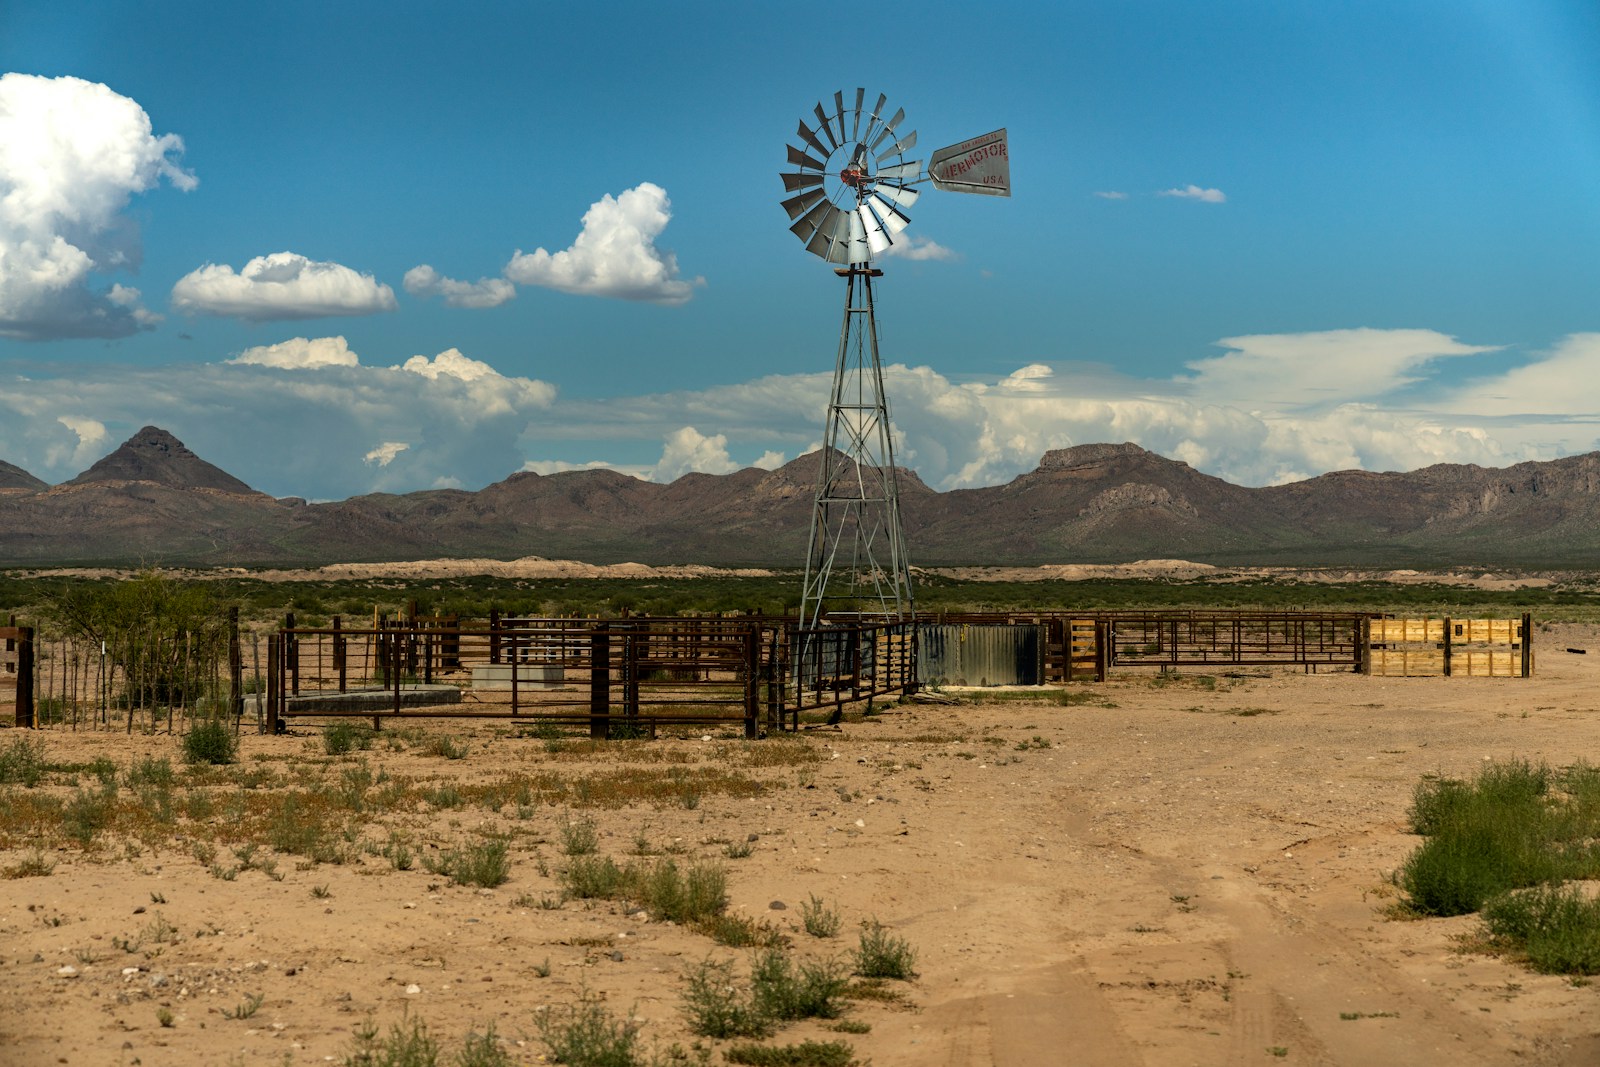
The recent El Paso storms are not happening in isolation. Across the country, dust storm activity is on the rise, growing in tandem with rising temperatures, prolonged drought, and increasing desertification. While the most destructive dust storms in U.S. history took place in the Great Plains states, today the greatest dust storm activity occurs in the Southwest. In some counties, the frequency of dust storms is rising by more than two storms per year. A closer look at the data reveals the counties where dust storms activity is on the rise.
To determine the counties where dust storm activity is on the rise, Climate Crisis 247 reviewed data on historical Dust Storm Warnings issued by the National Weather Service. Counties were ranked based on the average annual increase in dust storm warnings issued by the NWS from 2006 to 2024. Historical NWS dust storm warning polygons were pulled from the Iowa State University Iowa Environmental Mesonet program and were aggregated to the county level in QGIS. Population data is from the U.S. Census Bureau.
20. Nye County, NV
- Average annual increase in NWS dust storm warnings, 2006-2024: +0.9 per year
- Worst year for dust storm warnings: 2022 (36 warnings)
- Total population: 53,207
- County seat: Tonopah
19. Lincoln County, NV
- Average annual increase in NWS dust storm warnings, 2006-2024: +0.9 per year
- Worst year for dust storm warnings: 2022 (38 warnings)
- Total population: 4,452
- County seat: Pioche
18. Sierra County, NM

- Average annual increase in NWS dust storm warnings, 2006-2024: +0.9 per year
- Worst year for dust storm warnings: 2023 (25 warnings)
- Total population: 11,511
- County seat: Truth or Consequences
17. Inyo County, CA
- Average annual increase in NWS dust storm warnings, 2006-2024: +1.0 per year
- Worst year for dust storm warnings: 2022 (34 warnings)
- Total population: 18,803
- County seat: Independence
16. Hidalgo County, NM
- Average annual increase in NWS dust storm warnings, 2006-2024: +1.0 per year
- Worst year for dust storm warnings: 2024 (25 warnings)
- Total population: 4,097
- County seat: Lordsburg
15. Chaves County, NM

- Average annual increase in NWS dust storm warnings, 2006-2024: +1.1 per year
- Worst year for dust storm warnings: 2024 (42 warnings)
- Total population: 64,446
- County seat: Roswell
14. Otero County, NM
- Average annual increase in NWS dust storm warnings, 2006-2024: +1.1 per year
- Worst year for dust storm warnings: 2024 (38 warnings)
- Total population: 68,235
- County seat: Alamogordo
13. Riverside County, CA

- Average annual increase in NWS dust storm warnings, 2006-2024: +1.3 per year
- Worst year for dust storm warnings: 2022 (75 warnings)
- Total population: 2,449,909
- County seat: Riverside
12. Clark County, NV
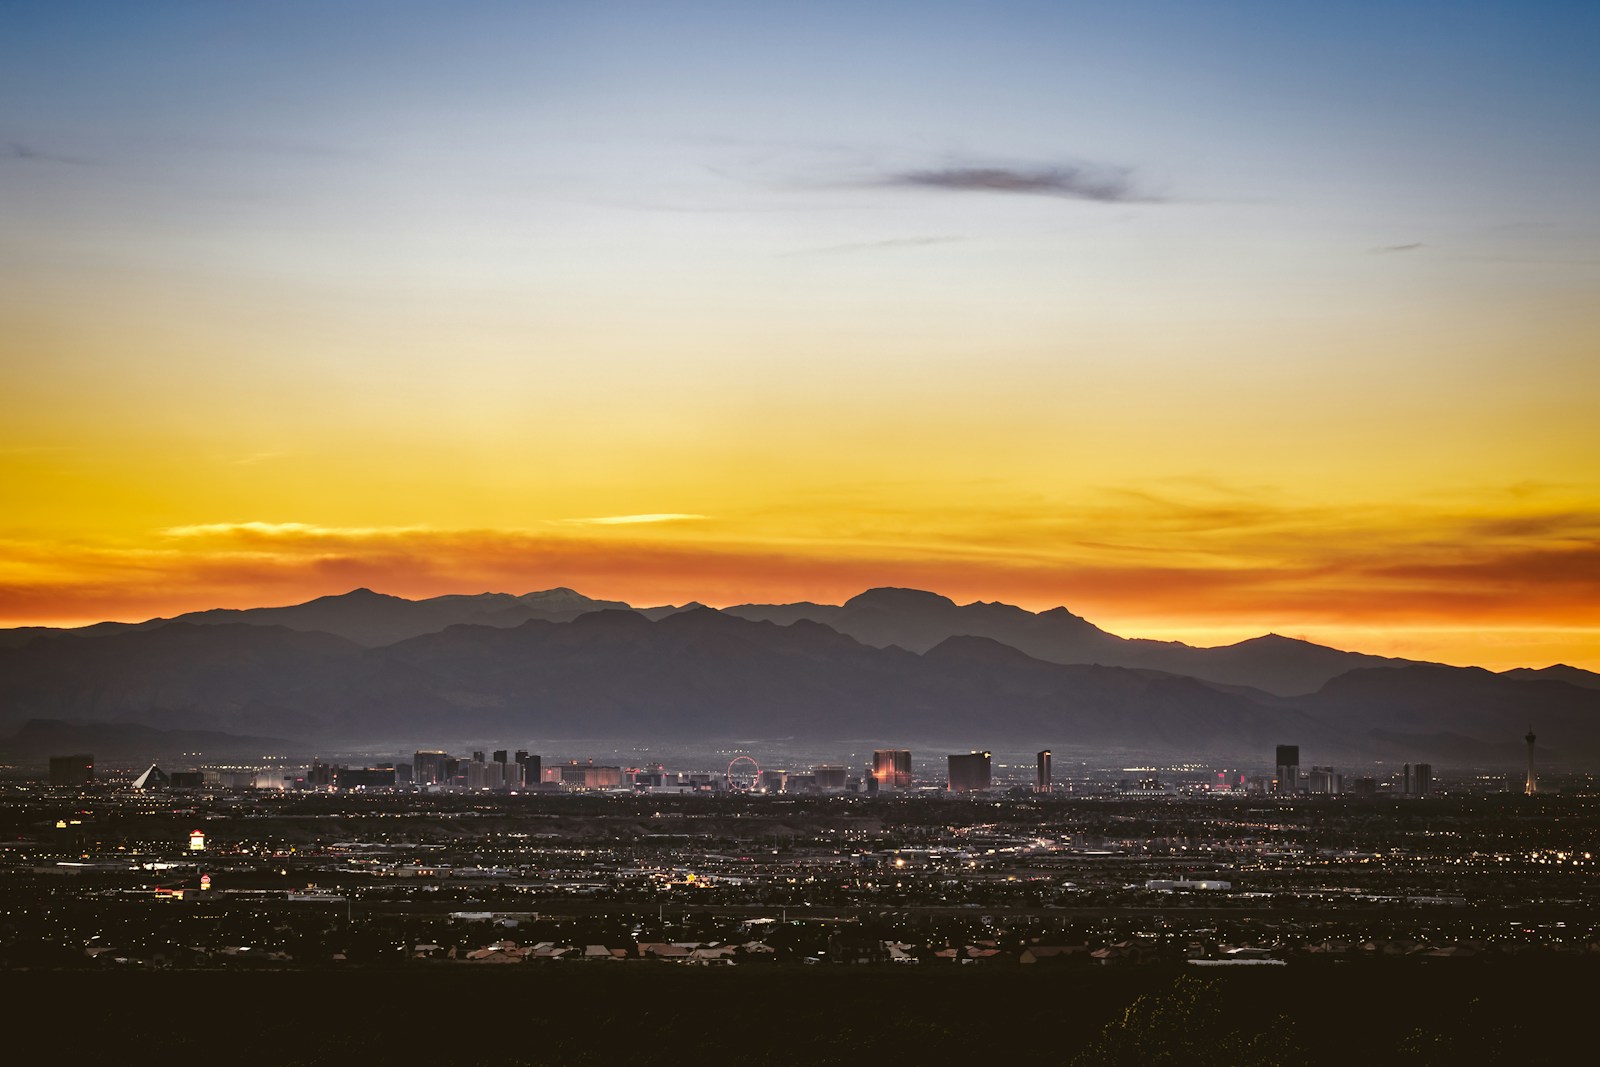
- Average annual increase in NWS dust storm warnings, 2006-2024: +1.6 per year
- Worst year for dust storm warnings: 2022 (60 warnings)
- Total population: 2,293,764
- County seat: Las Vegas
11. Graham County, AZ
- Average annual increase in NWS dust storm warnings, 2006-2024: +1.6 per year
- Worst year for dust storm warnings: 2018 (49 warnings)
- Total population: 38,860
- County seat: Safford
10. Yuma County, AZ

- Average annual increase in NWS dust storm warnings, 2006-2024: +1.7 per year
- Worst year for dust storm warnings: 2022 (93 warnings)
- Total population: 207,685
- County seat: Yuma
9. Imperial County, CA
- Average annual increase in NWS dust storm warnings, 2006-2024: +1.7 per year
- Worst year for dust storm warnings: 2022 (104 warnings)
- Total population: 179,319
- County seat: El Centro
8. San Bernardino County, CA
- Average annual increase in NWS dust storm warnings, 2006-2024: +1.8 per year
- Worst year for dust storm warnings: 2022 (82 warnings)
- Total population: 2,187,816
- County seat: San Bernardino
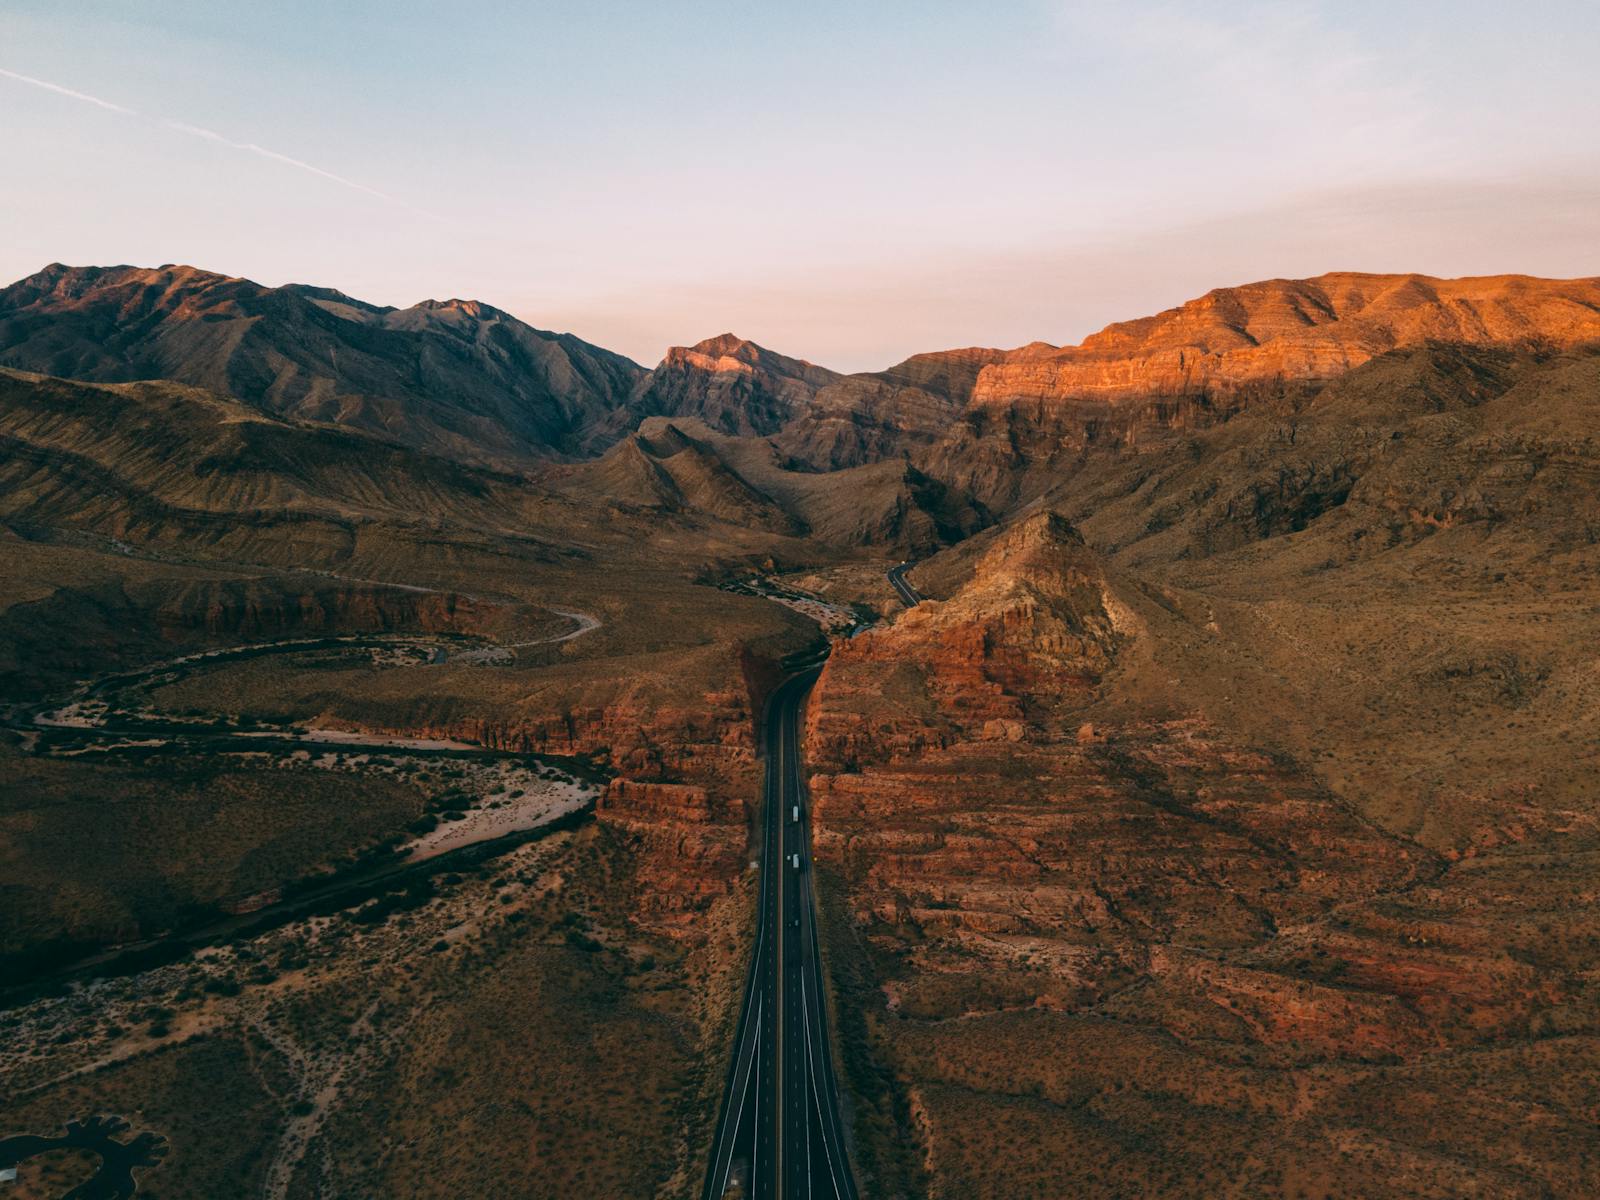
7. Mohave County, AZ
- Average annual increase in NWS dust storm warnings, 2006-2024: +1.9 per year
- Worst year for dust storm warnings: 2022 (82 warnings)
- Total population: 217,420
- County seat: Kingman
6. Yavapai County, AZ

- Average annual increase in NWS dust storm warnings, 2006-2024: +2.0 per year
- Worst year for dust storm warnings: 2022 (77 warnings)
- Total population: 241,656
- County seat: Prescott
5. Pinal County, AZ
- Average annual increase in NWS dust storm warnings, 2006-2024: +2.2 per year
- Worst year for dust storm warnings: 2018 (127 warnings)
- Total population: 449,219
- County seat: Florence
4. La Paz County, AZ
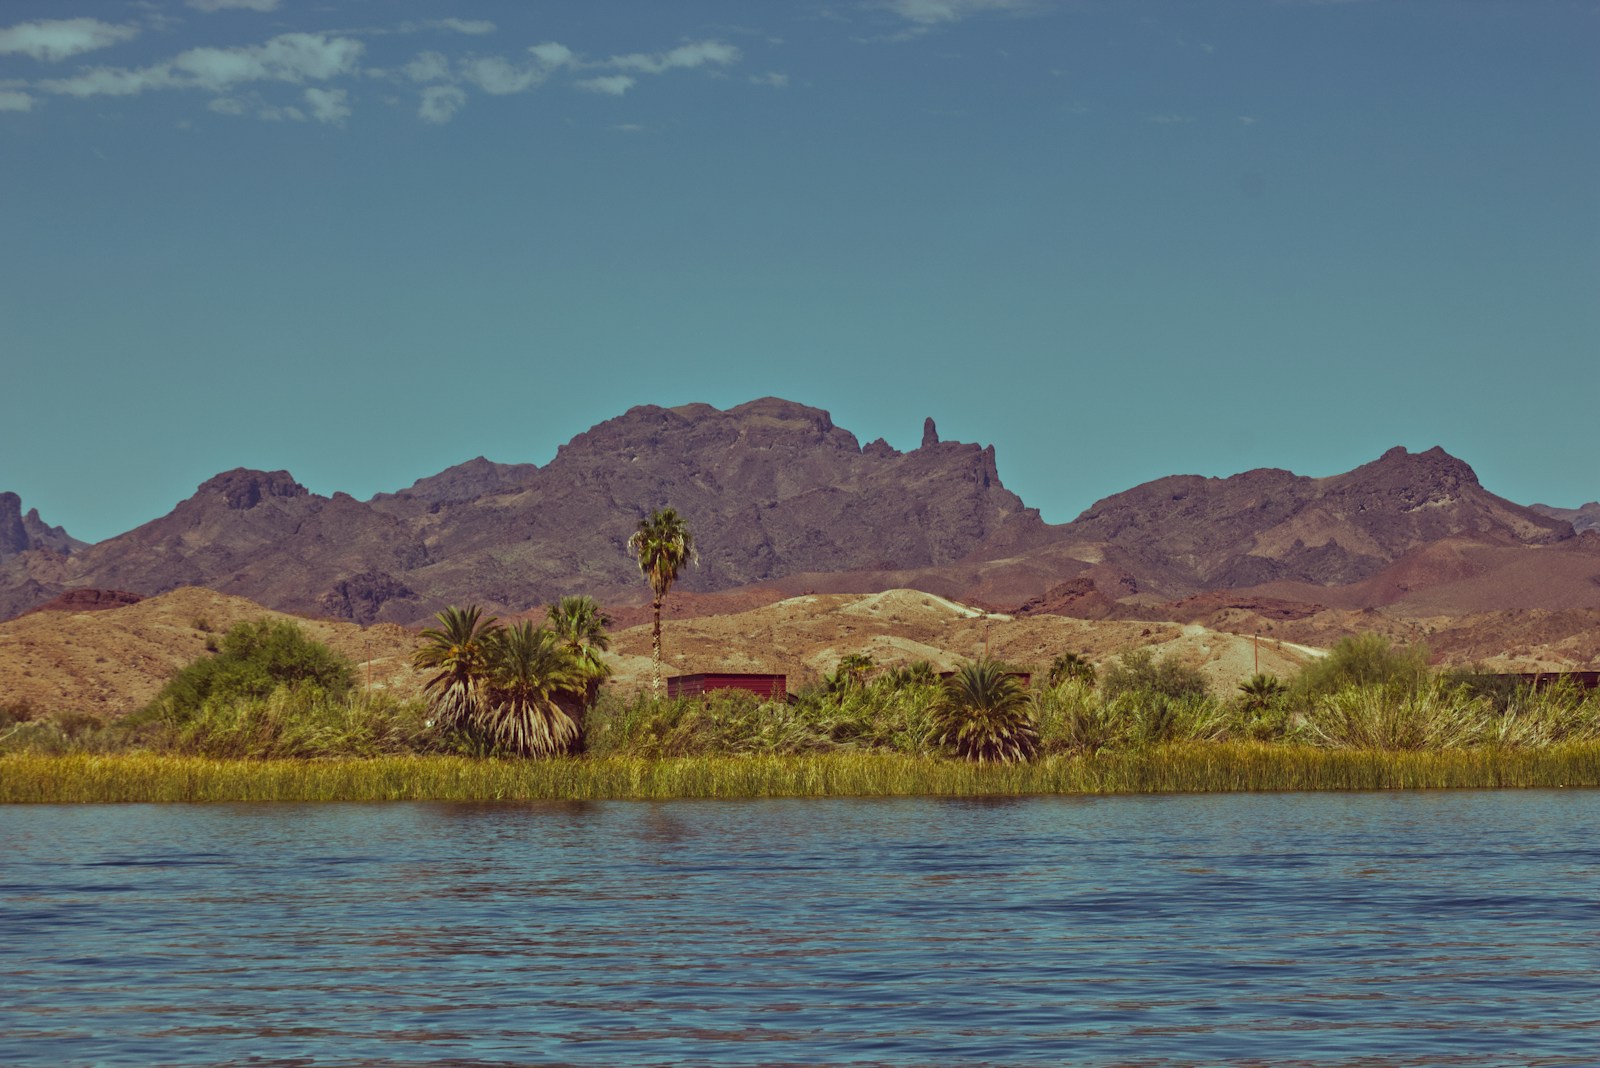
- Average annual increase in NWS dust storm warnings, 2006-2024: +2.4 per year
- Worst year for dust storm warnings: 2022 (128 warnings)
- Total population: 16,605
- County seat: Parker
3. Gila County, AZ
- Average annual increase in NWS dust storm warnings, 2006-2024: +2.4 per year
- Worst year for dust storm warnings: 2022 (78 warnings)
- Total population: 53,610
- County seat: Globe
2. Maricopa County, AZ

- Average annual increase in NWS dust storm warnings, 2006-2024: +2.9 per year
- Worst year for dust storm warnings: 2022 (169 warnings)
- Total population: 4,491,987
- County seat: Phoenix
1. Pima County, AZ
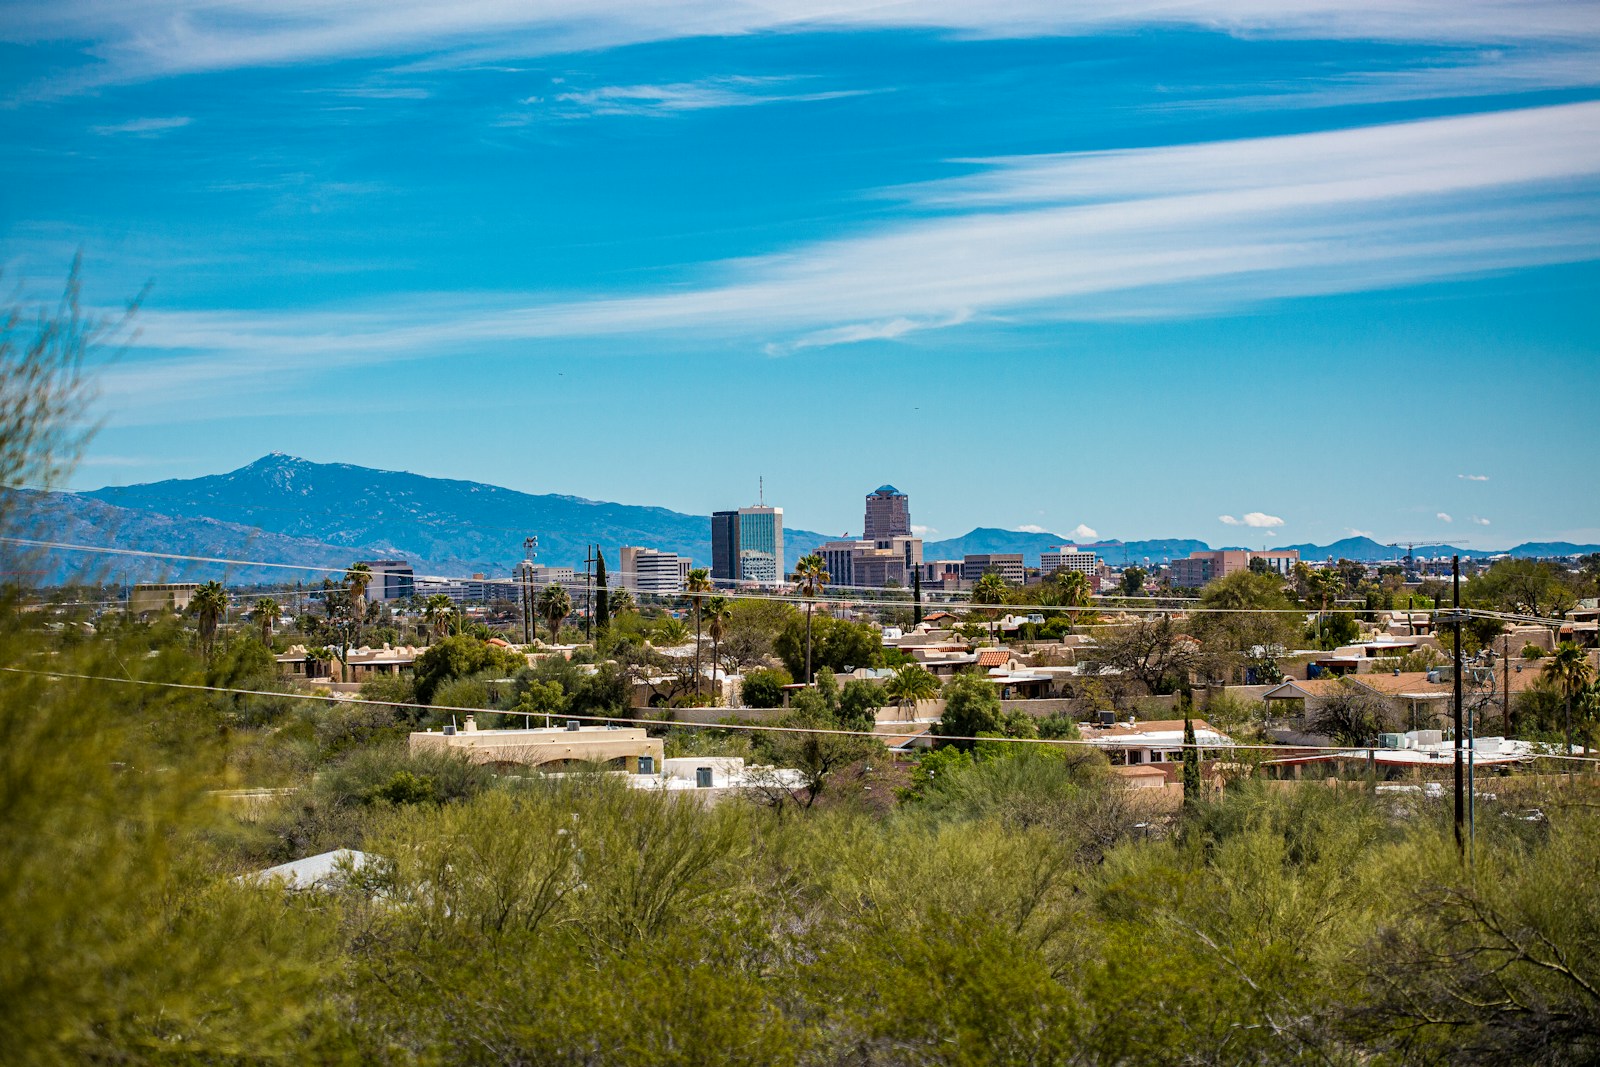
- Average annual increase in NWS dust storm warnings, 2006-2024: +3.0 per year
- Worst year for dust storm warnings: 2022 (115 warnings)
- Total population: 1,049,947
- County seat: Tucson