States Where the Most People Oppose the Transition to Clean Energy
 https://climate-crisis-247-bucket.nyc3.cdn.digitaloceanspaces.com/wp-content/uploads/2025/09/07200857/3976320-150x150.jpeg
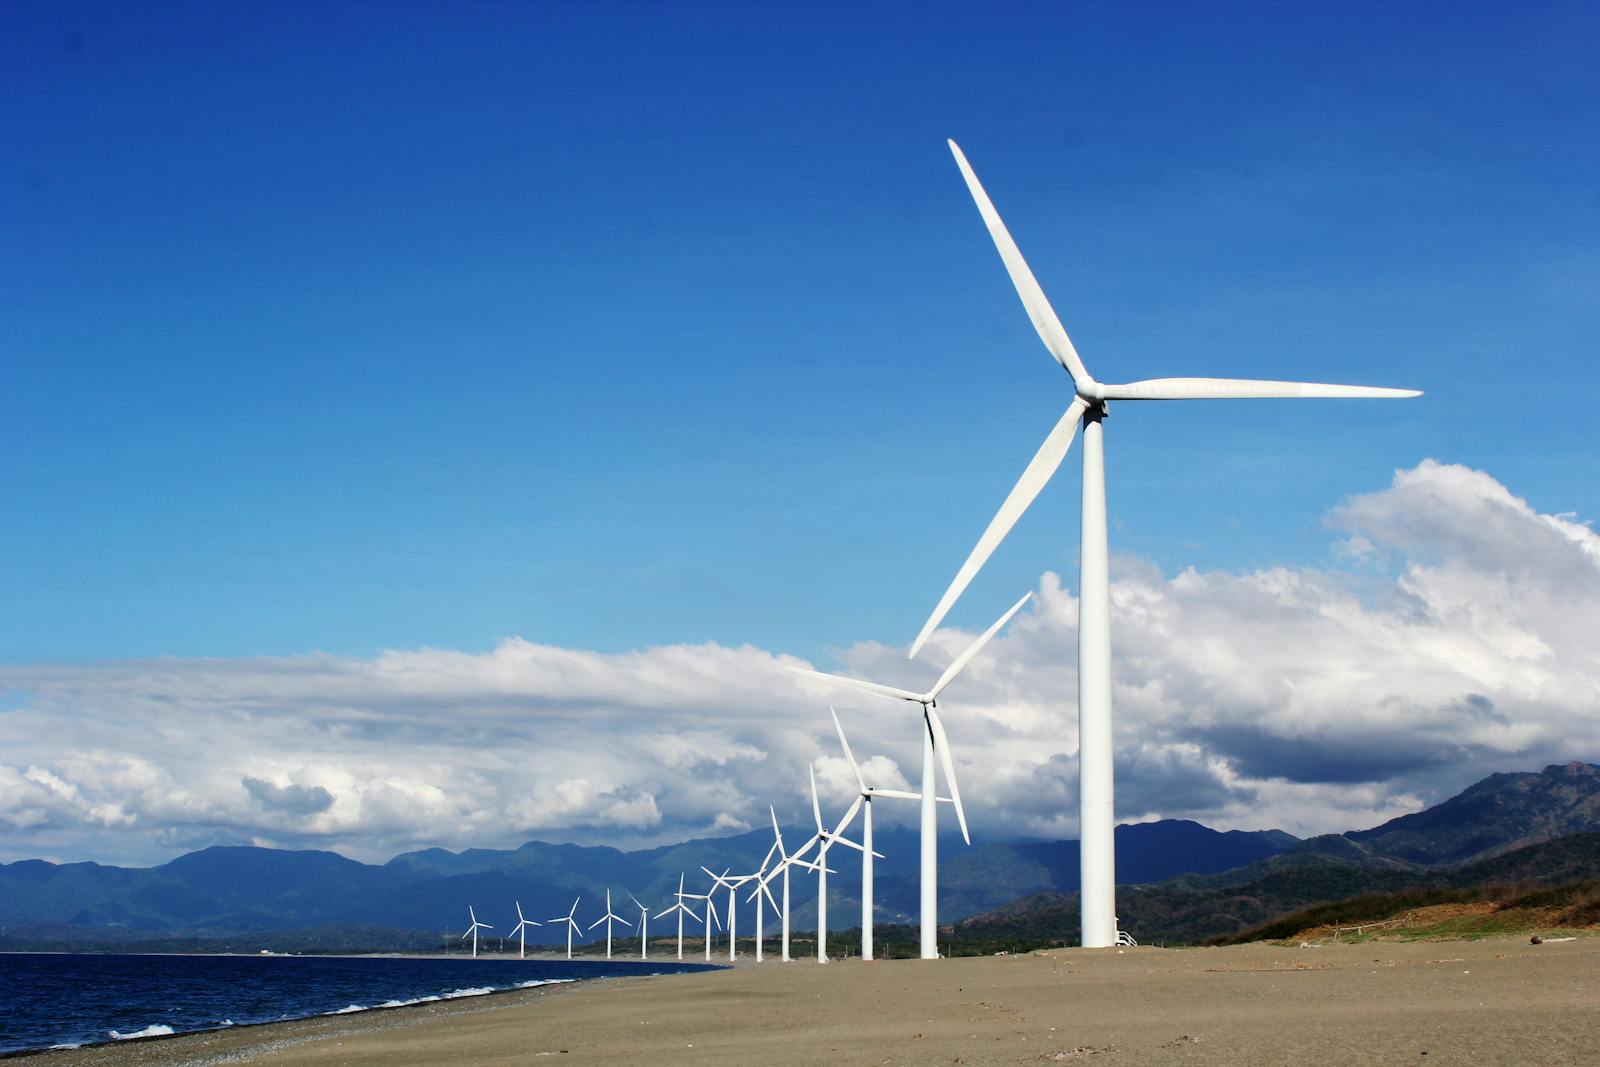
During his term in office, President Joe Biden set a goal of transitioning the entire country to a carbon-neutral economy by 2050. Now, under President Donald Trump – whose Energy Secretary stated that “net-zero 2050 is a sinister goal” – many of the Biden administration’s key climate policies have been dismantled, greatly diminishing any hope for a clean-energy economy within the next quarter century.
Despite the Trump administration’s apparent hostility toward a shift to clean energy, most Americans embrace the goal of net-zero. According to a 2024 survey conducted by the Yale Program on Climate Change Communication, 66.2% of adults in the United States support a complete transition of the U.S. economy from fossil fuels to clean energy sources by 2050, compared to only 33.8% who oppose the transition.
But outright opposition to a clean-energy economy is by no means limited to the White House. In certain parts of the country, Americans are far more likely than average to reject clean-energy initiatives. It is likely no coincidence that many of these same places are also leading producers of coal or oil, two of the heaviest-polluting fuel sources.
Using data from the YPCCC report Yale Climate Opinion Maps 2024, Climate Crisis 247 identified the states where the most people oppose a complete transition to clean energy by 2050. We ranked the 10 states where the largest shares of the 18 and older population oppose a net-zero economy by 2050. Supplemental data on state-level coal production in 2023 and oil production in 2022 are from the U.S. Energy Information Administration. The YPCCC bears no responsibility for the analyses or interpretations of the data presented here.
In each state on this list, the share of residents who oppose the shift to a clean-energy economy ranges from 43.5%, to 56.9%. Popular opinions on clean-energy policy in these places may be shaped, in part, by entrenched economic interests. Collectively, these 10 states account for over 15% of annual crude oil production in the United States, and 67% of domestic coal production.
10. Alabama
- Residents who oppose shift to a clean-energy economy by 2050: 43.5% (9.7 ppt. above national avg.)
- Annual, statewide crude oil production: 3,820,000 barrels – 0.1% of U.S. production (20th most of 50 states)
- Annual, statewide coal production: 12,043,311 short tons – 2.1% of U.S. production (11th most of 50 states)
9. Oklahoma

- Residents who oppose shift to a clean-energy economy by 2050: 43.8% (10.0 ppt. above national avg.)
- Annual, statewide crude oil production: 151,537,000 barrels – 3.5% of U.S. production (6th most of 50 states)
- Annual, statewide coal production: 1,793 short tons – 0.0% of U.S. production (21st most of 50 states)
8. Idaho
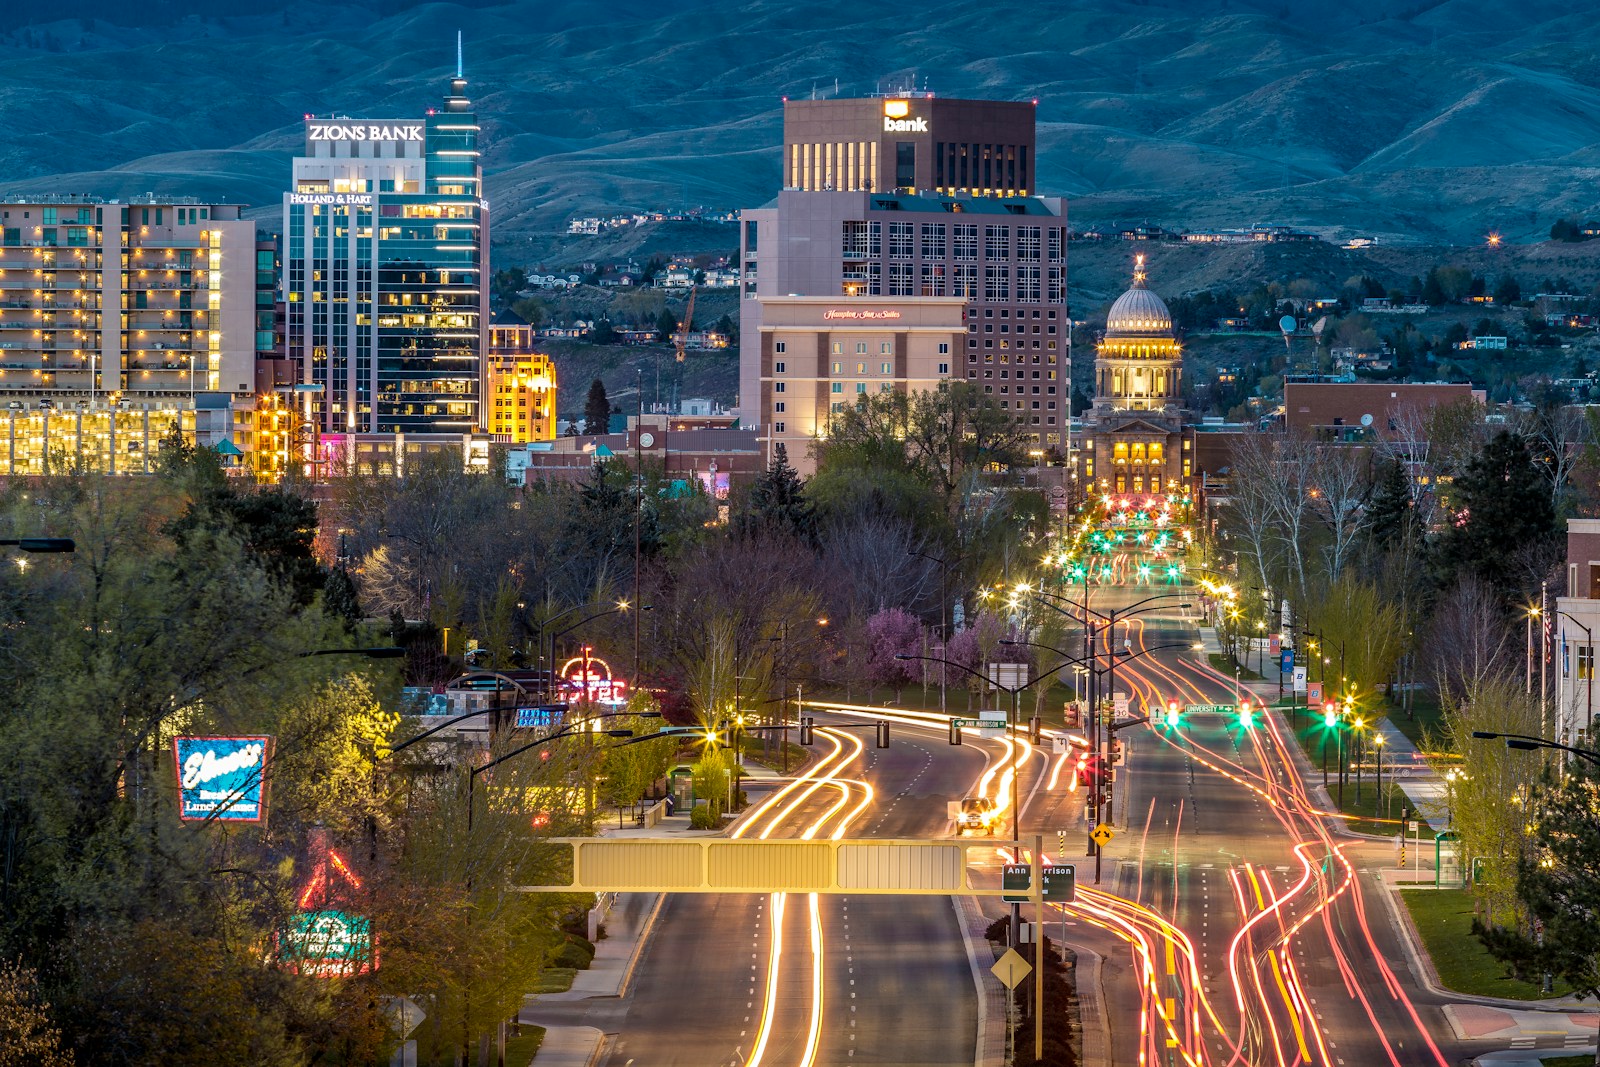
- Residents who oppose shift to a clean-energy economy by 2050: 45.0% (11.3 ppt. above national avg.)
- Annual, statewide crude oil production: 37,000 barrels – 0.0% of U.S. production (21st least of 50 states)
- Annual, statewide coal production: None
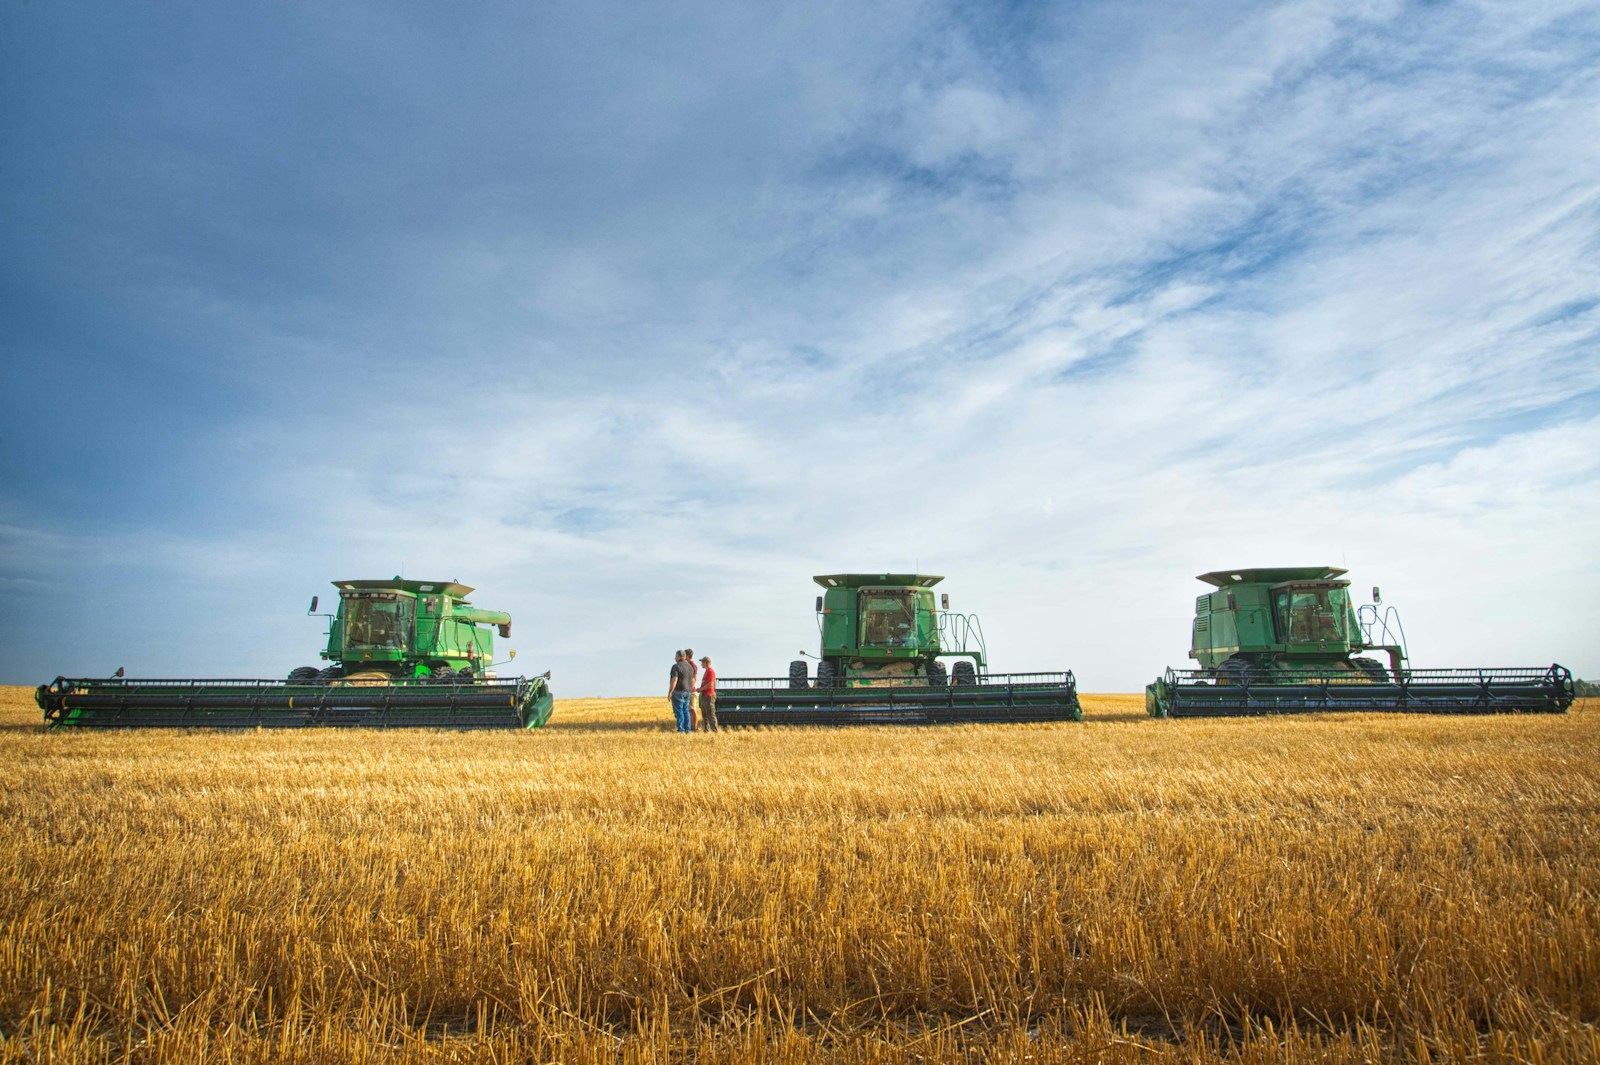
7. Nebraska

- Residents who oppose shift to a clean-energy economy by 2050: 45.8% (12.0 ppt. above national avg.)
- Annual, statewide crude oil production: 1,489,000 barrels – 0.0% of U.S. production (23rd most of 50 states)
- Annual, statewide coal production: None
6. Montana
- Residents who oppose shift to a clean-energy economy by 2050: 46.5% (12.7 ppt. above national avg.)
- Annual, statewide crude oil production: 20,585,000 barrels – 0.5% of U.S. production (13th most of 50 states)
- Annual, statewide coal production: 29,071,803 short tons – 5.0% of U.S. production (5th most of 50 states)
5. Arkansas
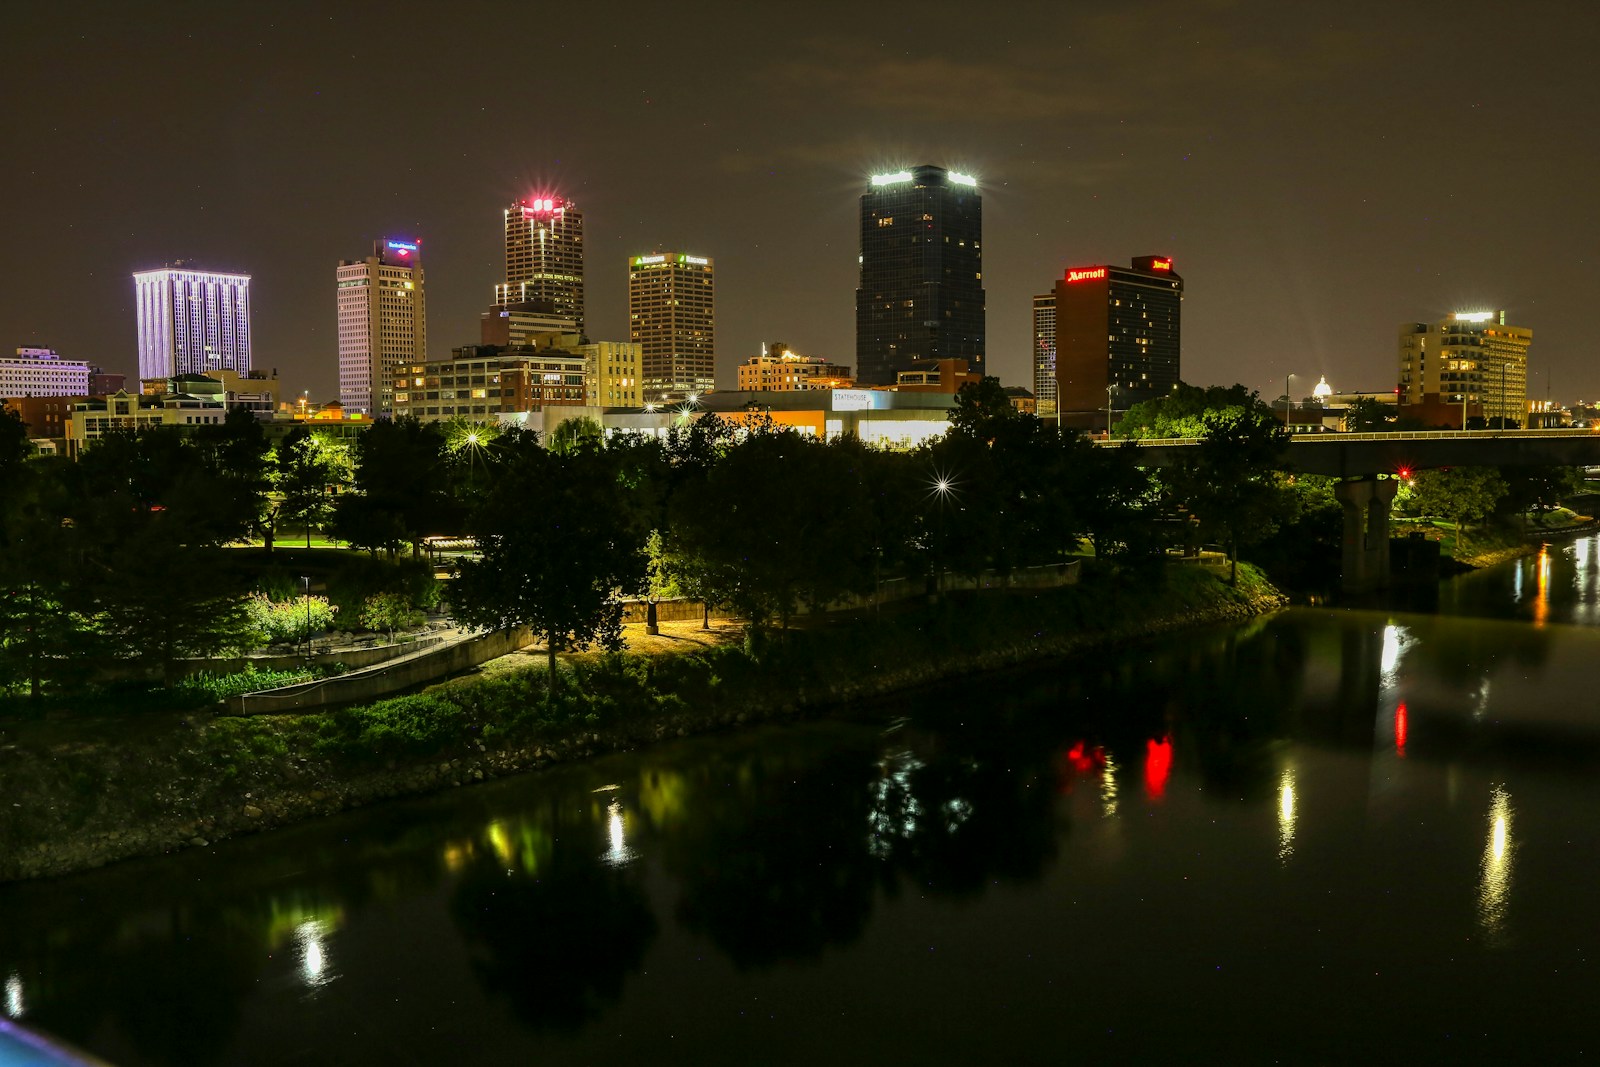
- Residents who oppose shift to a clean-energy economy by 2050: 46.6% (12.8 ppt. above national avg.)
- Annual, statewide crude oil production: 4,445,000 barrels – 0.1% of U.S. production (19th most of 50 states)
- Annual, statewide coal production: None
4. South Dakota
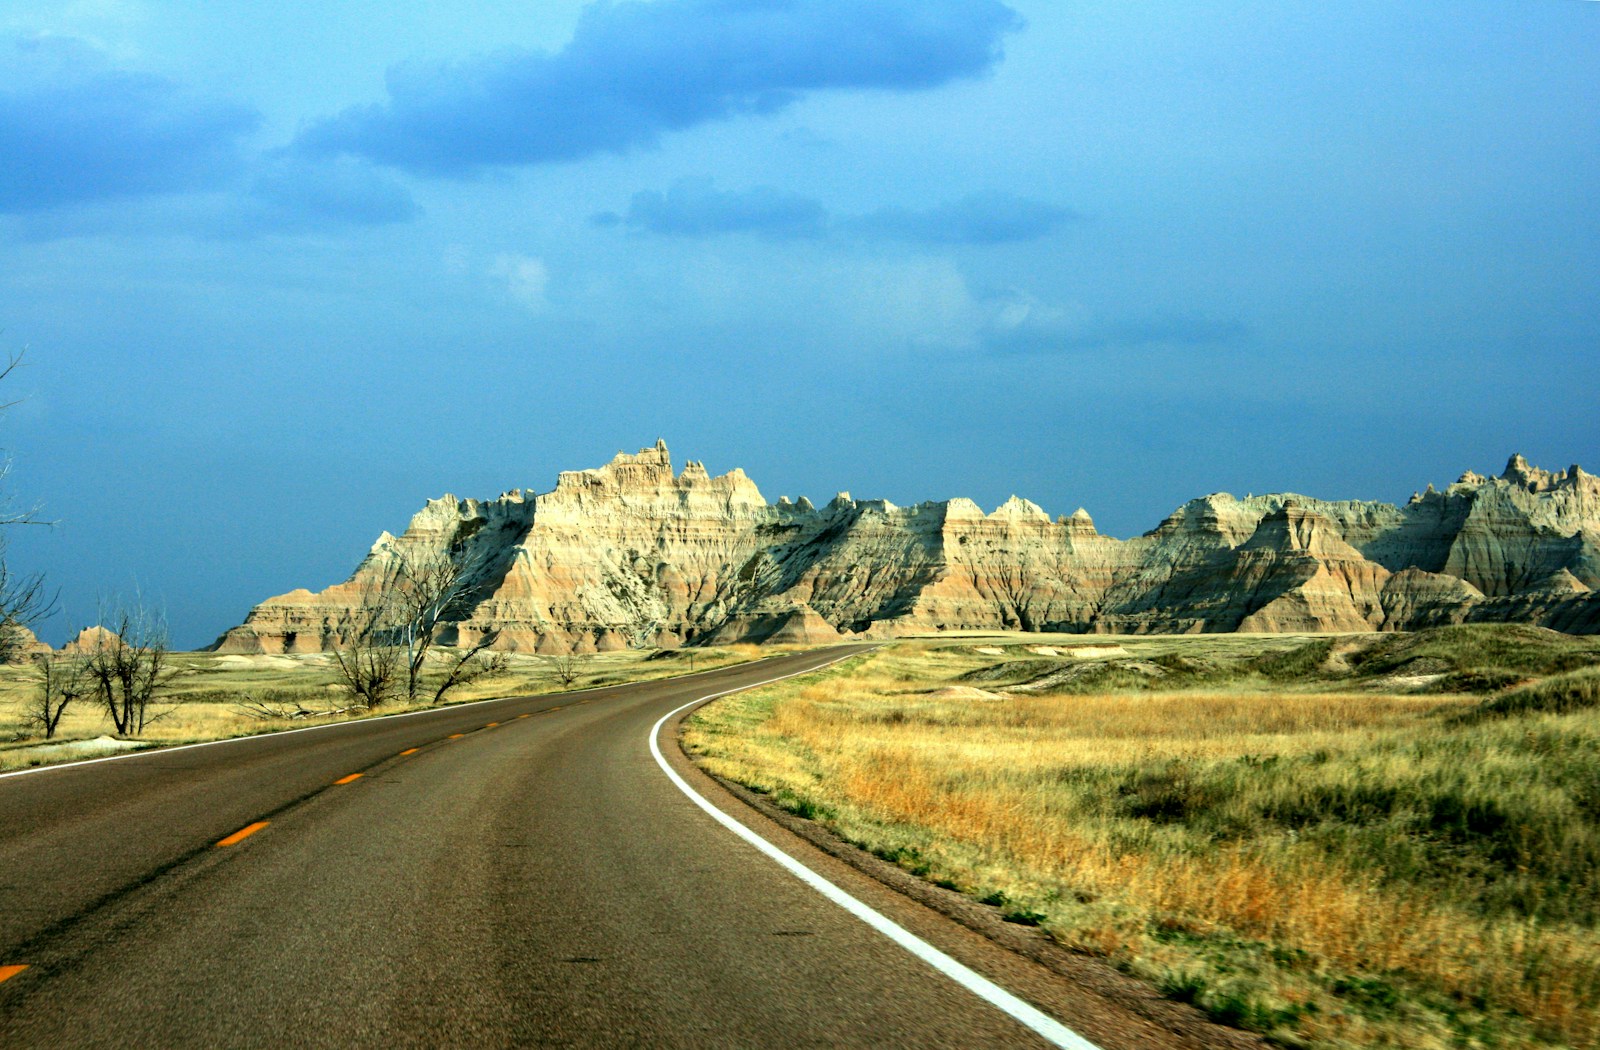
- Residents who oppose shift to a clean-energy economy by 2050: 47.2% (13.5 ppt. above national avg.)
- Annual, statewide crude oil production: 961,000 barrels – 0.0% of U.S. production (25th most of 50 states)
- Annual, statewide coal production: None
3. West Virginia
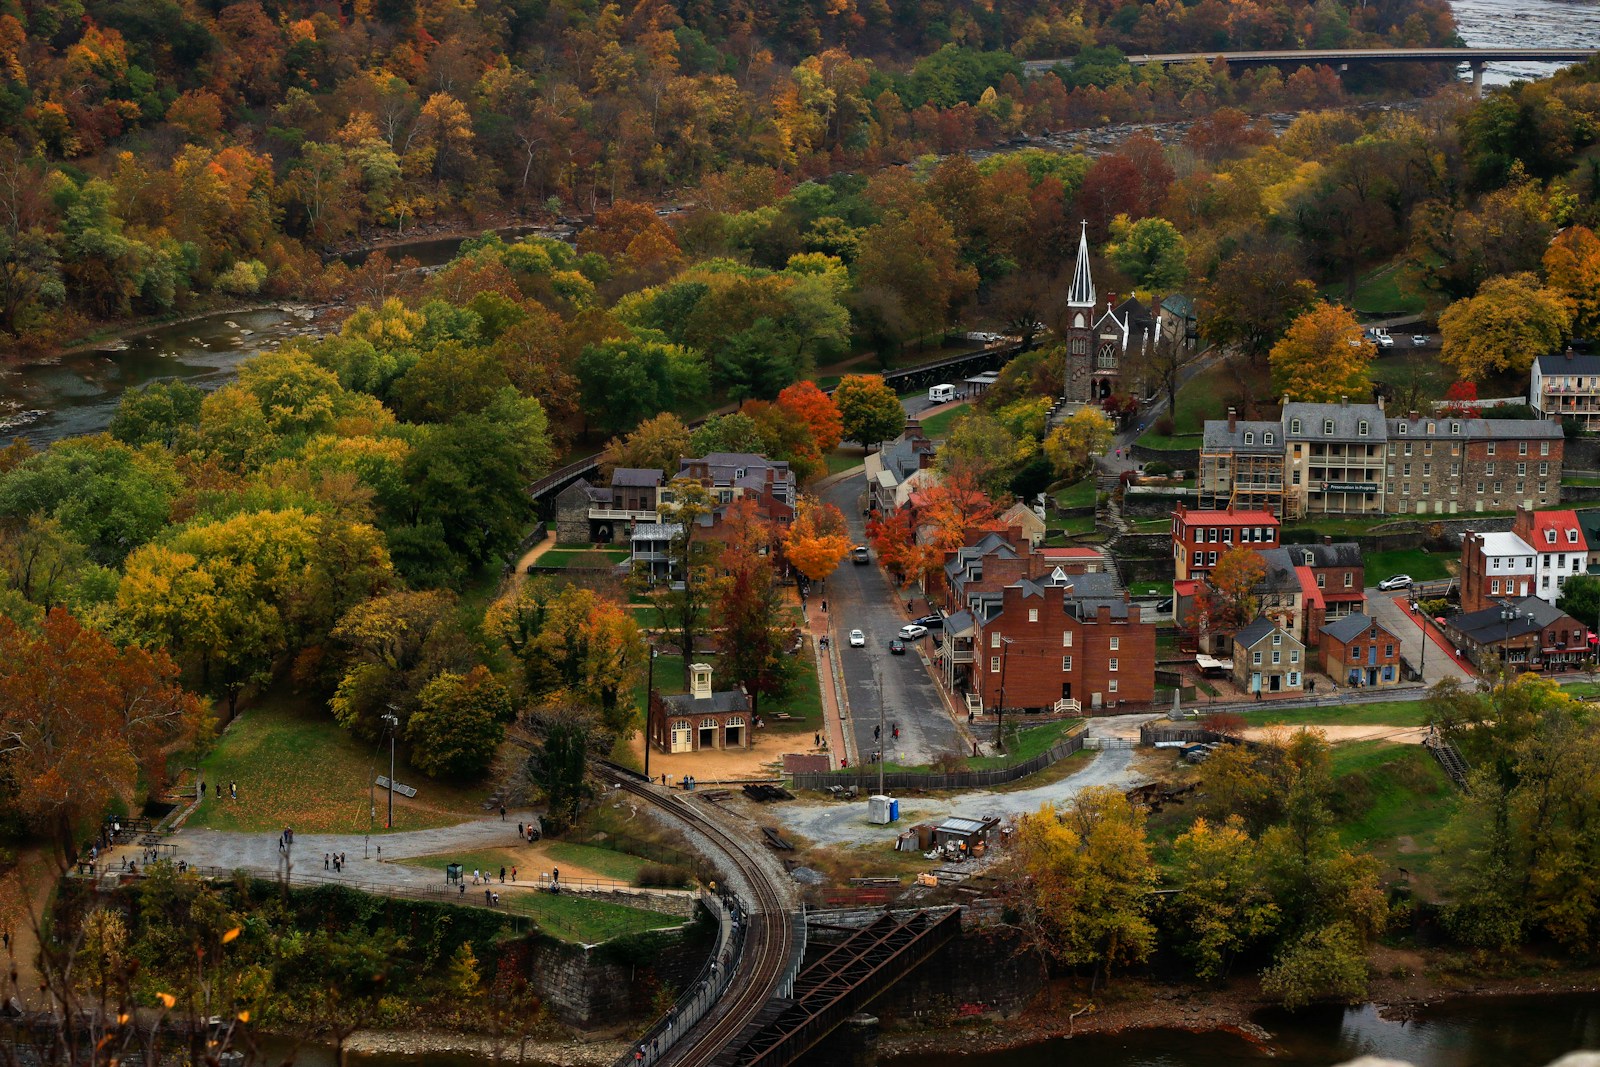
- Residents who oppose shift to a clean-energy economy by 2050: 51.9% (18.1 ppt. above national avg.)
- Annual, statewide crude oil production: 15,204,000 barrels – 0.3% of U.S. production (14th most of 50 states)
- Annual, statewide coal production: 84,559,546 short tons – 14.6% of U.S. production (2nd most of 50 states)
2. North Dakota
- Residents who oppose shift to a clean-energy economy by 2050: 54.9% (21.2 ppt. above national avg.)
- Annual, statewide crude oil production: 386,203,000 barrels – 8.9% of U.S. production (3rd most of 50 states)
- Annual, statewide coal production: 24,087,205 short tons – 4.2% of U.S. production (7th most of 50 states)
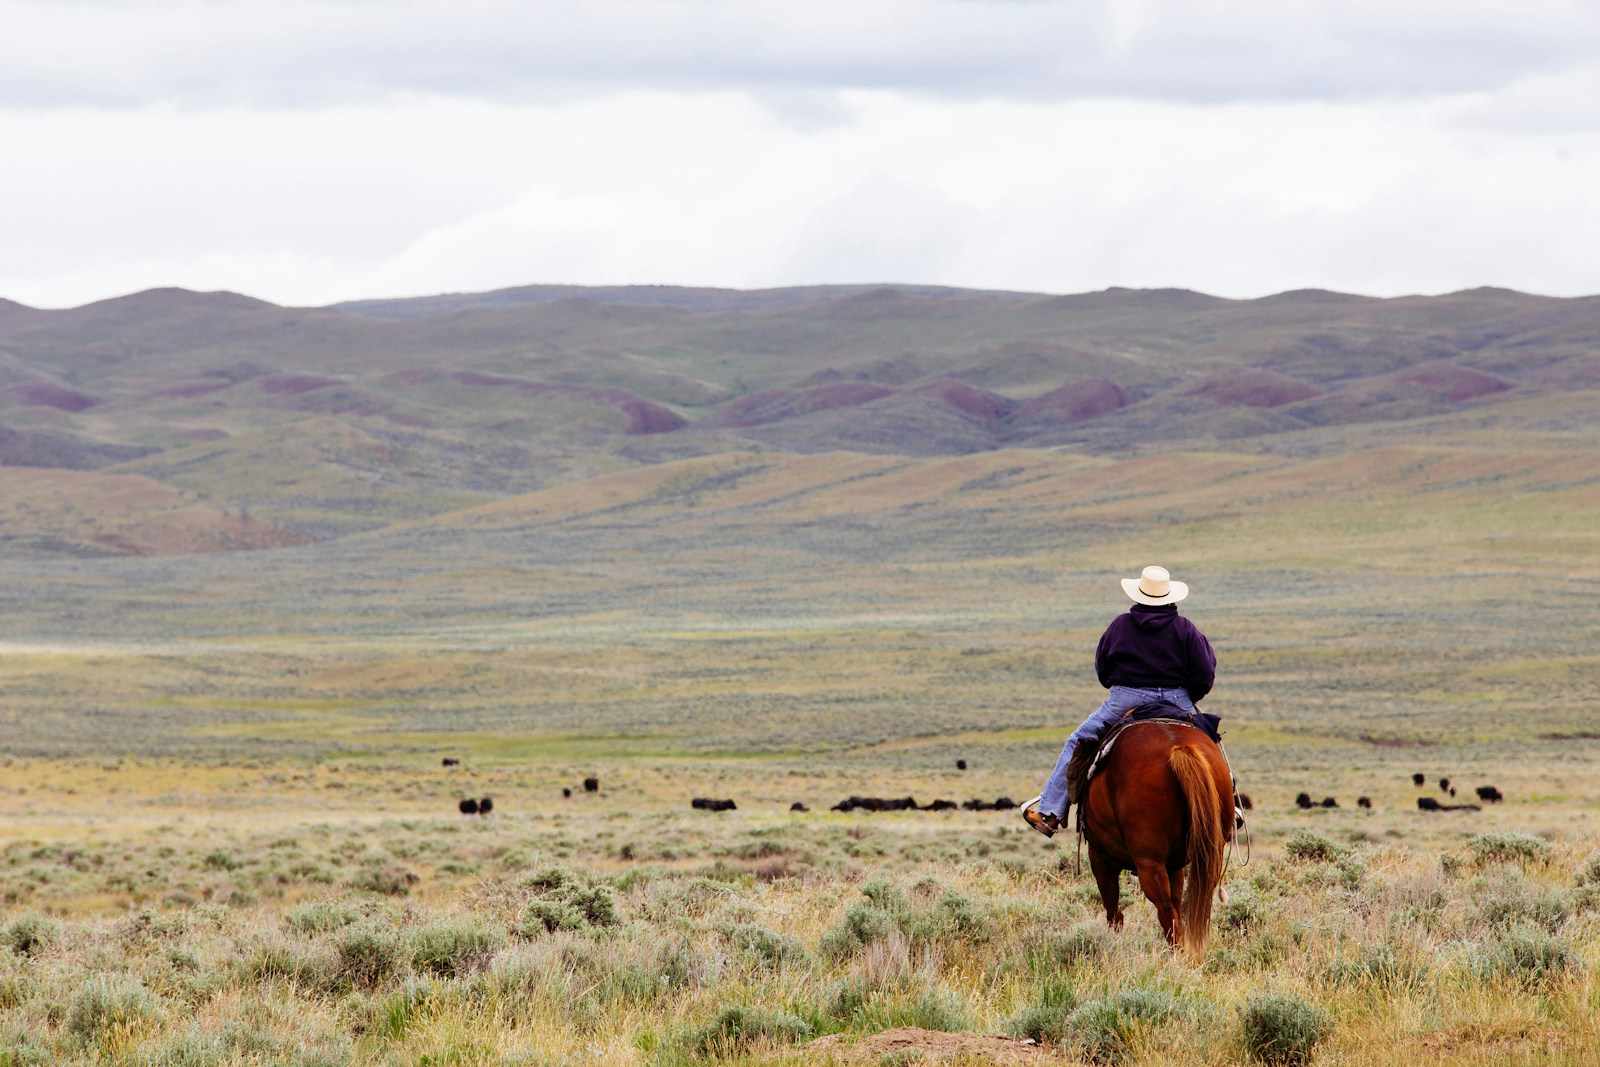
1. Wyoming
- Residents who oppose shift to a clean-energy economy by 2050: 56.9% (23.1 ppt. above national avg.)
- Annual, statewide crude oil production: 90,906,000 barrels – 2.1% of U.S. production (8th most of 50 states)
- Annual, statewide coal production: 237,261,496 short tons – 41.1% of U.S. production (the most of 50 states)