Tornado Alley Is Expanding South: Here’s Where Deadly Outbreaks Are Becoming More Common
 https://climate-crisis-247-bucket.nyc3.cdn.digitaloceanspaces.com/wp-content/uploads/2025/04/07223723/tornado_change_map-150x150.png
This year, severe storm systems have brought continuous heavy rain and tornadoes to large swaths of the central U.S. Thousands of residents have lost power as roads were flooded and homes were damaged, and at least 45 people have died.
Rain check? After FEMA Cuts, These Places Could Be Flooded for Weeks
Tesla takedown? A Timeline of Tesla Vandalism in the United States
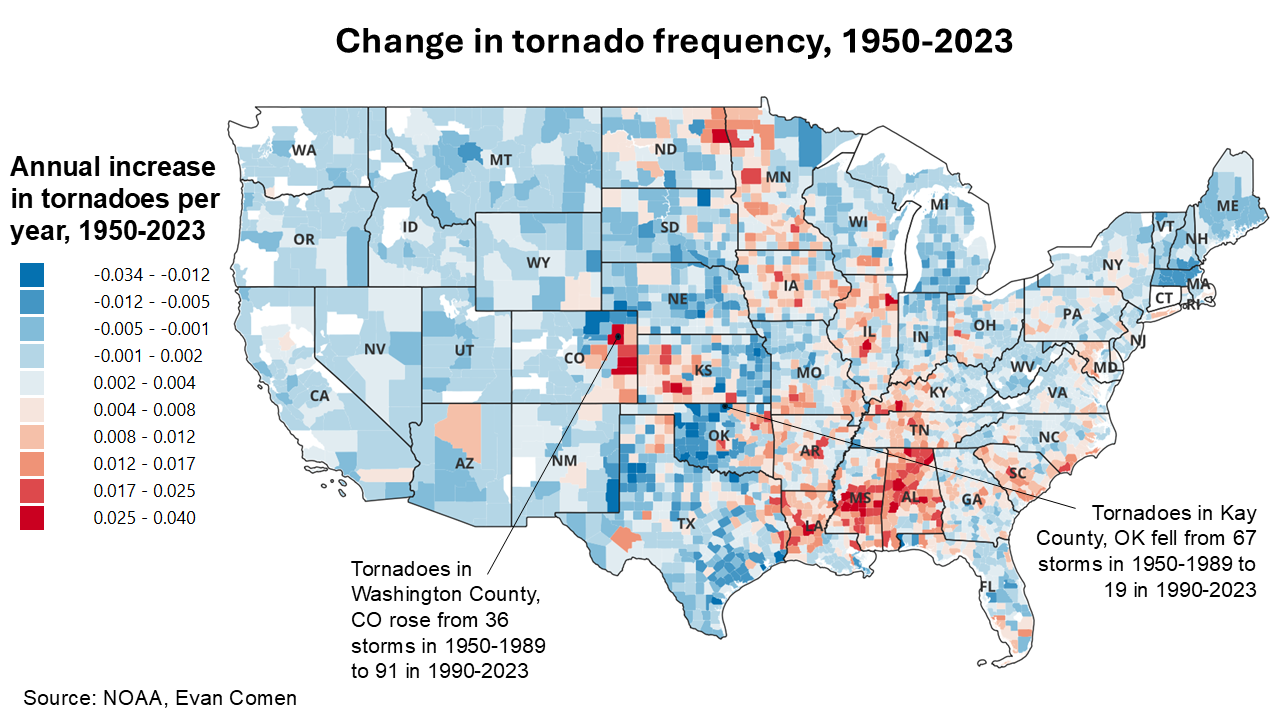
While the relationship between global temperatures and tornado frequency is complex, tornado outbreaks are becoming more common in some parts of the United States. Tornado frequency is trending downward in the “Tornado Alley” region of the Great Plains, and increasing in portions of the Southeast, Midwest, and Northeast. Rising tornado activity in fast-growing population centers also means greater property damage and a higher potential for injury and fatalities. A look at historical tornado tracks reveals the counties where tornado activity is increasing at the fastest rate.
To determine the counties where tornado activity is increasing the fastest, Climate Crisis 247 reviewed data on historical tornado tracks from the Storm Prediction Center of the NOAA’s National Weather Service. Counties were ranked based on the average annual increase in the number of tornados from 1950 to 2023. Tornadoes were assigned to counties using spatial intersection in GIS, assigning a tornado track to the county where it has the greatest overlap. Tornado death counts were assigned to counties with majority overlap of the tornado track.
25. Warren County, MS

- Annual increase in tornadoes, 1950-2023: +0.024 per year
- Est. tornado count, 1990-2023: 46 storms (148 injuries)
- Est. tornado count, 1950-1989: 17 storms (472 injuries)
- Worst tornado: December 5, 1953 (270 injuries)
24. Hale County, AL

- Annual increase in tornadoes, 1950-2023: +0.024 per year
- Est. tornado count, 1990-2023: 36 storms (82 injuries)
- Est. tornado count, 1950-1989: 11 storms (204 injuries)
- Worst tornado: May 27, 1973 (199 injuries)
23. Jackson County, AL

- Annual increase in tornadoes, 1950-2023: +0.024 per year
- Est. tornado count, 1990-2023: 39 storms (141 injuries)
- Est. tornado count, 1950-1989: 11 storms (24 injuries)
- Worst tornado: May 18, 1995 (55 injuries)
22. Madison County, AL

- Annual increase in tornadoes, 1950-2023: +0.025 per year
- Est. tornado count, 1990-2023: 51 storms (216 injuries)
- Est. tornado count, 1950-1989: 27 storms (1,075 injuries)
- Worst tornado: November 15, 1989 (463 injuries)
21. Rapides Parish, LA

- Annual increase in tornadoes, 1950-2023: +0.026 per year
- Est. tornado count, 1990-2023: 49 storms (6 injuries)
- Est. tornado count, 1950-1989: 29 storms (120 injuries)
- Worst tornado: December 3, 1953 (50 injuries)
20. Scott County, MS

- Annual increase in tornadoes, 1950-2023: +0.026 per year
- Est. tornado count, 1990-2023: 46 storms (15 injuries)
- Est. tornado count, 1950-1989: 21 storms (835 injuries)
- Worst tornado: March 3, 1966 (518 injuries)
19. Elmore County, AL

- Annual increase in tornadoes, 1950-2023: +0.026 per year
- Est. tornado count, 1990-2023: 38 storms (105 injuries)
- Est. tornado count, 1950-1989: 11 storms (77 injuries)
- Worst tornado: February 17, 2008 (50 injuries)
18. Lauderdale County, MS

- Annual increase in tornadoes, 1950-2023: +0.026 per year
- Est. tornado count, 1990-2023: 46 storms (96 injuries)
- Est. tornado count, 1950-1989: 10 storms (27 injuries)
- Worst tornado: March 10, 1992 (57 injuries)
17. Will County, IL

- Annual increase in tornadoes, 1950-2023: +0.027 per year
- Est. tornado count, 1990-2023: 53 storms (378 injuries)
- Est. tornado count, 1950-1989: 34 storms (129 injuries)
- Worst tornado: August 28, 1990 (350 injuries)
16. Ford County, KS

- Annual increase in tornadoes, 1950-2023: +0.027 per year
- Est. tornado count, 1990-2023: 70 storms (2 injuries)
- Est. tornado count, 1950-1989: 30 storms ( injuries)
- Worst tornado: May 24, 2016 (1 injury)
15. Marengo County, AL

- Annual increase in tornadoes, 1950-2023: +0.028 per year
- Est. tornado count, 1990-2023: 38 storms (35 injuries)
- Est. tornado count, 1950-1989: 10 storms (5 injuries)
- Worst tornado: April 27, 2011 (17 injuries)
14. Christian County, IL

- Annual increase in tornadoes, 1950-2023: +0.028 per year
- Est. tornado count, 1990-2023: 40 storms (32 injuries)
- Est. tornado count, 1950-1989: 12 storms (12 injuries)
- Worst tornado: December 1, 2018 (22 injuries)
13. DeKalb County, AL

- Annual increase in tornadoes, 1950-2023: +0.029 per year
- Est. tornado count, 1990-2023: 54 storms (202 injuries)
- Est. tornado count, 1950-1989: 17 storms (64 injuries)
- Worst tornado: April 27, 2011 (50 injuries)
12. Hinds County, MS

- Annual increase in tornadoes, 1950-2023: +0.030 per year
- Est. tornado count, 1990-2023: 63 storms (44 injuries)
- Est. tornado count, 1950-1989: 46 storms (638 injuries)
- Worst tornado: March 3, 1966 (518 injuries)
11. Yazoo County, MS

- Annual increase in tornadoes, 1950-2023: +0.031 per year
- Est. tornado count, 1990-2023: 45 storms (151 injuries)
- Est. tornado count, 1950-1989: 13 storms (186 injuries)
- Worst tornado: February 21, 1971 (182 injuries)
10. Smith County, MS

- Annual increase in tornadoes, 1950-2023: +0.031 per year
- Est. tornado count, 1990-2023: 60 storms (76 injuries)
- Est. tornado count, 1950-1989: 25 storms (350 injuries)
- Worst tornado: January 23, 1969 (241 injuries)
9. Cheyenne County, CO

- Annual increase in tornadoes, 1950-2023: +0.031 per year
- Est. tornado count, 1990-2023: 58 storms ( injuries)
- Est. tornado count, 1950-1989: 18 storms (5 injuries)
- Worst tornado: July 20, 1958 (5 injuries)
8. Grand Forks County, ND

- Annual increase in tornadoes, 1950-2023: +0.031 per year
- Est. tornado count, 1990-2023: 53 storms (19 injuries)
- Est. tornado count, 1950-1989: 16 storms (2 injuries)
- Worst tornado: August 26, 2007 (18 injuries)
7. Kiowa County, CO

- Annual increase in tornadoes, 1950-2023: +0.034 per year
- Est. tornado count, 1990-2023: 63 storms (17 injuries)
- Est. tornado count, 1950-1989: 26 storms (1 injury)
- Worst tornado: March 28, 2007 (9 injuries)
6. Limestone County, AL

- Annual increase in tornadoes, 1950-2023: +0.034 per year
- Est. tornado count, 1990-2023: 57 storms (245 injuries)
- Est. tornado count, 1950-1989: 11 storms (541 injuries)
- Worst tornado: April 3, 1974 (267 injuries)
5. Rankin County, MS

- Annual increase in tornadoes, 1950-2023: +0.035 per year
- Est. tornado count, 1990-2023: 67 storms (164 injuries)
- Est. tornado count, 1950-1989: 37 storms (892 injuries)
- Worst tornado: March 3, 1966 (518 injuries)
4. Leake County, MS

- Annual increase in tornadoes, 1950-2023: +0.035 per year
- Est. tornado count, 1990-2023: 56 storms (212 injuries)
- Est. tornado count, 1950-1989: 20 storms (655 injuries)
- Worst tornado: March 3, 1966 (518 injuries)
3. Tuscaloosa County, AL

- Annual increase in tornadoes, 1950-2023: +0.036 per year
- Est. tornado count, 1990-2023: 65 storms (1,996 injuries)
- Est. tornado count, 1950-1989: 20 storms (774 injuries)
- Worst tornado: April 27, 2011 (1,500 injuries)
2. Christian County, KY

- Annual increase in tornadoes, 1950-2023: +0.036 per year
- Est. tornado count, 1990-2023: 47 storms (607 injuries)
- Est. tornado count, 1950-1989: 5 storms (47 injuries)
- Worst tornado: December 10, 2021 (515 injuries)
1. Washington County, CO

- Annual increase in tornadoes, 1950-2023: +0.040 per year
- Est. tornado count, 1990-2023: 91 storms (6 injuries)
- Est. tornado count, 1950-1989: 36 storms (4 injuries)
- Worst tornado: July 21, 1993 (6 injuries)