Which Cities Lead in “Green Building?” The List May Surprise You; Hint: None in California
 https://climatecrisis247.com/wp-content/uploads/2024/09/460675-1-150x150.jpg
Buildings account for about one-third of all greenhouse gas emissions in the United States, making residential and commercial energy efficiency one of the key pillars in the transition to net zero. One of the ways developers are reducing the carbon footprint of households is through green building techniques, as codified in the LEED (Leadership in Energy and Environmental Design) program of the U.S. Green Building Council. Scoring buildings across categories like energy efficiency, water conservation, and indoor air quality, LEED provides certification to environmentally responsible buildings and encourages developers to incorporate more sustainable construction techniques.
Developers have embraced LEED building techniques with varying levels of zeal, creating high concentrations of modern, architecturally-striking green buildings scattered throughout the country. A look at LEED buildings per capita reveals a diverse list of urban and rural places on the cutting-edge of sustainable development.
To determine the cities with the most green buildings, Climate Crisis 247 reviewed data on LEED buildings from the U.S. Green Building Council. Cities, towns, and villages were ranked based on the number of buildings with LEED certification per 10,000 residents as of September 2024. Only places with at least 25,000 residents were considered. Population data is from the U.S. Census Bureau American Community Survey.
25. Alexandria, VA
- LEED buildings per capita: 29.9 per 10,000 residents
- LEED buildings total: 471
- Total population: 157,594
24. Grand Rapids, MI

- LEED buildings per capita: 30.5 per 10,000 residents
- LEED buildings total: 605
- Total population: 198,096
23. Lafayette, CO

- LEED buildings per capita: 30.7 per 10,000 residents
- LEED buildings total: 93
- Total population: 30,295
22. Washington, DC

- LEED buildings per capita: 31.1 per 10,000 residents
- LEED buildings total: 2,086
- Total population: 670,587
21. Prosper, TX
- LEED buildings per capita: 32.1 per 10,000 residents
- LEED buildings total: 101
- Total population: 31,507
20. Sachse, TX

- LEED buildings per capita: 32.3 per 10,000 residents
- LEED buildings total: 90
- Total population: 27,829
19. Rockville, MD

- LEED buildings per capita: 37.7 per 10,000 residents
- LEED buildings total: 253
- Total population: 67,142
18. Coeur d'Alene, ID

- LEED buildings per capita: 38.1 per 10,000 residents
- LEED buildings total: 208
- Total population: 54,599
17. Laurel, MD

- LEED buildings per capita: 38.2 per 10,000 residents
- LEED buildings total: 113
- Total population: 29,581
16. Fairbanks, AK
- LEED buildings per capita: 42.5 per 10,000 residents
- LEED buildings total: 138
- Total population: 32,496
15. Cincinnati, OH

- LEED buildings per capita: 43.2 per 10,000 residents
- LEED buildings total: 1,335
- Total population: 308,870
14. Hobbs, NM

- LEED buildings per capita: 43.7 per 10,000 residents
- LEED buildings total: 174
- Total population: 39,782
13. Gilbert, AZ

- LEED buildings per capita: 45.0 per 10,000 residents
- LEED buildings total: 1,202
- Total population: 267,267
12. Wylie, TX
- LEED buildings per capita: 46.1 per 10,000 residents
- LEED buildings total: 263
- Total population: 57,063
11. Jacksonville, NC

- LEED buildings per capita: 47.0 per 10,000 residents
- LEED buildings total: 338
- Total population: 71,908
10. Ithaca, NY

- LEED buildings per capita: 47.2 per 10,000 residents
- LEED buildings total: 148
- Total population: 31,359
9. Hutto, TX
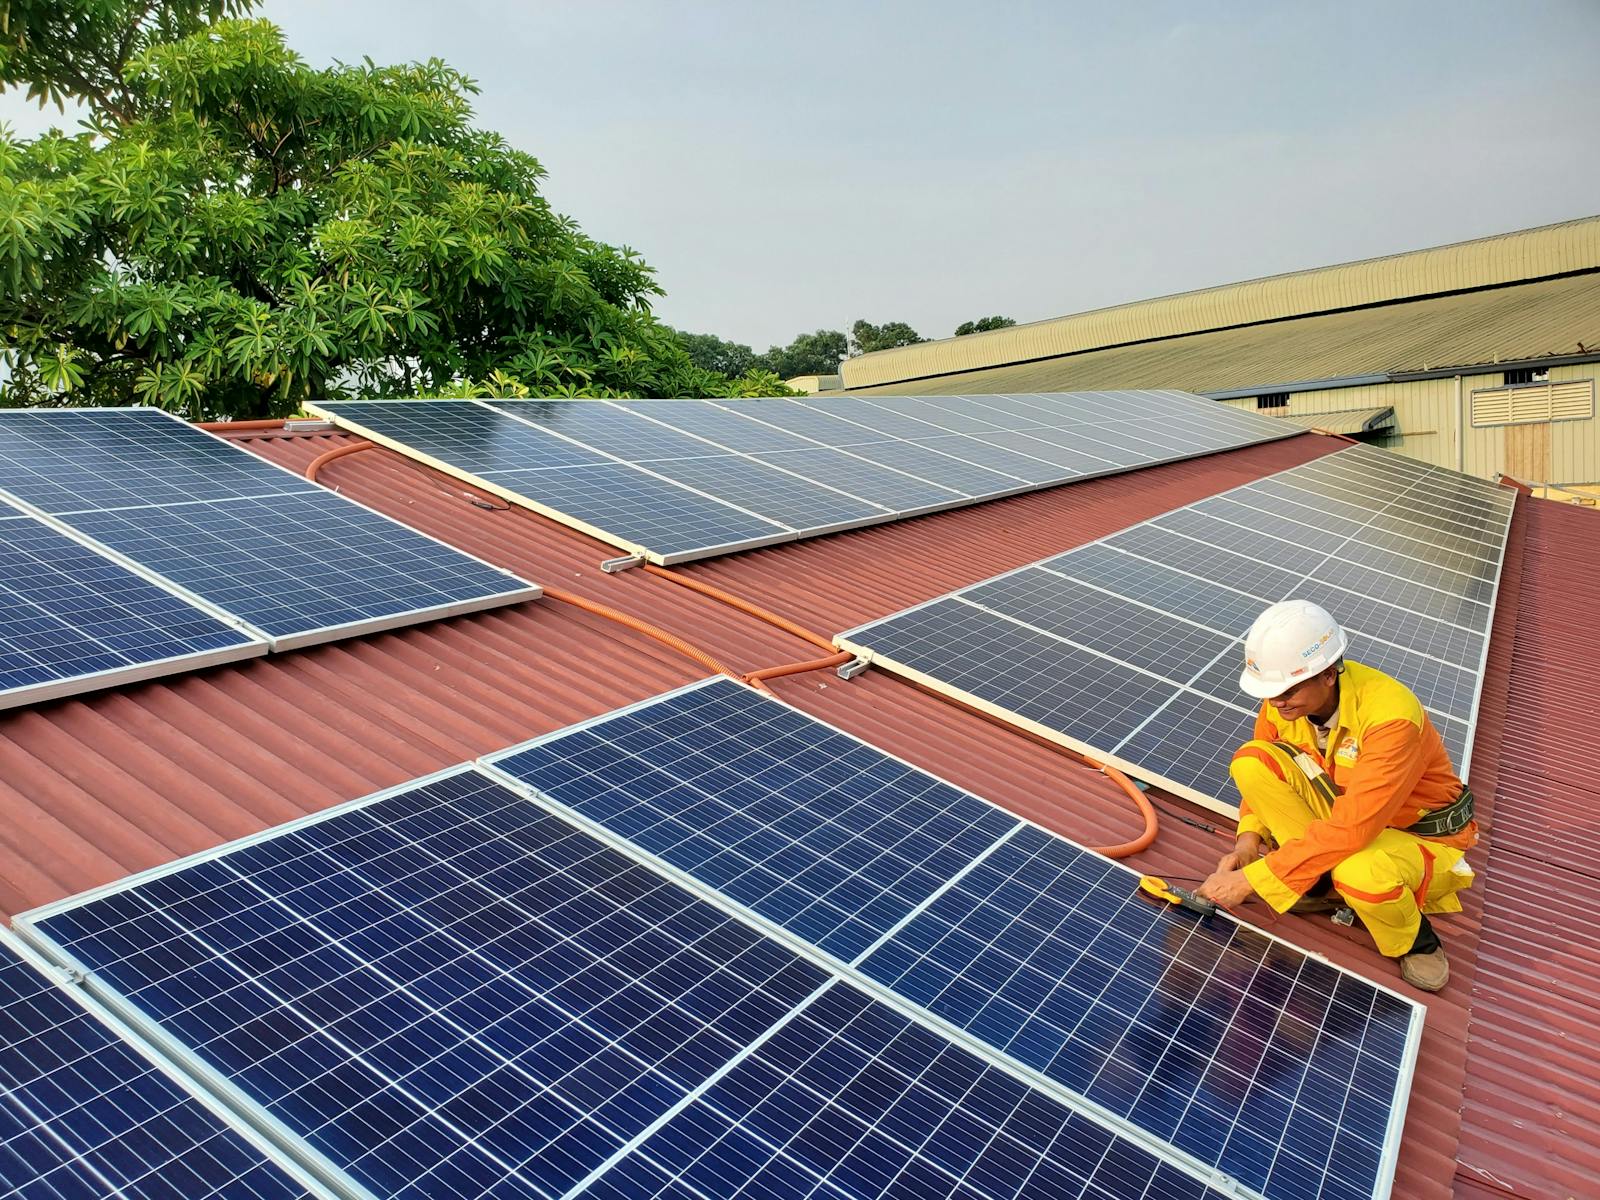
- LEED buildings per capita: 50.2 per 10,000 residents
- LEED buildings total: 148
- Total population: 29,498
8. Queen Creek, AZ
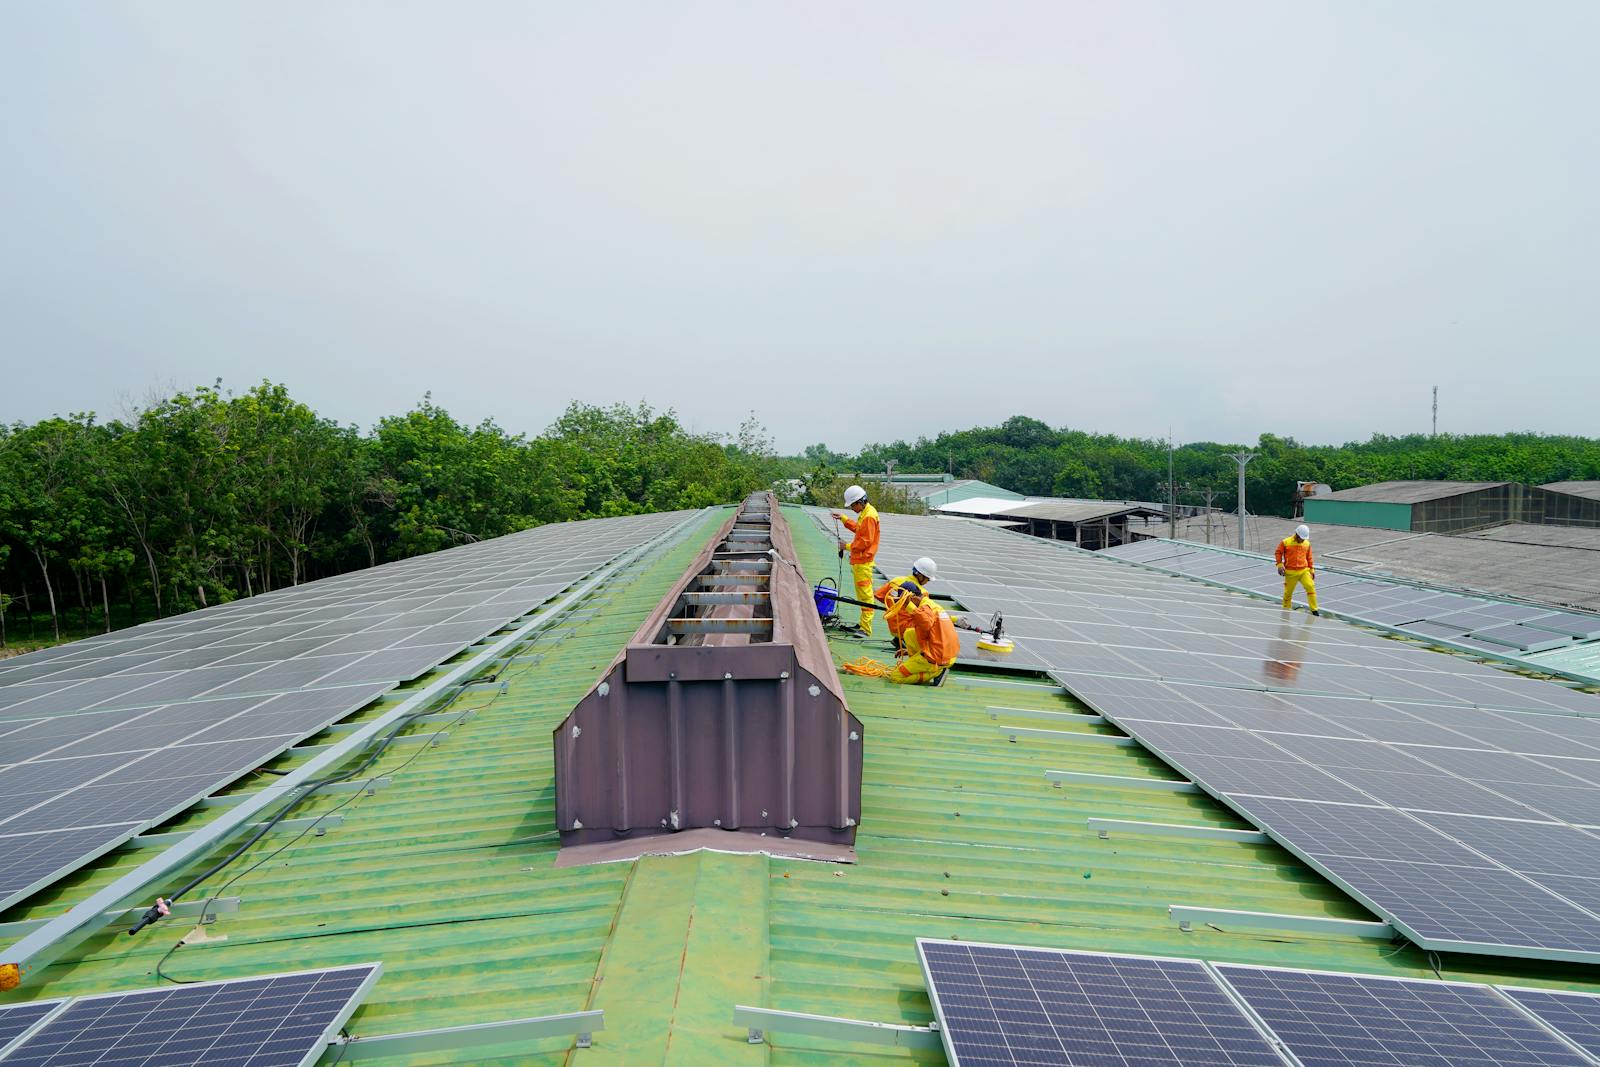
- LEED buildings per capita: 50.3 per 10,000 residents
- LEED buildings total: 311
- Total population: 61,788
7. Round Rock, TX
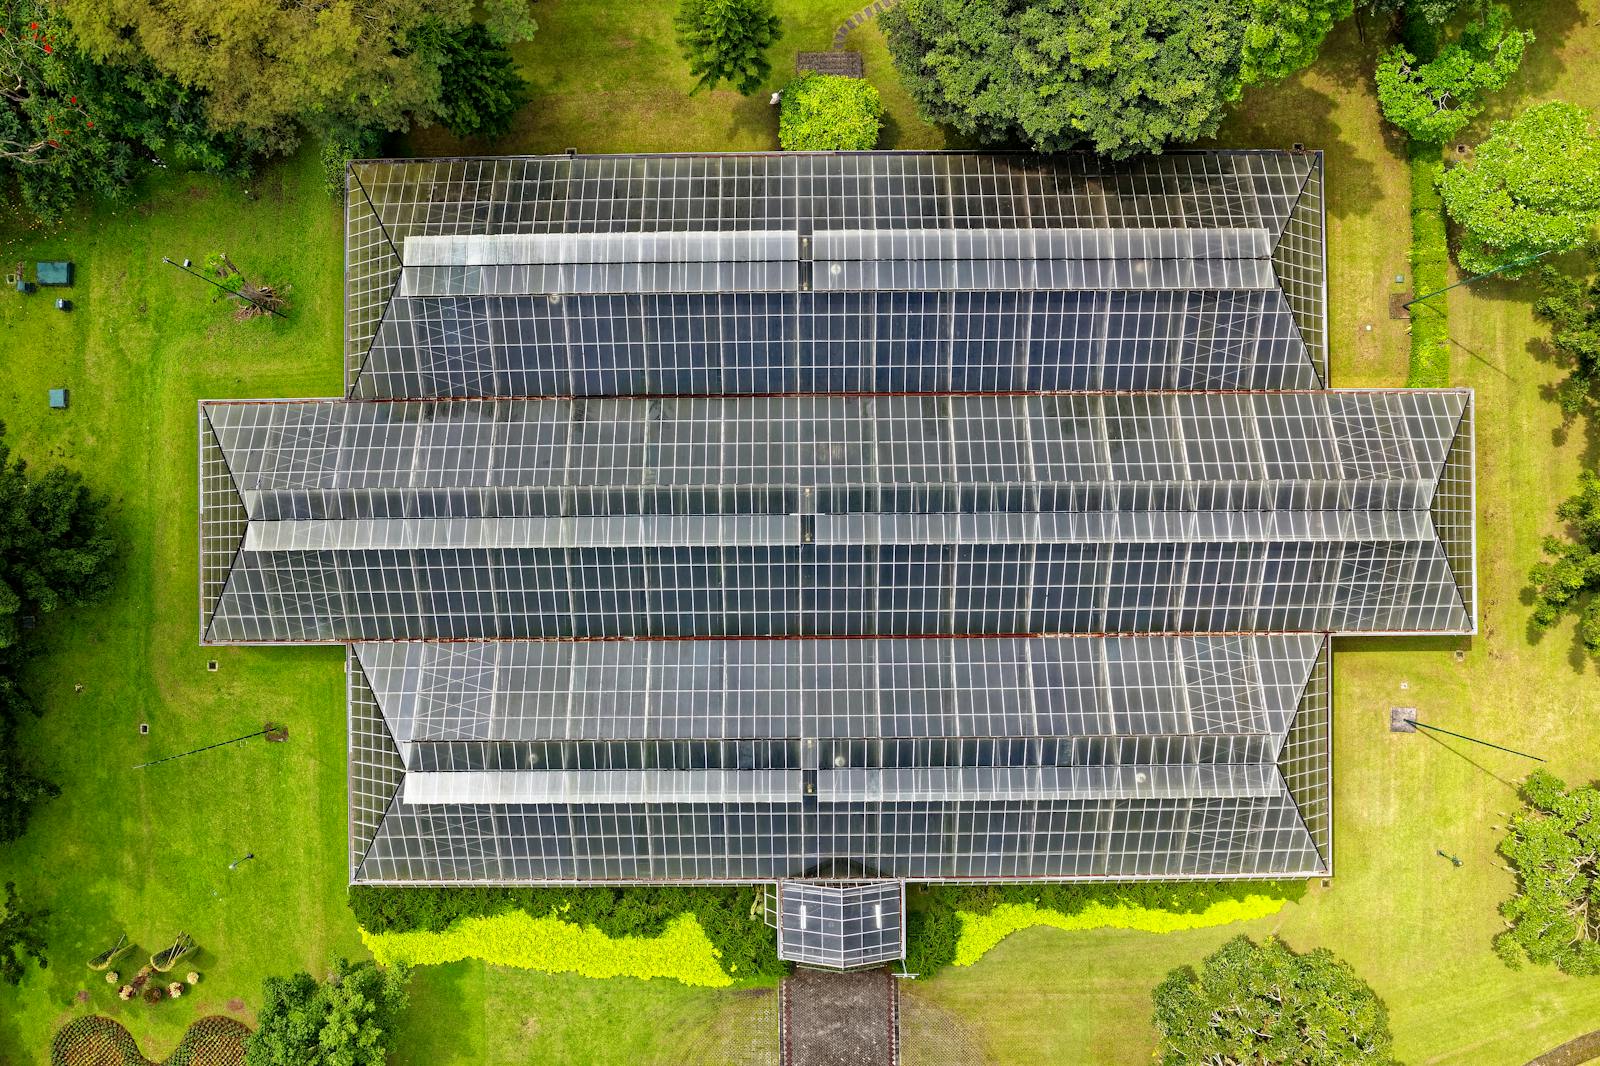
- LEED buildings per capita: 53.6 per 10,000 residents
- LEED buildings total: 646
- Total population: 120,465
6. Pflugerville, TX

- LEED buildings per capita: 57.2 per 10,000 residents
- LEED buildings total: 369
- Total population: 64,528
5. Georgetown, TX

- LEED buildings per capita: 59.2 per 10,000 residents
- LEED buildings total: 425
- Total population: 71,788
4. Bradenton, FL
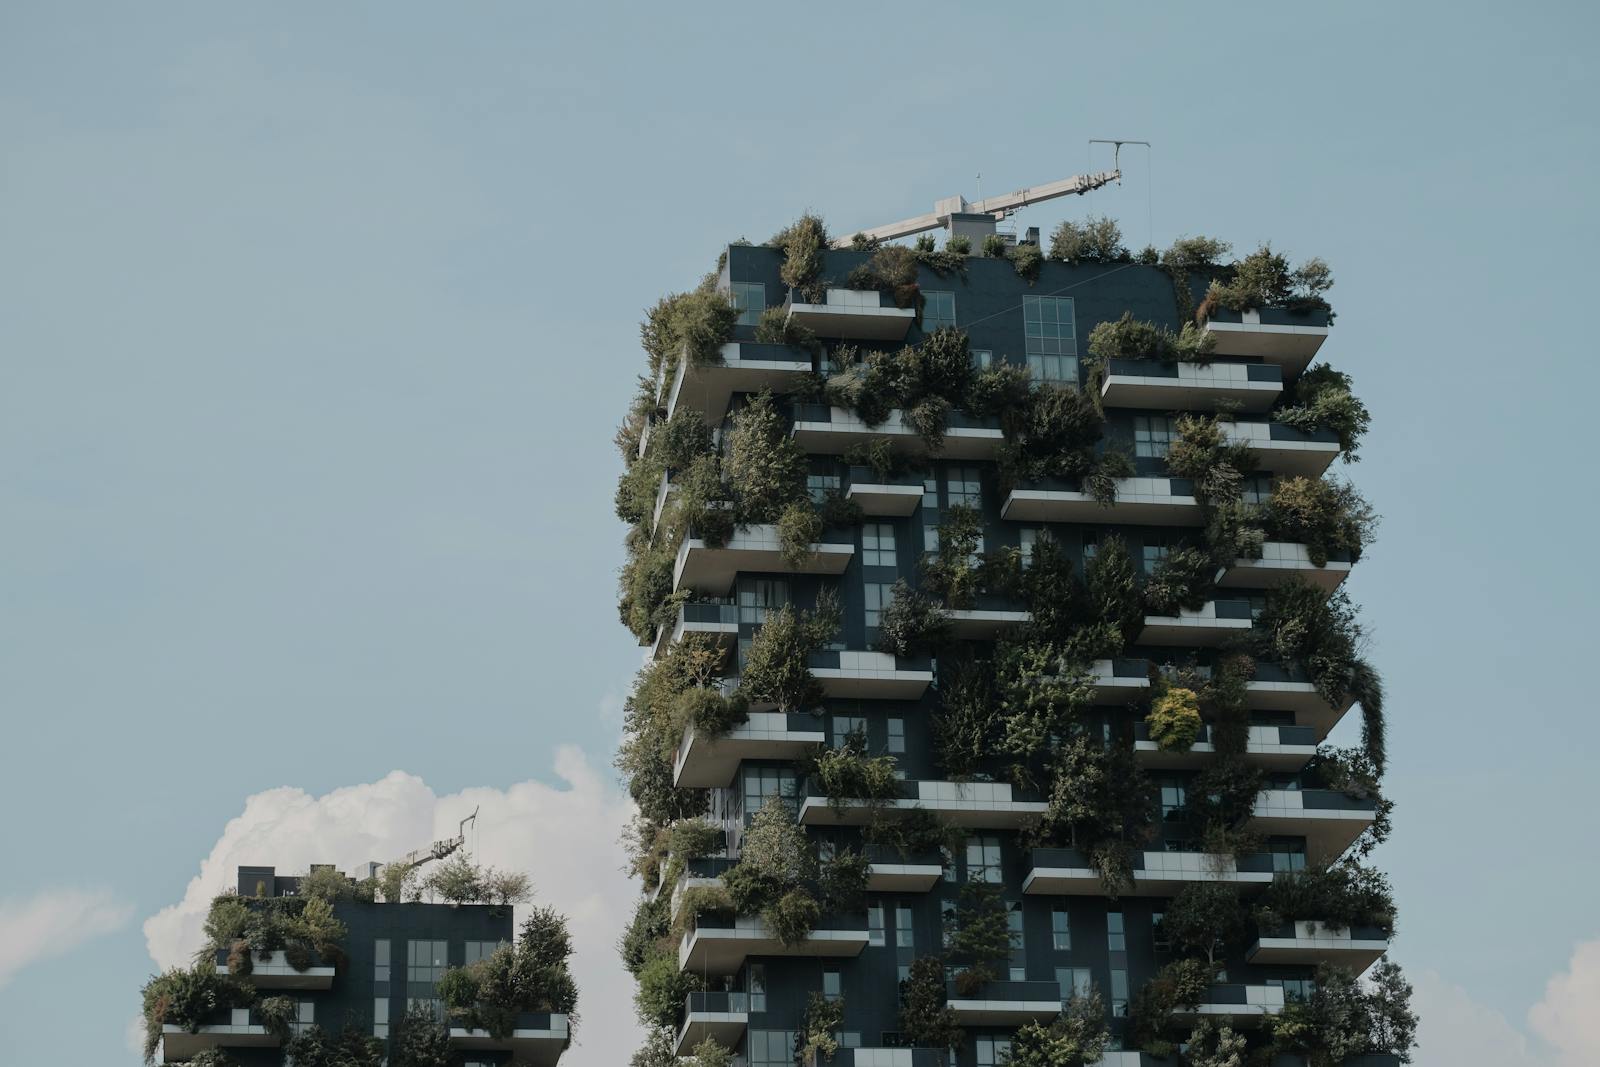
- LEED buildings per capita: 59.9 per 10,000 residents
- LEED buildings total: 334
- Total population: 55,795
3. Leander, TX

- LEED buildings per capita: 78.3 per 10,000 residents
- LEED buildings total: 489
- Total population: 62,491
2. Santa Fe, NM
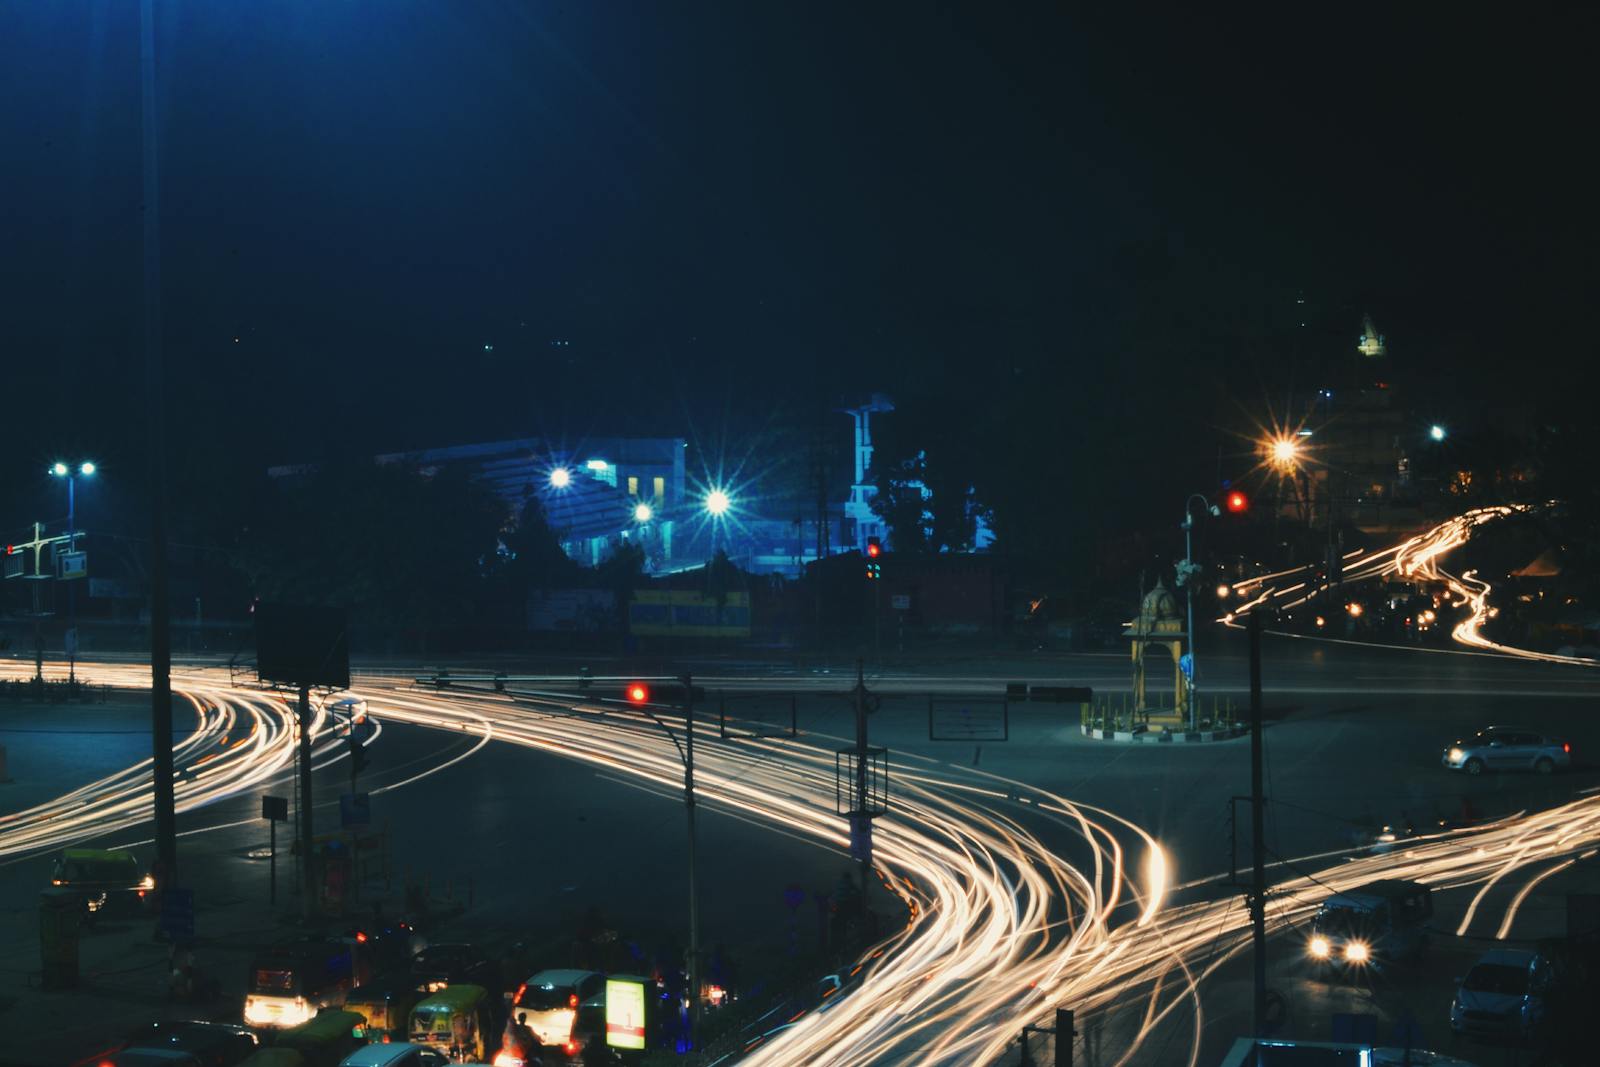
- LEED buildings per capita: 80.6 per 10,000 residents
- LEED buildings total: 706
- Total population: 87,617
1. Princeton, NJ
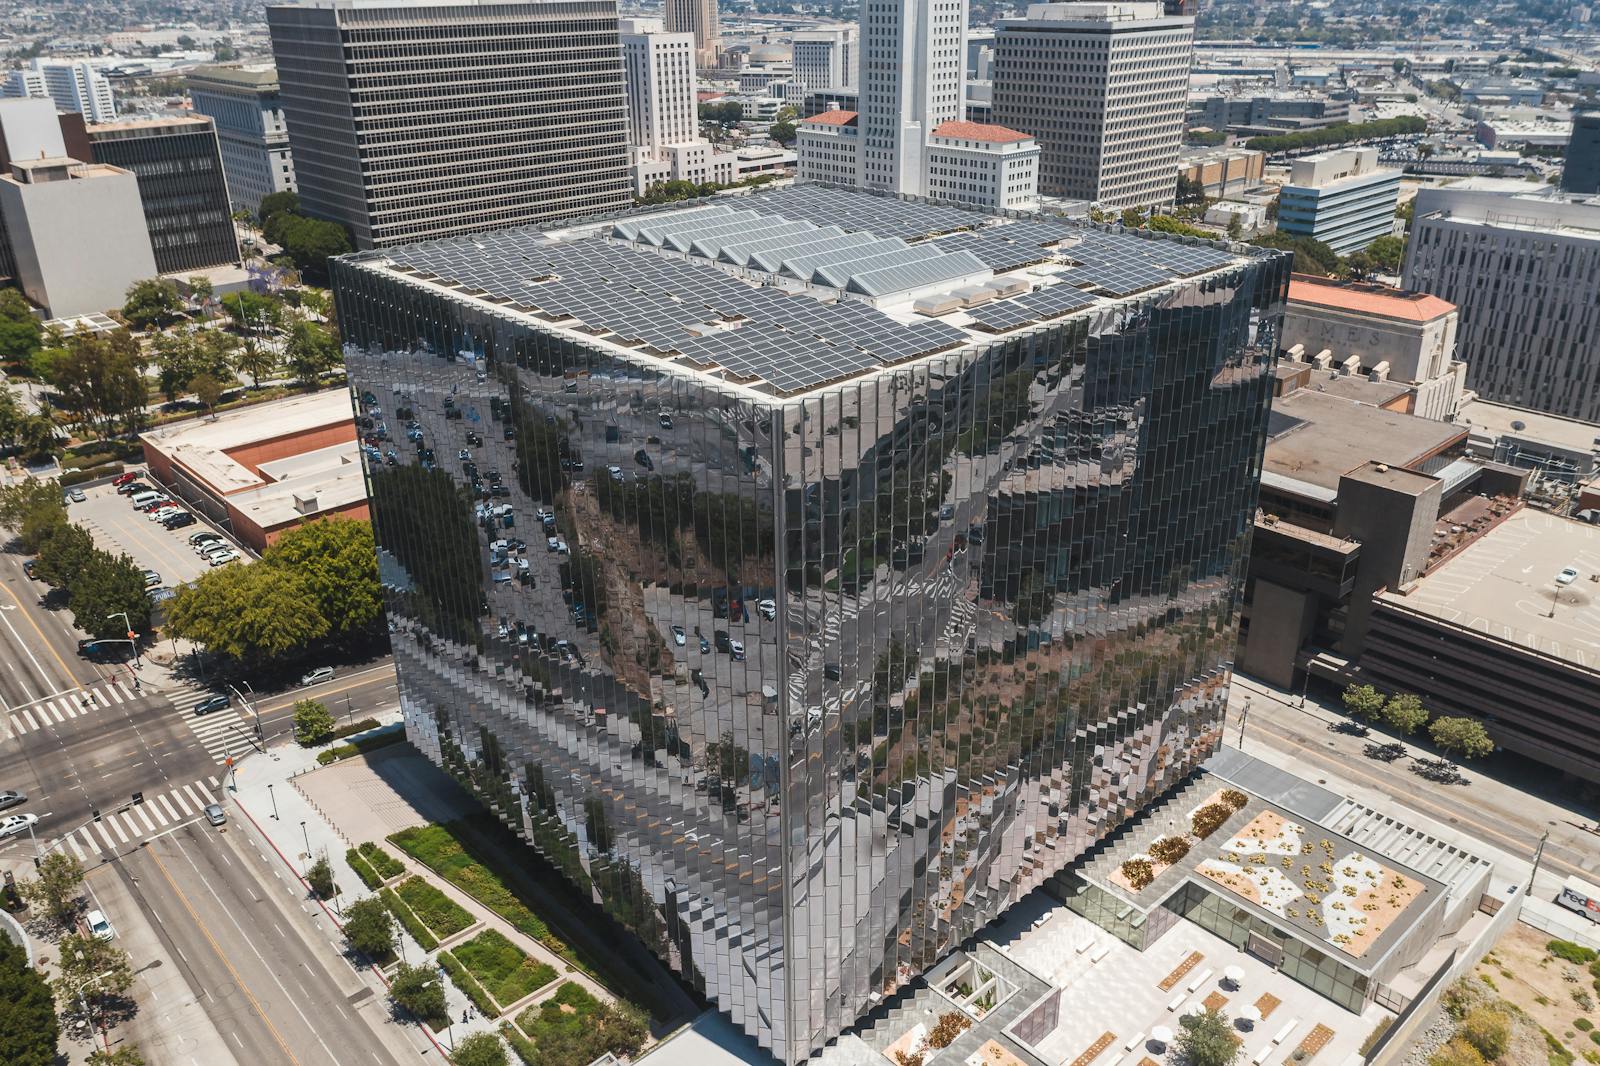
- LEED buildings per capita: 123.8 per 10,000 residents
- LEED buildings total: 377
- Total population: 30,450
More from ClimateCrisis 247
- States Where the Government is Underestimating Flood Risk
- With the Passage of Trump’s Bill, These Teslas and Other EVs Will Lose Their $7,500 Tax Credit
- American Cities Where Summer Temperatures Are Projected to Surge
- The Cities Where Heat Risk Will Be Highest This Week
