States Going All In on Clean Energy
Among all conceivable consequences of climate change, the most dire will not likely be realized for decades. These potential developments include, but are not limited to, sea level rise, disruptions to agriculture and food production, ecological devastation, and regular extreme weather events. Such outcomes could have devastating social and economic impacts, and each are inextricably linked to Earth’s warming atmosphere.
Every year since 2015 now ranks among the hottest 11-years on record, according to the World Meteorological Organization. Additionally, a recent report from NASA found that global temperatures may now be rising 10 times faster than they have on average in similar stages of our current ice age cycle. The same report concluded that this accelerated warming trend is largely due to reliance on fossil fuels to generate energy – a process that releases carbon dioxide and other heat-trapping greenhouse gasses in the atmosphere.
The United States consumes more electricity than any country in the world besides China, and meeting the nation’s energy demands while simultaneously reducing greenhouse gas emissions has proved challenging. Over the last decade, the U.S. energy mix has grown increasingly reliant on natural gas – a fossil fuel with environmentally harmful byproducts. The amount of energy generated in natural gas fired power plants surged by 31% between 2016 and 2025, as the share of domestic energy production derived from natural gas climbed from 34% to 41%, according to the Energy Information Administration.
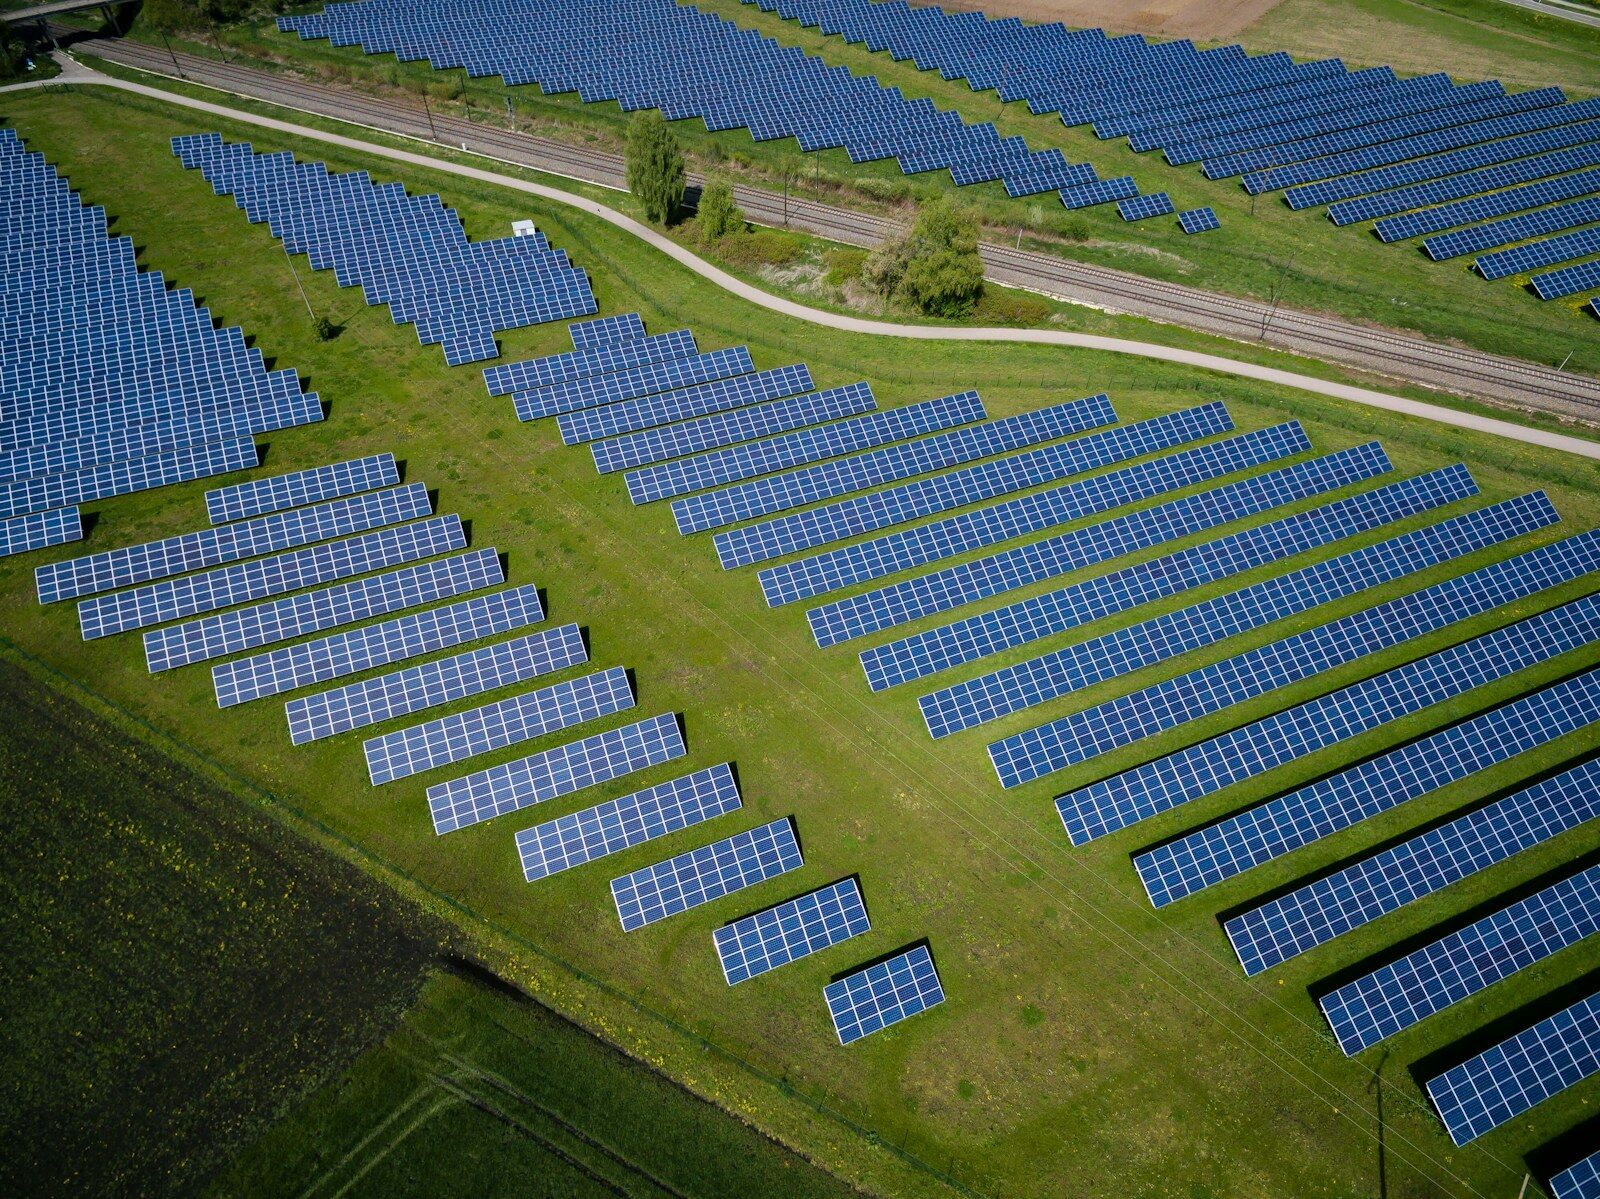
Other developments have been more encouraging, however. The use of coal, which produces nearly twice as much carbon dioxide as natural gas, has come down substantially in the U.S. in recent years. The amount of energy generated in coal-burning power plants fell by 41% between 2016 and 2025. Over the same period, use of clean, renewable energy sources, such as wind and solar, has surged. According to a recent report from Climate Central, the U.S. generated enough wind and solar electricity in 2025 to power 79 million typical American households – more than three times the amount generated in 2016.
Using data from Climate Central, Climate Crisis 247 identified the states going all-in on clean, renewable energy. States are ranked on the share of electricity generated by wind and solar. All data in this story is from the EIA and all calculations were made by Climate Central. Only the 10 states deriving the largest share of their electricity from wind and solar are listed.
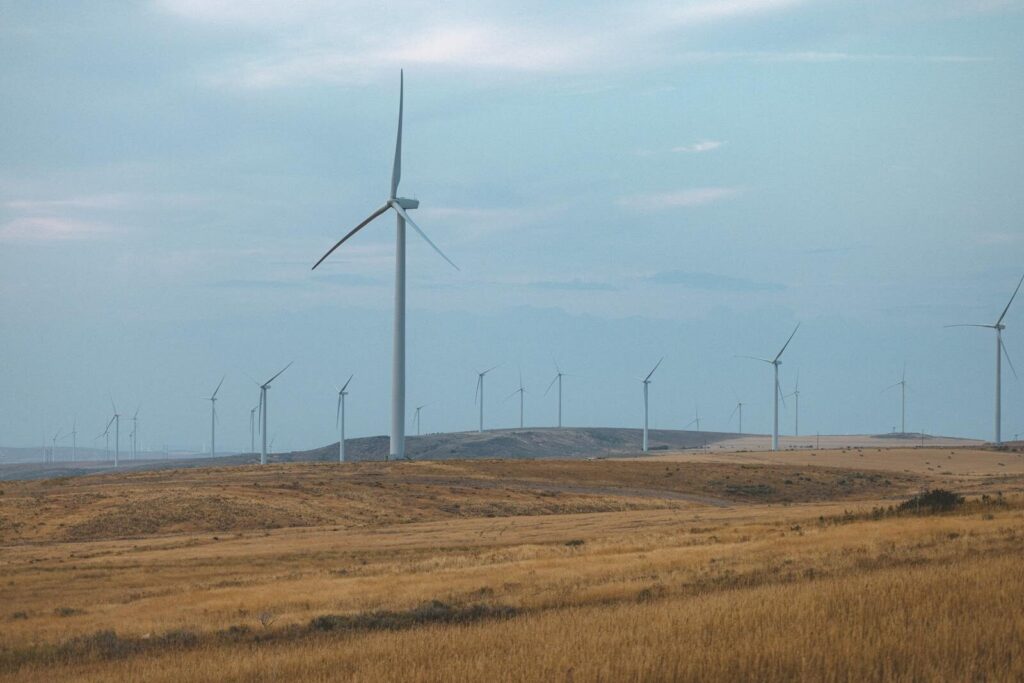
Among these 10 states, the share of electricity produced by wind and solar ranges from about 35% to over 60%. In a majority of these states, the bulk of clean, renewable energy comes from wind turbines, as most are concentrated in the Great Plains, a region that has high average annual wind speeds.
10. Montana
- Share of electricity generated from wind and solar, 2025: 34.8%
- Total electricity generated from wind and solar, 2025: 9,962 GWh (enough to power approx. 923,177 homes)
- Clean energy mix: 95.0% wind, 5.0% solar
- Share of electricity still generated from fossil fuels: 41.2%
9. Maine
- Share of electricity generated from wind and solar, 2025: 35.6%
- Total electricity generated from wind and solar, 2025: 5,765 GWh (enough to power approx. 534,241 homes)
- Clean energy mix: 49.9% wind, 50.1% solar
- Share of electricity still generated from fossil fuels: 35.6%
8. North Dakota
- Share of electricity generated from wind and solar, 2025: 36.2%
- Total electricity generated from wind and solar, 2025: 15,381 GWh (enough to power approx. 1,425,354 homes)
- Clean energy mix: >99.9% wind, <0.1% solar
- Share of electricity still generated from fossil fuels: 58.6%
7. Colorado
- Share of electricity generated from wind and solar, 2025: 42.2%
- Total electricity generated from wind and solar, 2025: 24,937 GWh (enough to power approx. 2,310,907 homes)
- Clean energy mix: 68.6% wind, 31.4% solar
- Share of electricity still generated from fossil fuels: 54.4%
6. Oklahoma
- Share of electricity generated from wind and solar, 2025: 42.8%
- Total electricity generated from wind and solar, 2025: 39,027 GWh (enough to power approx. 3,616,625 homes)
- Clean energy mix: 97.4% wind, 2.6% solar
- Share of electricity still generated from fossil fuels: 55.0%
5. California
- Share of electricity generated from wind and solar, 2025: 44.2%
- Total electricity generated from wind and solar, 2025: 106,360 GWh (enough to power approx. 9,856,362 homes)
- Clean energy mix: 15.3% wind, 84.7% solar
- Share of electricity still generated from fossil fuels: 31.1%
4. Kansas
- Share of electricity generated from wind and solar, 2025: 48.0%
- Total electricity generated from wind and solar, 2025: 30,316 GWh (enough to power approx. 2,809,378 homes)
- Clean energy mix: 97.8% wind, 2.2% solar
- Share of electricity still generated from fossil fuels: 37.2%
3. New Mexico
- Share of electricity generated from wind and solar, 2025: 52.9%
- Total electricity generated from wind and solar, 2025: 21,160 GWh (enough to power approx. 1,960,893 homes)
- Clean energy mix: 67.2% wind, 32.8% solar
- Share of electricity still generated from fossil fuels: 46.7%
2. South Dakota
- Share of electricity generated from wind and solar, 2025: 59.1%
- Total electricity generated from wind and solar, 2025: 13,128 GWh (enough to power approx. 1,216,569 homes)
- Clean energy mix: 96.6% wind, 3.4% solar
- Share of electricity still generated from fossil fuels: 18.8%
1. Iowa
- Share of electricity generated from wind and solar, 2025: 61.0%
- Total electricity generated from wind and solar, 2025: 45,589 GWh (enough to power approx. 4,224,724 homes)
- Clean energy mix: 95.9% wind, 4.1% solar
- Share of electricity still generated from fossil fuels: 37.3%


