From Texas to Ohio, Climate Change Fuels More Intense Downpours in These US Cities
 https://climate-crisis-247-bucket.nyc3.cdn.digitaloceanspaces.com/wp-content/uploads/2025/04/07225417/10963723-150x150.jpeg
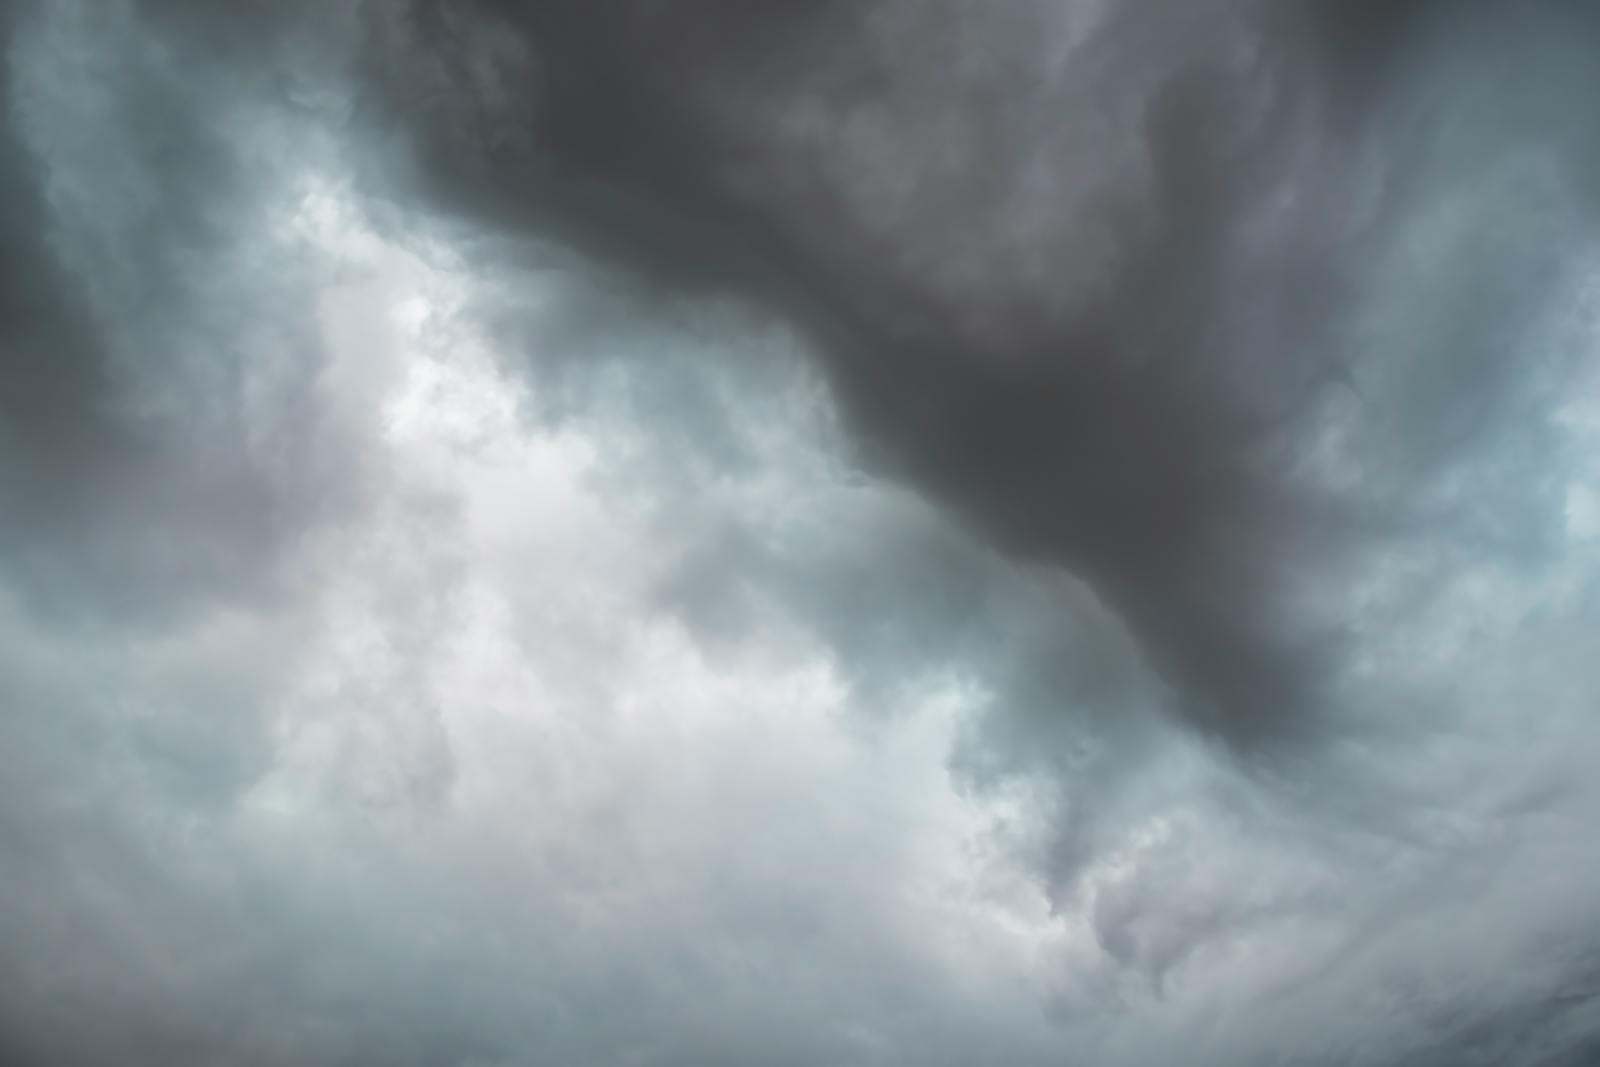
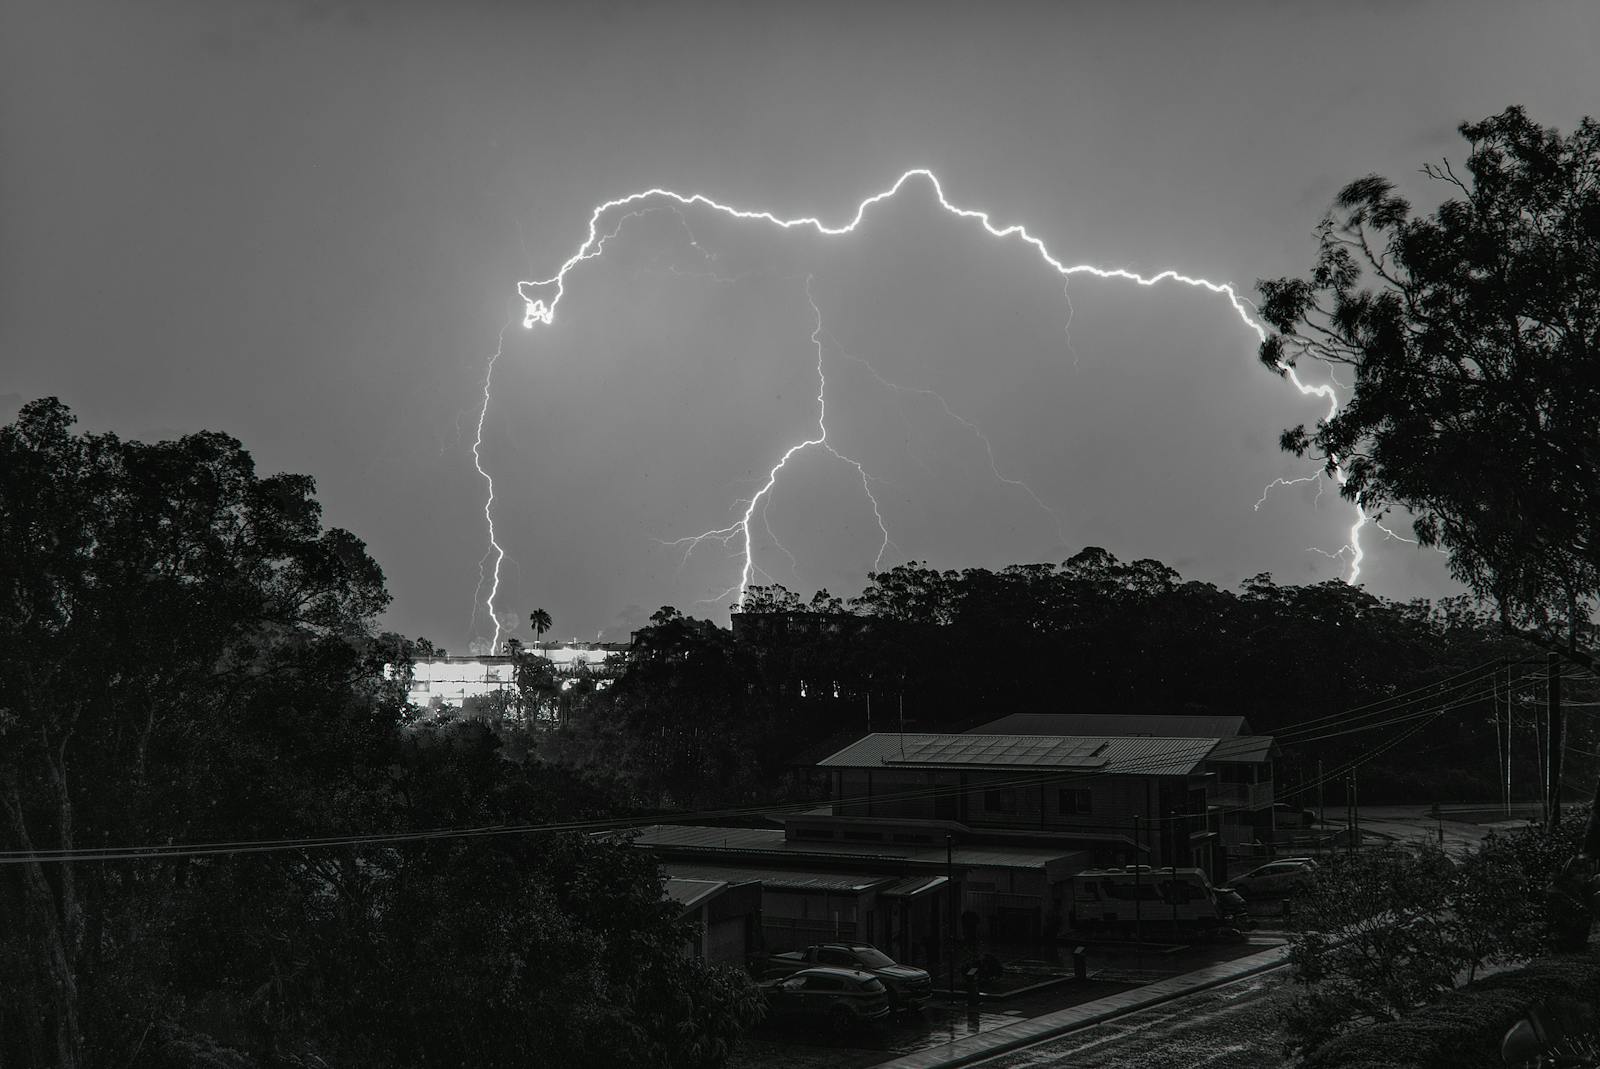
According to the Fifth National Climate Assessment of the U.S. government, rainfall events have become more intense over the past six decades. As temperatures rise, increasingly warm air can hold increasingly more moisture, leading to heavier downpours and severe precipitation events. For every 1°F of warming, air holds 4% more moisture – upping the risk of intense, rapid onset storms and flash flooding.
DOGE backlash? The Federal Departments Americans Want To Keep
Dying for air? Climate Activism Is Turning Deadly In These Cities
In a new analysis, Climate Central measured how climate change has coincided with increased rainfall in cities across the United States. Of the 144 locations analyzed, 126 experienced an increase in hourly rainfall intensity since 1970. Rainfall increased by 15% on average, with the largest increases in the Upper Midwest, Northern Rockies, and Ohio Valley. A closer look at the data reveals the cities where rainfall is increasing the most, and where extreme precipitation could intensify flash flooding and other extreme weather events.
To determine the cities where climate change is contributing to more rainfall, Climate Crisis 247 reviewed data on rainfall density from Climate Central. Cities were ranked based on the change in the simple hourly rainfall intensity index from 1970 to 2024. The simple hourly rainfall intensity index is defined as total annual rainfall divided by the total hours of rainfall each year, or inches of rainfall per hour. Data was calculated across 144 U.S. weather stations with sufficient data quality using data from the National Centers for Environmental Information and the Applied Climate Information System.
15. Huntington, WV

- Percent change in hourly rainfall density, 1970-2024: +26.8%
- Climate region: Ohio Valley
14. Binghamton, NY
- Percent change in hourly rainfall density, 1970-2024: +27.2%
- Climate region: Northeast
13. Norfolk, VA

- Percent change in hourly rainfall density, 1970-2024: +27.4%
- Climate region: Southeast
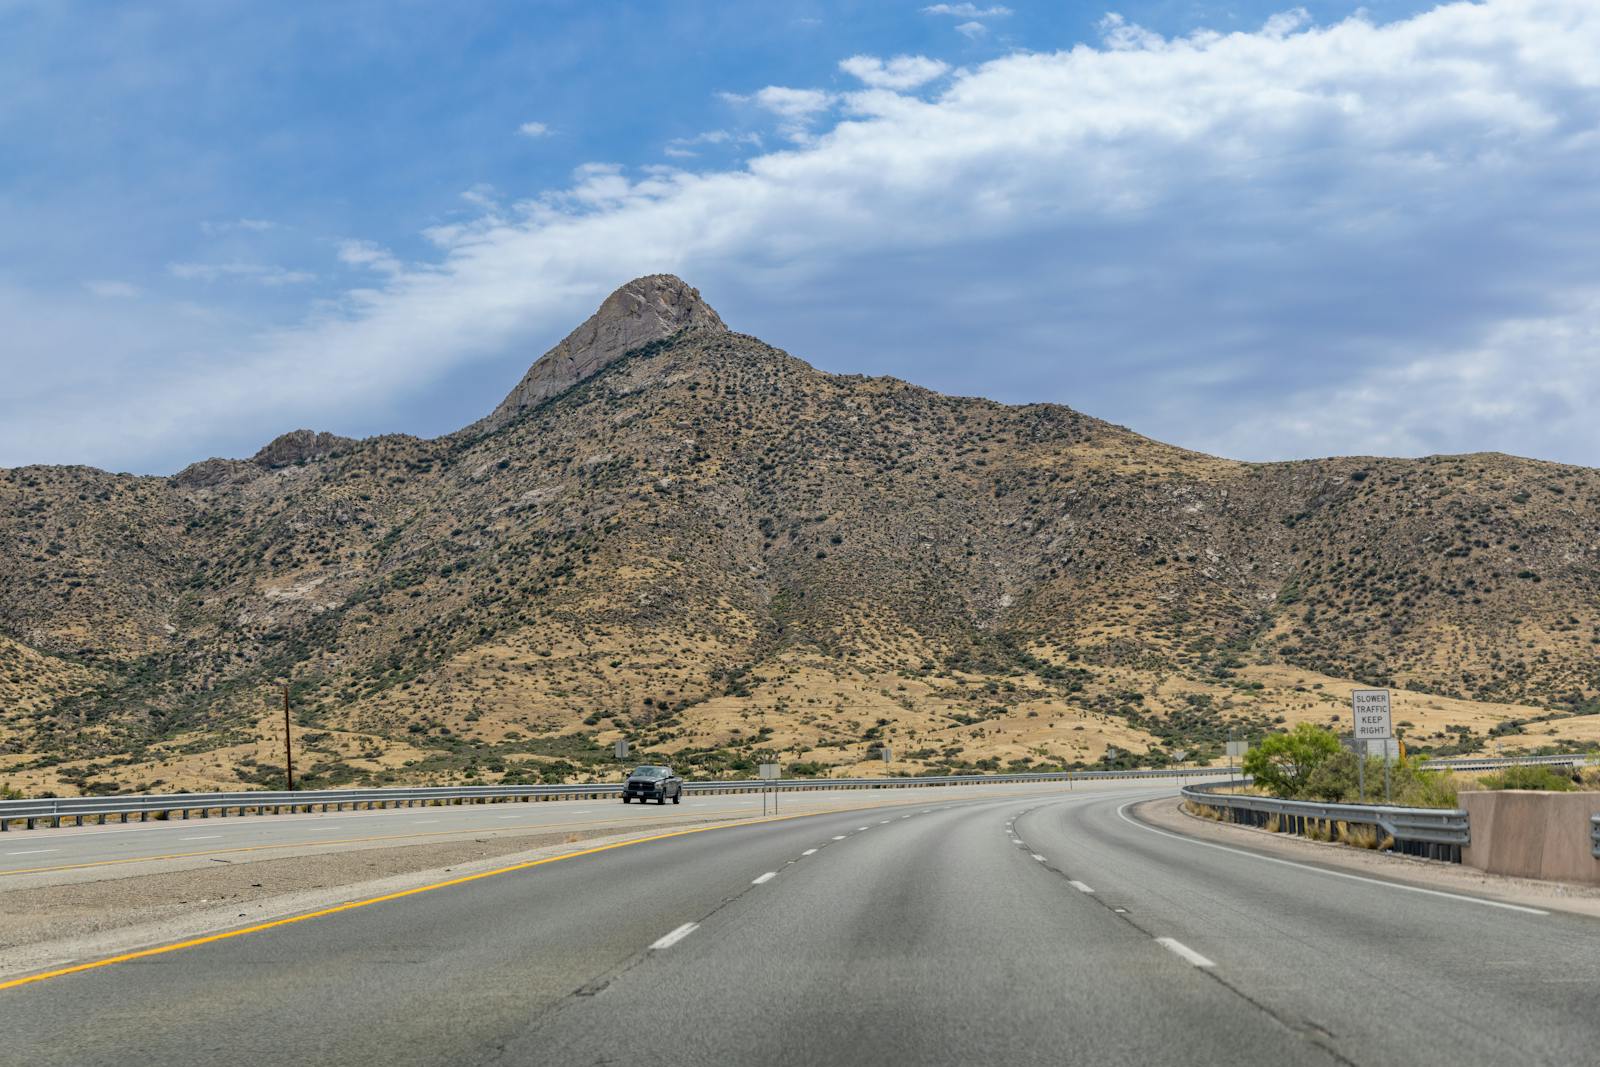
12. Tucson, AZ
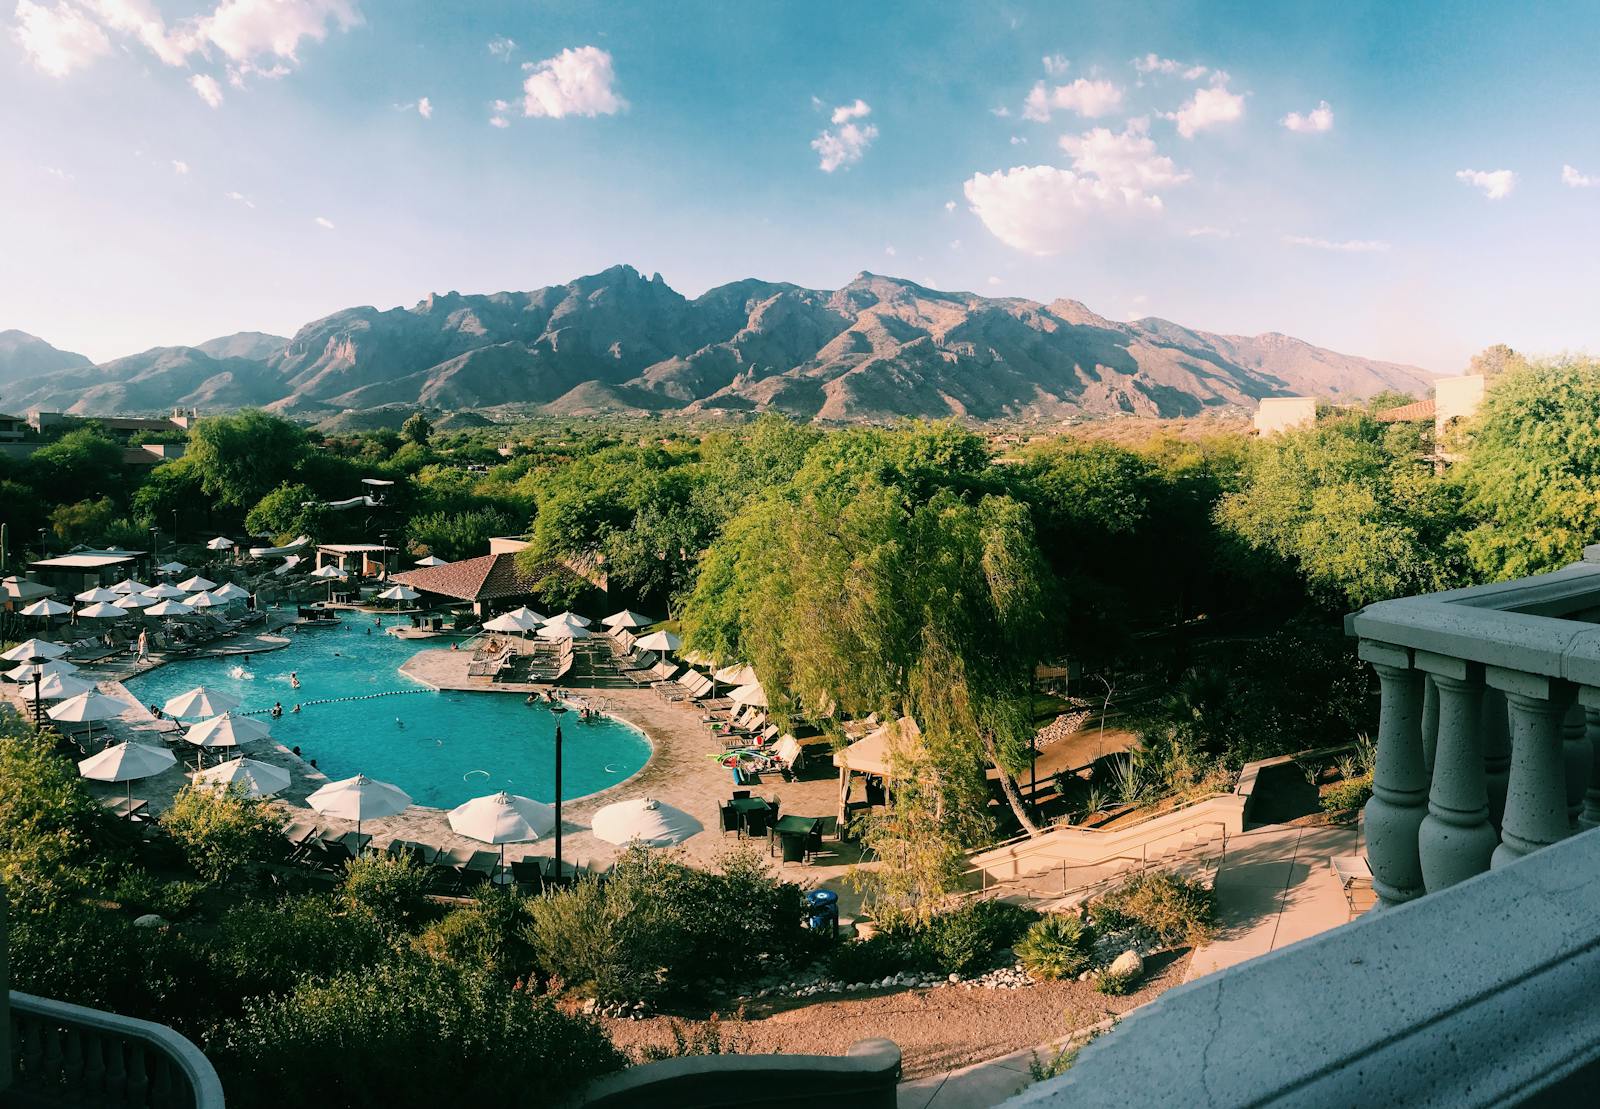
- Percent change in hourly rainfall density, 1970-2024: +27.9%
- Climate region: Southwest
11. Pittsburgh, PA
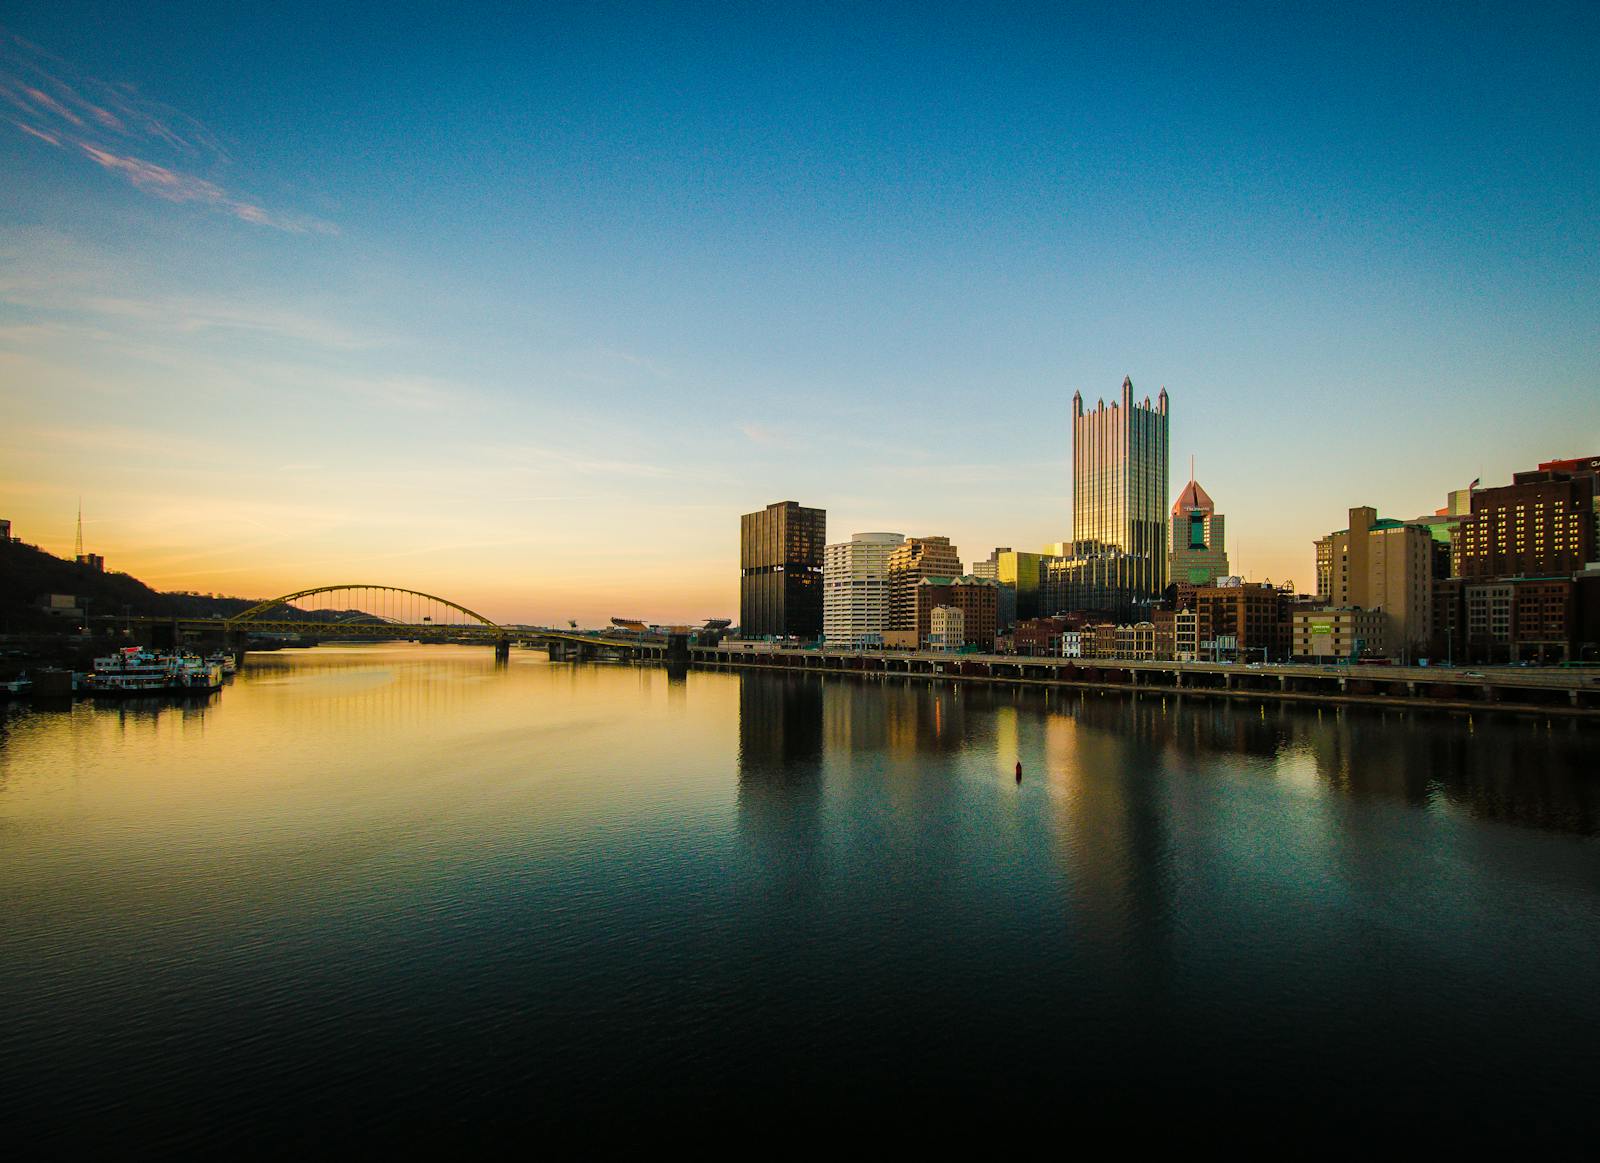
- Percent change in hourly rainfall density, 1970-2024: +27.9%
- Climate region: Northeast
10. Toledo, OH

- Percent change in hourly rainfall density, 1970-2024: +28.2%
- Climate region: Ohio Valley
9. San Angelo, TX
- Percent change in hourly rainfall density, 1970-2024: +29.0%
- Climate region: South
8. Sioux City, IA
- Percent change in hourly rainfall density, 1970-2024: +29.0%
- Climate region: Upper Midwest
7. North Platte, NE
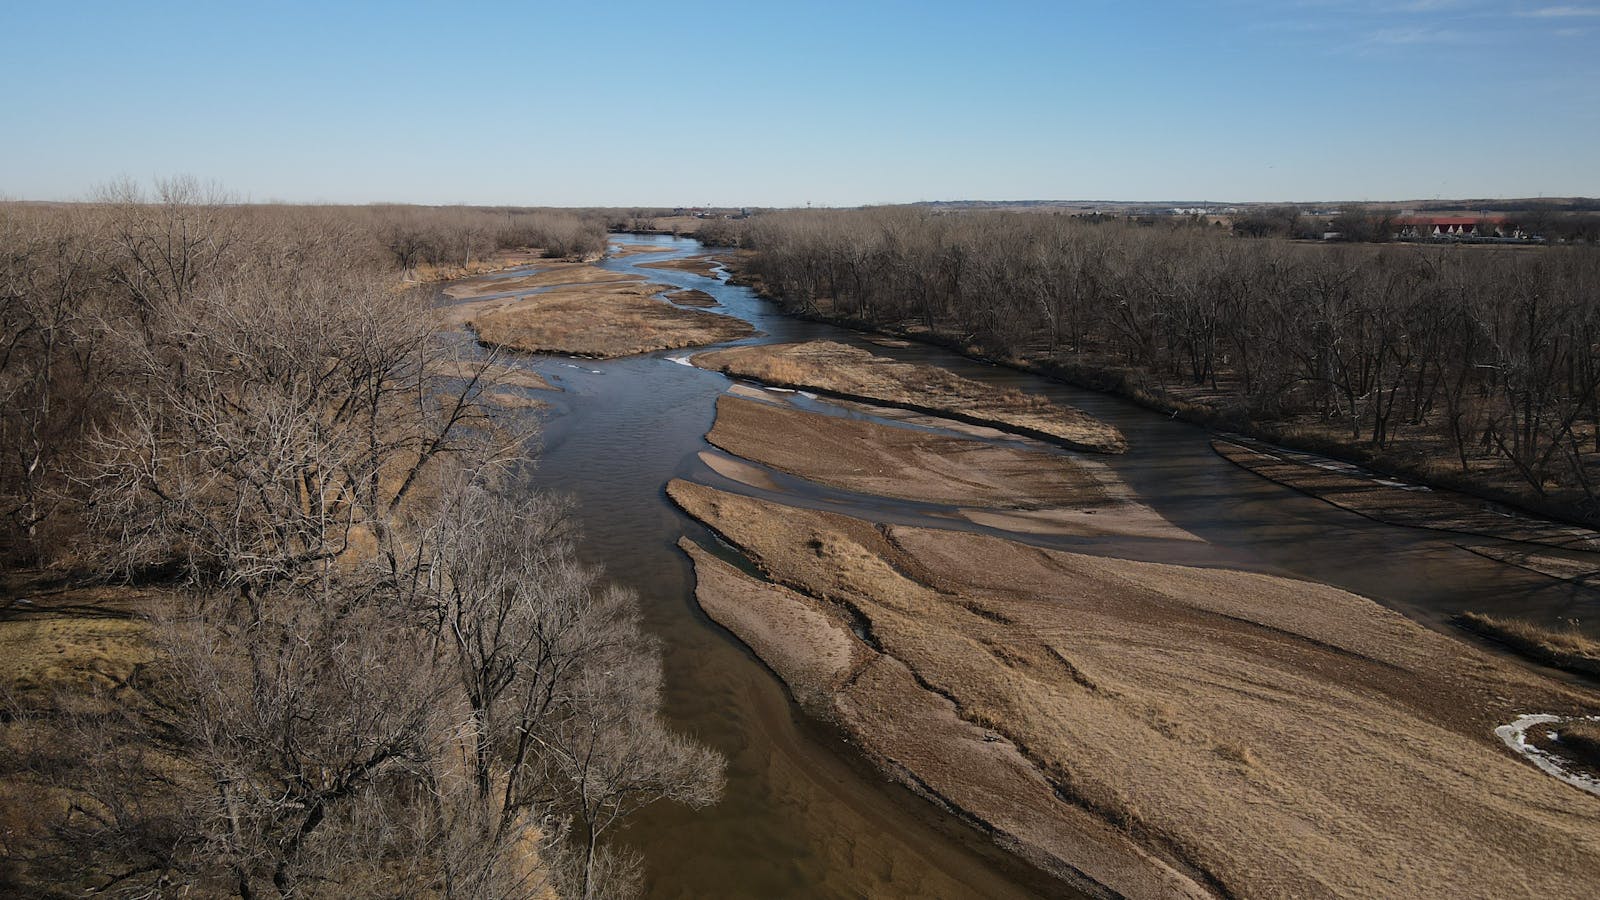
- Percent change in hourly rainfall density, 1970-2024: +30.0%
- Climate region: Northern Rockies & Plains
6. Bismarck, ND

- Percent change in hourly rainfall density, 1970-2024: +30.0%
- Climate region: Northern Rockies & Plains
5. Sioux Falls, SD
- Percent change in hourly rainfall density, 1970-2024: +31.1%
- Climate region: Northern Rockies & Plains
4. El Paso, TX
- Percent change in hourly rainfall density, 1970-2024: +36.5%
- Climate region: South
3. Fairbanks, AK
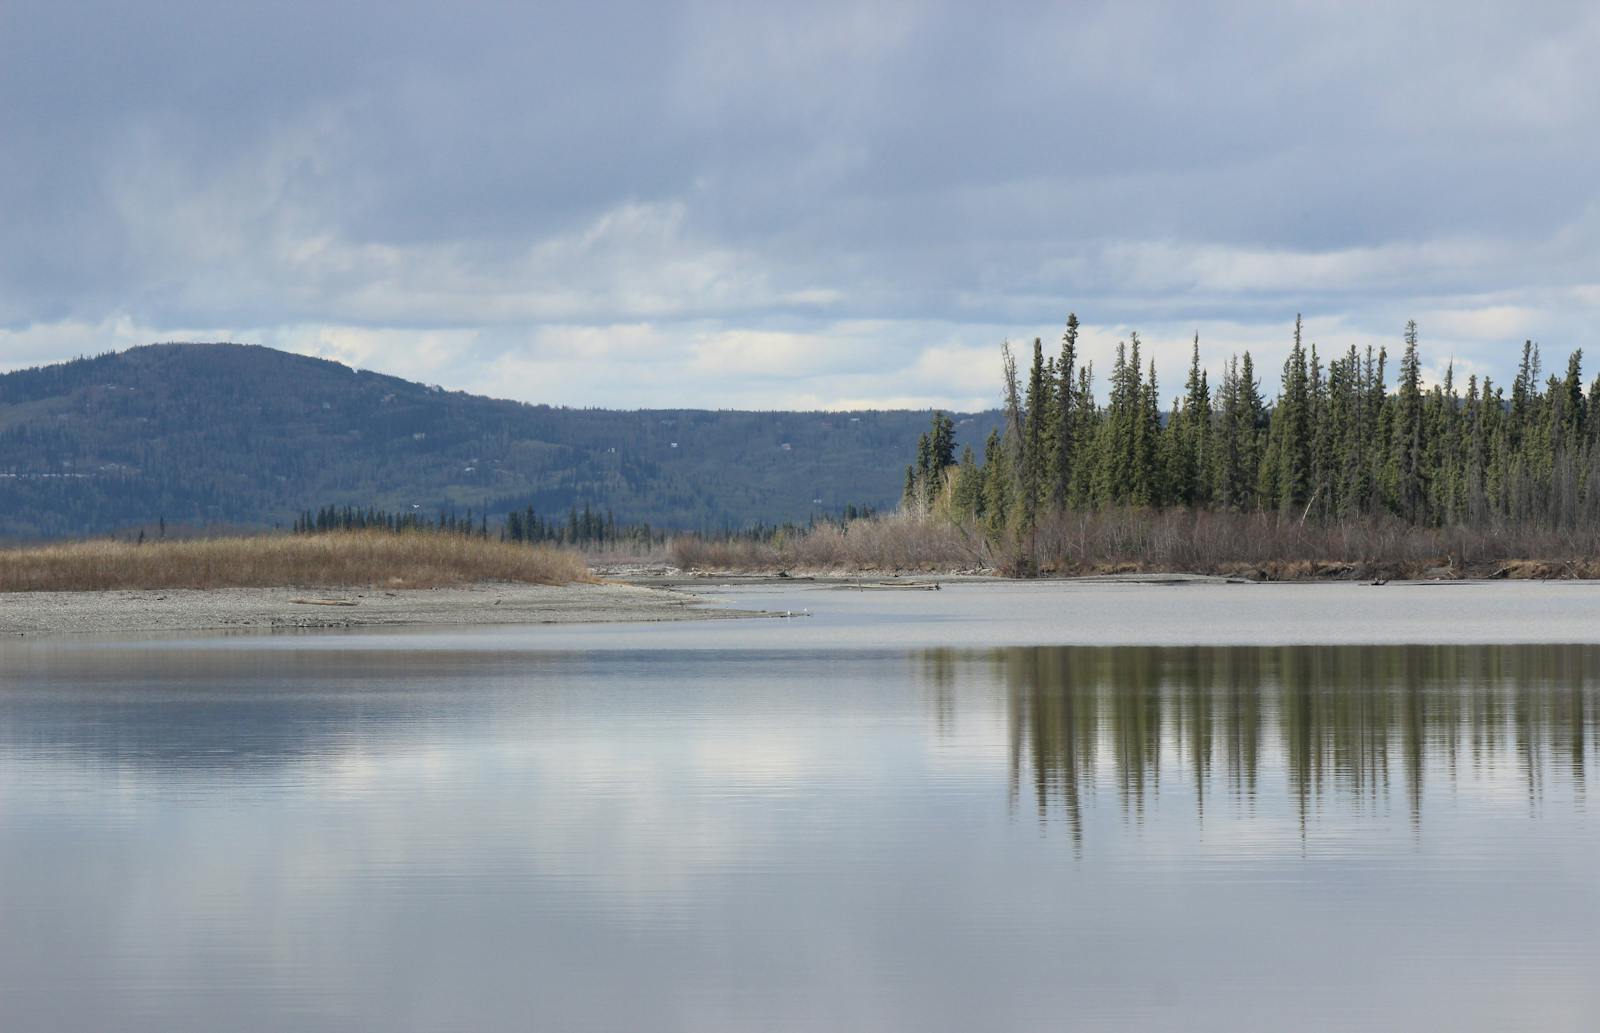
- Percent change in hourly rainfall density, 1970-2024: +36.8%
- Climate region: Northwest
2. Reno, NV

- Percent change in hourly rainfall density, 1970-2024: +37.0%
- Climate region: West
1. Wichita, KS
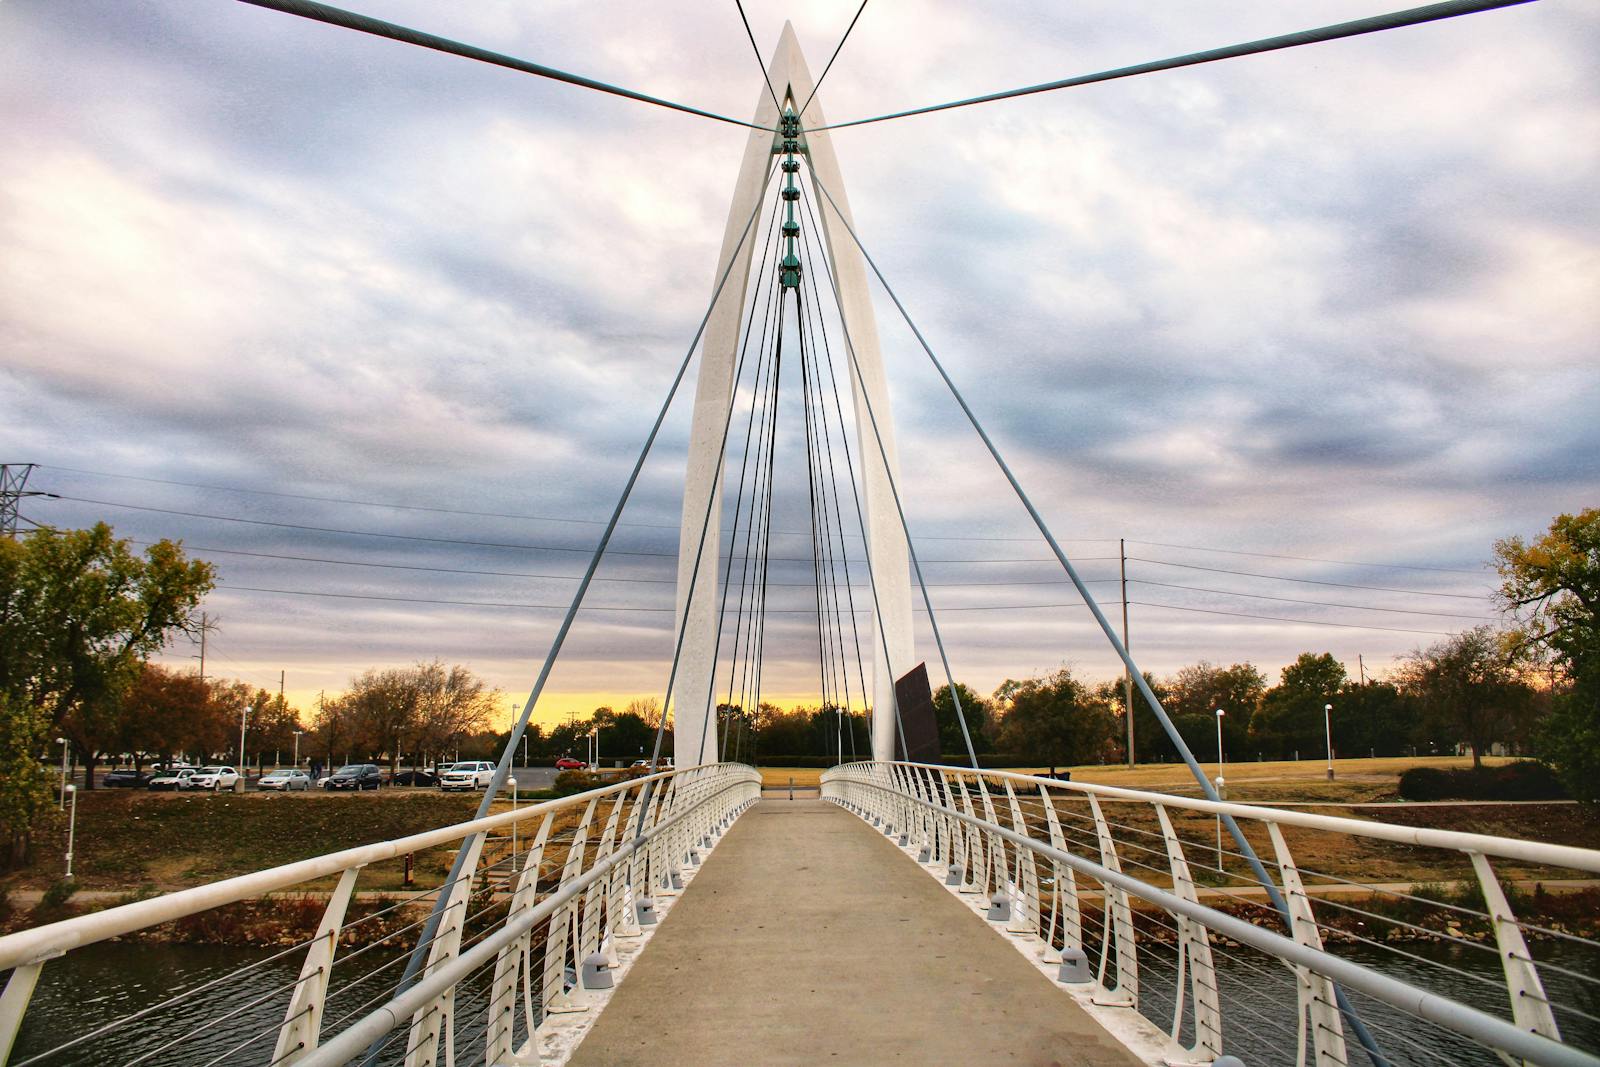
- Percent change in hourly rainfall density, 1970-2024: +38.4%
- Climate region: South
Sponsor
Find a Vetted Financial Advisor
- Finding a fiduciary financial advisor doesn't have to be hard. SmartAsset's free tool matches you with up to 3 financial advisors that serve your area in 5 minutes.
- Each advisor has been vetted by SmartAsset and is held to a fiduciary standard to act in your best interests. Get on the path toward achieving your financial goals!