Do You Live In “Hail Alley?” The Counties Where Hail Is the Most Common
 https://climate-crisis-247-bucket.nyc3.cdn.digitaloceanspaces.com/wp-content/uploads/2025/05/07222055/Number-of-hail-events-1950-2024-150x150.png
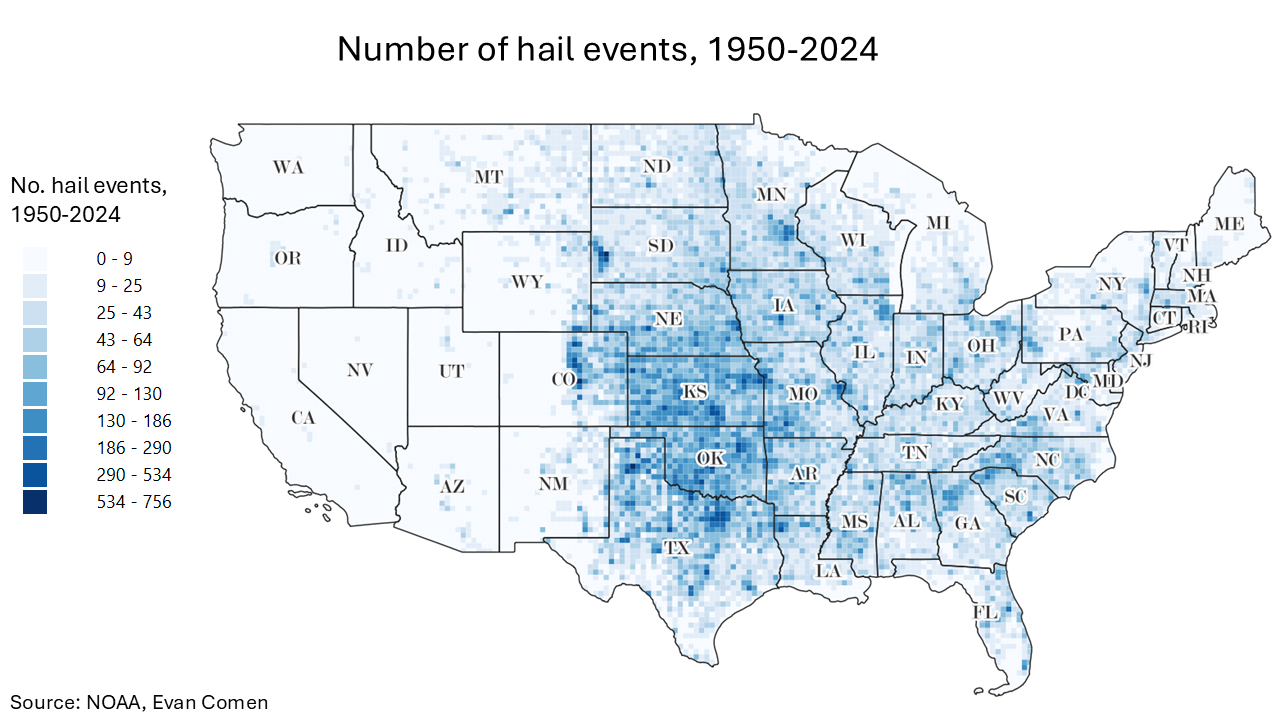
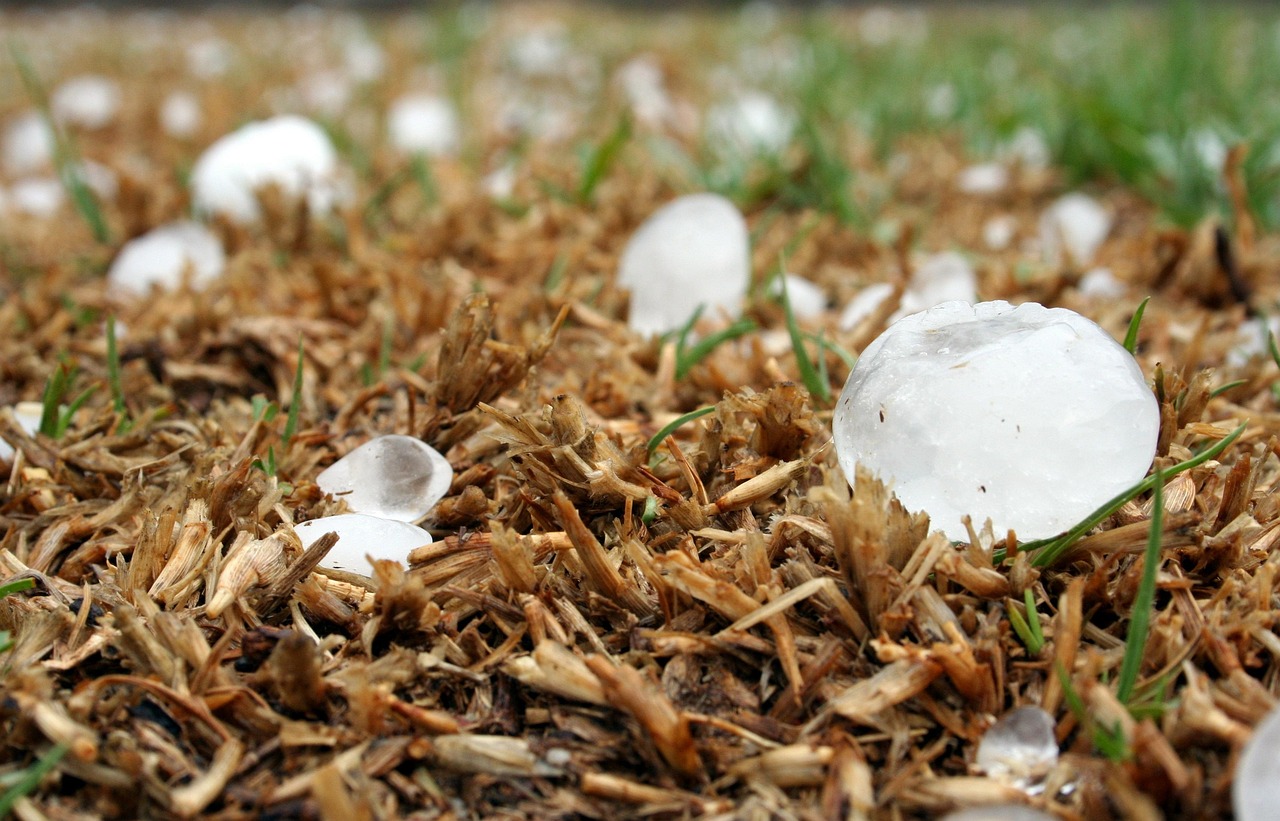
Each spring and summer, hailstorms pound large swaths of the United States, causing billions in damage to cars, rooftops, and crops. But not all parts of the country are hit equally. A zone nicknamed "hail alley" stretching from eastern Colorado through western Kansas, Nebraska, and into parts of Texas and Oklahoma experiences more hailstorms than anywhere else in the nation. In some of these areas, hail falls 7 to 9 days a year on average, far above the national norm.
Tesla takedown? A Timeline of Tesla Vandalism in the United States
Not in Kansas anymore? Tornado Alley Is Expanding South Into These Cities
The geography and climate of the Great Plains make the region particularly vulnerable. When warm, moist air from the Gulf of Mexico clashes with cold, dry air from the Rockies, it creates the ideal conditions for strong updrafts that can support large hailstones. While dozens of counties in the Northwest and Mid-Atlantic have experienced fewer than 10 hailstorms in the last 75 years, several counties in hail alley have experienced more than 1,000 storms. A closer look at historical data reveals the counties where hail falls most often.
To determine the counties where hail is most common, Climate Crisis 247 reviewed data on historical hail storms from the NOAA. Counties were ranked based on the number of recorded hail storms within their borders from 1950 to 2024. The severity of hailstorms are based on the magnitude, or width, in inches, of recorded hail stones.
25. Wichita County, TX

- No. hail events, 1950-2024: 687 storms
- Worst hail event, 1950-2024: May 22, 2020 storm (5.3-inch stones)
- Total population: 129,842
- County seat: Wichita Falls
24. Reno County, KS
- No. hail events, 1950-2024: 693 storms
- Worst hail event, 1950-2024: May 22, 1995 storm (5.0-inch stones)
- Total population: 61,693
- County seat: Hutchinson
23. Cowley County, KS

- No. hail events, 1950-2024: 700 storms
- Worst hail event, 1950-2024: May 10, 1992 storm (4.5-inch stones)
- Total population: 34,487
- County seat: Winfield
22. Comanche County, OK

- No. hail events, 1950-2024: 729 storms
- Worst hail event, 1950-2024: June 20, 1969 storm (4.0-inch stones)
- Total population: 121,699
- County seat: Lawton
21. Dallas County, TX

- No. hail events, 1950-2024: 751 storms
- Worst hail event, 1950-2024: April 12, 1986 storm (4.5-inch stones)
- Total population: 2,603,816
- County seat: Dallas
20. Cleveland County, OK
- No. hail events, 1950-2024: 753 storms
- Worst hail event, 1950-2024: May 10, 2010 storm (4.6-inch stones)
- Total population: 297,545
- County seat: Norman
19. Denton County, TX

- No. hail events, 1950-2024: 775 storms
- Worst hail event, 1950-2024: June 15, 2023 storm (5.9-inch stones)
- Total population: 945,644
- County seat: Denton
18. Custer County, NE

- No. hail events, 1950-2024: 831 storms
- Worst hail event, 1950-2024: April 24, 1989 storm (4.5-inch stones)
- Total population: 10,544
- County seat: Broken Bow
17. Potter County, TX
- No. hail events, 1950-2024: 833 storms
- Worst hail event, 1950-2024: May 4, 1974 storm (4.5-inch stones)
- Total population: 116,634
- County seat: Amarillo
16. Butler County, KS

- No. hail events, 1950-2024: 838 storms
- Worst hail event, 1950-2024: May 17, 1959 storm (6.0-inch stones)
- Total population: 67,916
- County seat: El Dorado
15. Kit Carson County, CO

- No. hail events, 1950-2024: 839 storms
- Worst hail event, 1950-2024: August 13, 2019 storm (4.8-inch stones)
- Total population: 7,015
- County seat: Burlington
14. Randall County, TX
-
No. hail events, 1950-2024: 867 storms
-
Worst hail event, 1950-2024: May 24, 1996 storm (4.8-inch stones)
-
Total population: 143,791
-
County seat: Canyon
13. Meade County, SD

- No. hail events, 1950-2024: 891 storms
- Worst hail event, 1950-2024: June 26, 1998 storm (4.5-inch stones)
- Total population: 30,297
- County seat: Sturgis
12. Cherry County, NE

- No. hail events, 1950-2024: 908 storms
- Worst hail event, 1950-2024: June 17, 2014 storm (5.0-inch stones)
- Total population: 5,468
- County seat: Valentine
11. Ford County, KS

- No. hail events, 1950-2024: 918 storms
- Worst hail event, 1950-2024: May 24, 2016 storm (5.0-inch stones)
- Total population: 34,133
- County seat: Dodge City
10. Tulsa County, OK

- No. hail events, 1950-2024: 955 storms
- Worst hail event, 1950-2024: May 10, 1963 storm (4.5-inch stones)
- Total population: 673,708
- County seat: Tulsa
9. Yuma County, CO

- No. hail events, 1950-2024: 1,030 storms
- Worst hail event, 1950-2024: August 8, 2023 storm (5.3-inch stones)
- Total population: 9,921
- County seat: Wray
8. Laramie County, WY

- No. hail events, 1950-2024: 1,046 storms
- Worst hail event, 1950-2024: June 8, 1968 storm (5.0-inch stones)
- Total population: 100,661
- County seat: Cheyenne
7. Lincoln County, NE

- No. hail events, 1950-2024: 1,059 storms
- Worst hail event, 1950-2024: June 13, 1996 storm (4.5-inch stones)
- Total population: 34,122
- County seat: North Platte
6. Weld County, CO
- No. hail events, 1950-2024: 1,080 storms
- Worst hail event, 1950-2024: June 4, 1983 storm (4.5-inch stones)
- Total population: 340,711
- County seat: Greeley
5. Oklahoma County, OK

- No. hail events, 1950-2024: 1,153 storms
- Worst hail event, 1950-2024: May 16, 1960 storm (5.0-inch stones)
- Total population: 800,487
- County seat: Oklahoma City
4. Tarrant County, TX

- No. hail events, 1950-2024: 1,234 storms
- Worst hail event, 1950-2024: June 12, 2023 storm (5.0-inch stones)
- Total population: 2,135,743
- County seat: Fort Worth
3. Sedgwick County, KS

- No. hail events, 1950-2024: 1,303 storms
- Worst hail event, 1950-2024: September 15, 2010 storm (7.8-inch stones)
- Total population: 524,810
- County seat: Wichita
2. Pennington County, SD

- No. hail events, 1950-2024: 1,559 storms
- Worst hail event, 1950-2024: August 8, 2020 storm (4.5-inch stones)
- Total population: 112,081
- County seat: Rapid City
1. El Paso County, CO
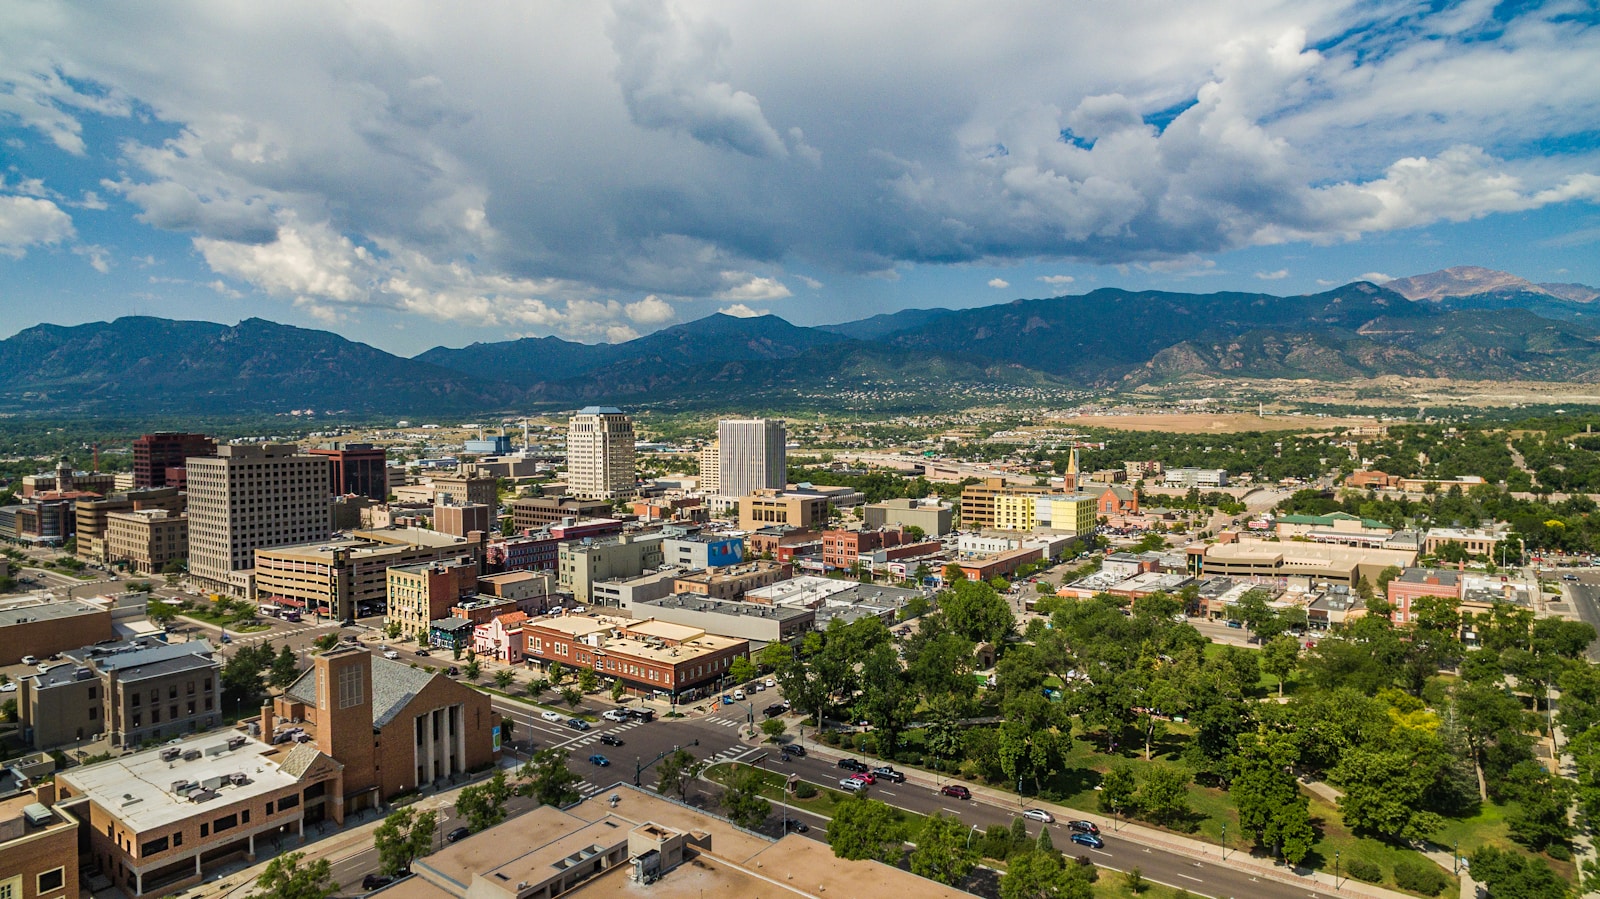
- No. hail events, 1950-2024: 1,794 storms
- Worst hail event, 1950-2024: August 9, 2004 storm (4.5-inch stones)
- Total population: 736,008
- County seat: Colorado Springs