11 US Cities Where Summer Temperatures Have Surged in the Last 50 Years
 https://climate-crisis-247-bucket.nyc3.cdn.digitaloceanspaces.com/wp-content/uploads/2025/07/07212508/5sxph7vqohu-150x150.jpg
Temperatures in the U.S. peak during the meteorological summer, a period that runs from the beginning of June through the end of August. According to the National Oceanic and Atmospheric Administration, summer temperatures averaged about 71.4°F over the course of the 20th century across the continental United States. In yet another sign of continuous atmospheric warming, average summer temperatures across the Lower 48 have exceeded the 20th century average nearly every year since 2001, matching an all-time average high of nearly 74°F as recently as 2021.
Notably, the months of winter, spring, and fall have also undergone meaningful warming trends in recent decades – and above-average temperatures during these seasons will have their own consequences, ecological and otherwise. When it comes to public health, however, hotter summers will have the most immediate and direct implications.
The most common heat-related illnesses include heat cramps and heat exhaustion. More serious health risks include potentially deadly medical emergencies such as heat stroke and impaired respiratory function resulting from heat-related reductions in air quality. Indeed, extreme heat was linked to over 2,300 deaths nationwide in 2023, making it the leading cause of weather-related deaths in the United States.
Currently, forecasting models from the National Weather Service are predicting above-average summer temperatures across the country in 2025. In certain places, these projections stand as the latest indications of the continuation of a longer term trend going back decades.
Using NOAA data, compiled by Climate Central, an independent, non-profit, research organization, Climate Crisis 247 identified the U.S. counties where summer temperatures climbed the most in the last half century. We reviewed the average change in annual summer temperatures, calculated using linear regression, for over 3,200 U.S. counties and county equivalents between 1970 and 2024. Only counties where average temperatures between June and August have climbed by at least 5°F since 1970 were included on this list. All supplemental temperature data is from NOAA, and population data are five-year estimates from the U.S. Census Bureau’s 2023 American Community Survey. Counties are listed in ascending order, based on their average change in annual summer temperatures since 1970.
The counties and independent cities on this list are confined to two states – New Mexico and Texas – and are collectively home to over 675,000 Americans.
11. Chaves County, New Mexico
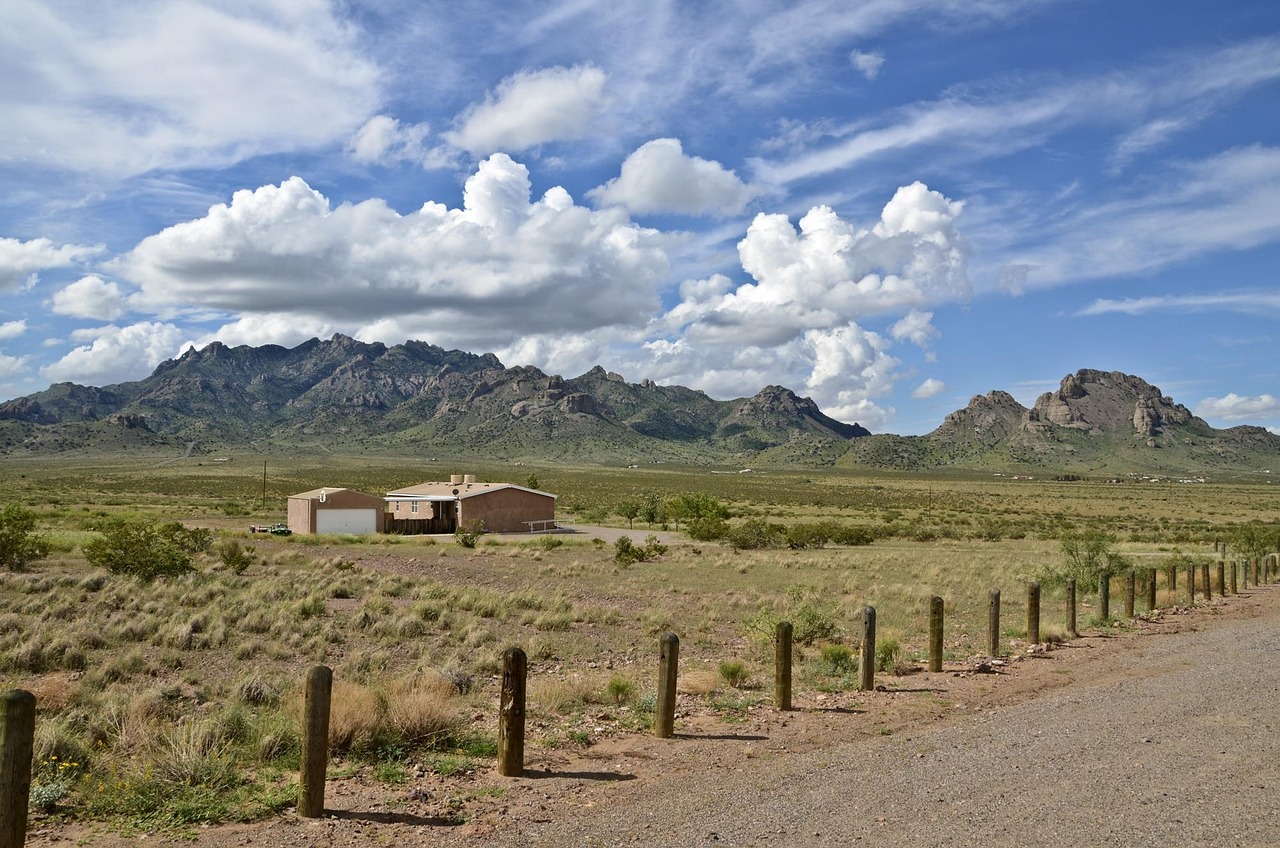
- Change in annual avg. summer temperatures, 1970-2024: +5.0°F
- 20th century, baseline avg. summer temperature: 75.5°F
- Average summer temperature by year: 81.3°F in 2024 (5.8°F warmer than baseline avg.), 75.3°F in 1970 (0.2°F cooler than baseline avg.)
- Hottest summer on record: 2023, 81.9°F avg. temp. (6.4°F warmer than baseline avg.)
- Local population: 64,446
10. Tom Green County, Texas

- Change in annual avg. summer temperatures, 1970-2024: +5.0°F
- 20th century, baseline avg. summer temperature: 81.7°F
- Average summer temperature by year: 85.0°F in 2024 (3.3°F warmer than baseline avg.), 80.1°F in 1970 (1.6°F cooler than baseline avg.)
- Hottest summer on record: 2011, 87.3°F avg. temp. (5.6°F warmer than baseline avg.)
- Local population: 119,398
9. Menard County, Texas

- Change in annual avg. summer temperatures, 1970-2024: +5.1°F
- 20th century, baseline avg. summer temperature: 80.0°F
- Average summer temperature by year: 83.1°F in 2024 (3.1°F warmer than baseline avg.), 78.8°F in 1970 (1.2°F cooler than baseline avg.)
- Hottest summer on record: 2011, 86.0°F avg. temp. (6.0°F warmer than baseline avg.)
- Local population: 1,964
8. Midland County, Texas

- Change in annual avg. summer temperatures, 1970-2024: +5.1°F
- 20th century, baseline avg. summer temperature: 80.9°F
- Average summer temperature by year: 84.6°F in 2024 (3.7°F warmer than baseline avg.), 80.6°F in 1970 (0.3°F cooler than baseline avg.)
- Hottest summer on record: 2011, 86.7°F avg. temp. (5.8°F warmer than baseline avg.)
- Local population: 171,496
7. Loving County, Texas

- Change in annual avg. summer temperatures, 1970-2024: +5.1°F
- 20th century, baseline avg. summer temperature: 81.2°F
- Average summer temperature by year: 85.9°F in 2024 (4.7°F warmer than baseline avg.), 80.7°F in 1970 (0.5°F cooler than baseline avg.)
- Hottest summer on record: 2011, 88.1°F avg. temp. (6.9°F warmer than baseline avg.)
- Local population: 54
6. Ward County, Texas

- Change in annual avg. summer temperatures, 1970-2024: +5.1°F
- 20th century, baseline avg. summer temperature: 82.2°F
- Average summer temperature by year: 86.6°F in 2024 (4.4°F warmer than baseline avg.), 81.4°F in 1970 (0.8°F cooler than baseline avg.)
- Hottest summer on record: 2011, 88.7°F avg. temp. (6.5°F warmer than baseline avg.)
- Local population: 11,255
5. De Baca County, New Mexico

- Change in annual avg. summer temperatures, 1970-2024: +5.2°F
- 20th century, baseline avg. summer temperature: 75.1°F
- Average summer temperature by year: 80.2°F in 2024 (5.1°F warmer than baseline avg.), 74.6°F in 1970 (0.5°F cooler than baseline avg.)
- Hottest summer on record: 2020, 81.0°F avg. temp. (5.9°F warmer than baseline avg.)
- Local population: 1,580
4. Lea County, New Mexico

- Change in annual avg. summer temperatures, 1970-2024: +5.2°F
- 20th century, baseline avg. summer temperature: 77.0°F
- Average summer temperature by year: 81.9°F in 2024 (4.9°F warmer than baseline avg.), 76.6°F in 1970 (0.4°F cooler than baseline avg.)
- Hottest summer on record: 2011, 84.3°F avg. temp. (7.3°F warmer than baseline avg.)
- Local population: 73,154
3. Eddy County, New Mexico

- Change in annual avg. summer temperatures, 1970-2024: +5.2°F
- 20th century, baseline avg. summer temperature: 77.8°F
- Average summer temperature by year: 83.2°F in 2024 (5.4°F warmer than baseline avg.), 77.5°F in 1970 (0.3°F cooler than baseline avg.)
- Hottest summer on record: 2011, 84.5°F avg. temp. (6.7°F warmer than baseline avg.)
- Local population: 61,114
2. Ector County, Texas

- Change in annual avg. summer temperatures, 1970-2024: +5.2°F
- 20th century, baseline avg. summer temperature: 80.5°F
- Average summer temperature by year: 84.6°F in 2024 (4.1°F warmer than baseline avg.), 80.2°F in 1970 (0.3°F cooler than baseline avg.)
- Hottest summer on record: 2011, 87.1°F avg. temp. (6.6°F warmer than baseline avg.)
- Local population: 163,206
1. Winkler County, Texas
- Change in annual avg. summer temperatures, 1970-2024: +5.2°F
- 20th century, baseline avg. summer temperature: 81.0°F
- Average summer temperature by year: 85.4°F in 2024 (4.4°F warmer than baseline avg.), 80.5°F in 1970 (0.5°F cooler than baseline avg.)
- Hottest summer on record: 2011, 87.9°F avg. temp. (6.9°F warmer than baseline avg.)
- Local population: 7,540