The Billion-Dollar Disaster Data Trump Doesn’t Want You to See
 https://climate-crisis-247-bucket.nyc3.cdn.digitaloceanspaces.com/wp-content/uploads/2025/06/07215512/quq2cbfqkiw-150x150.jpg
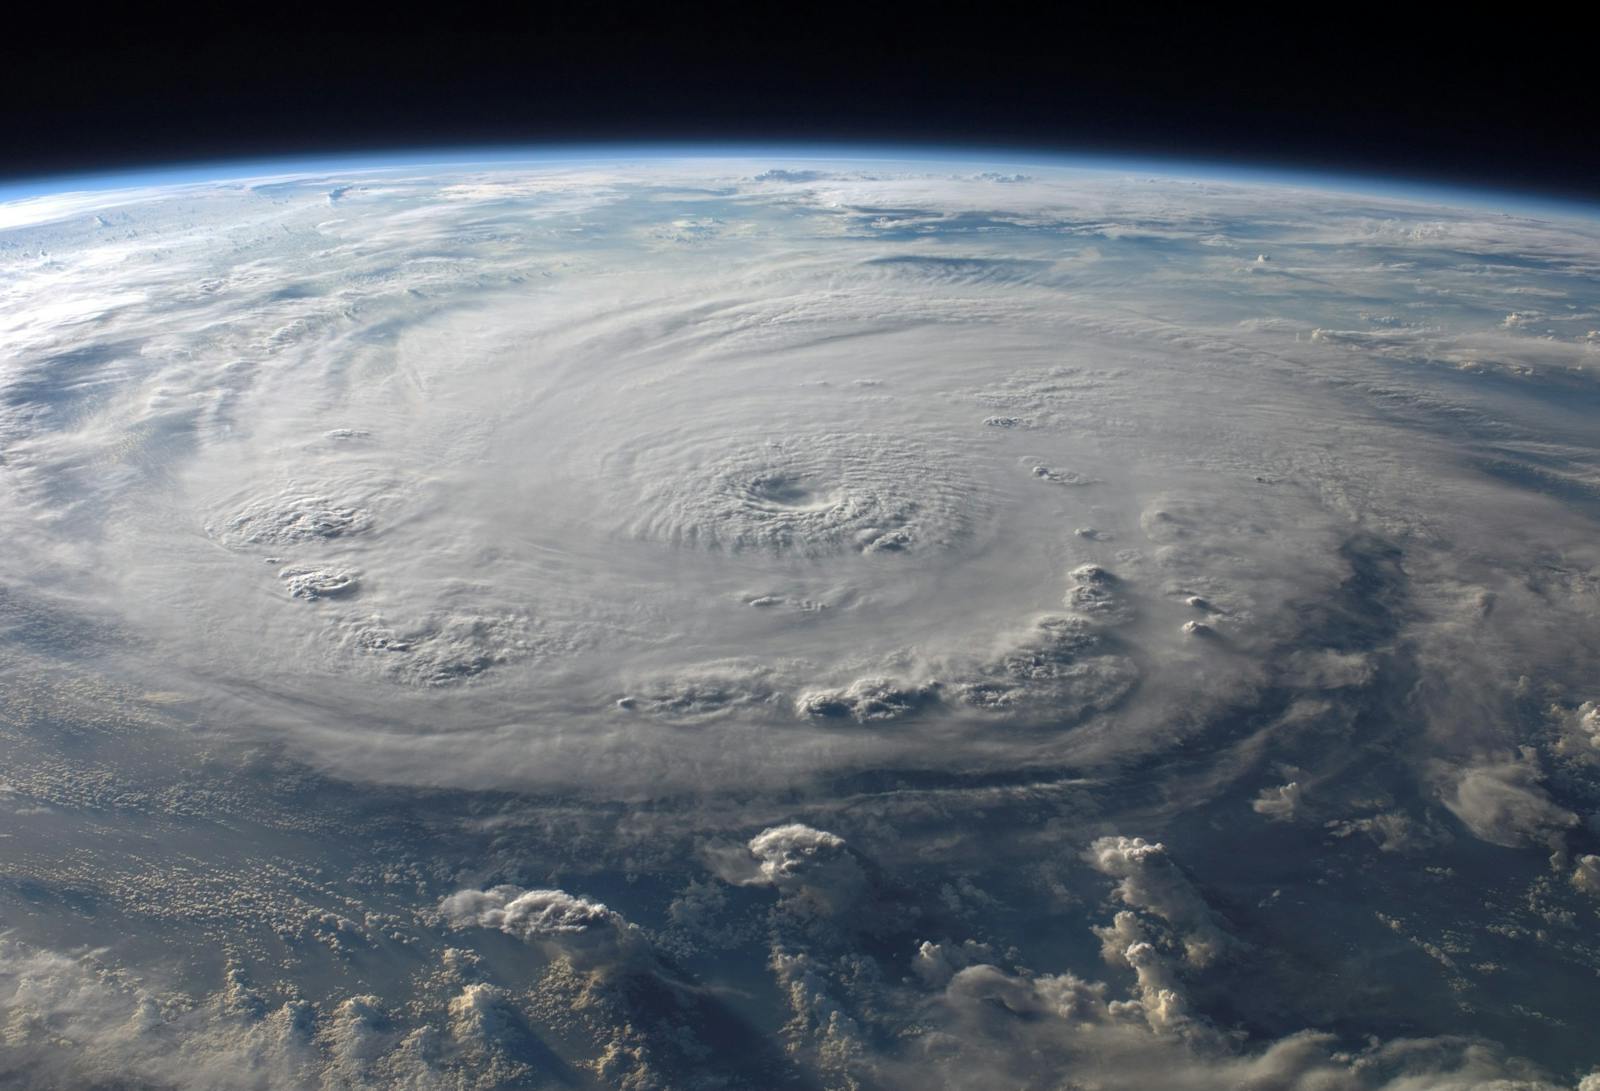
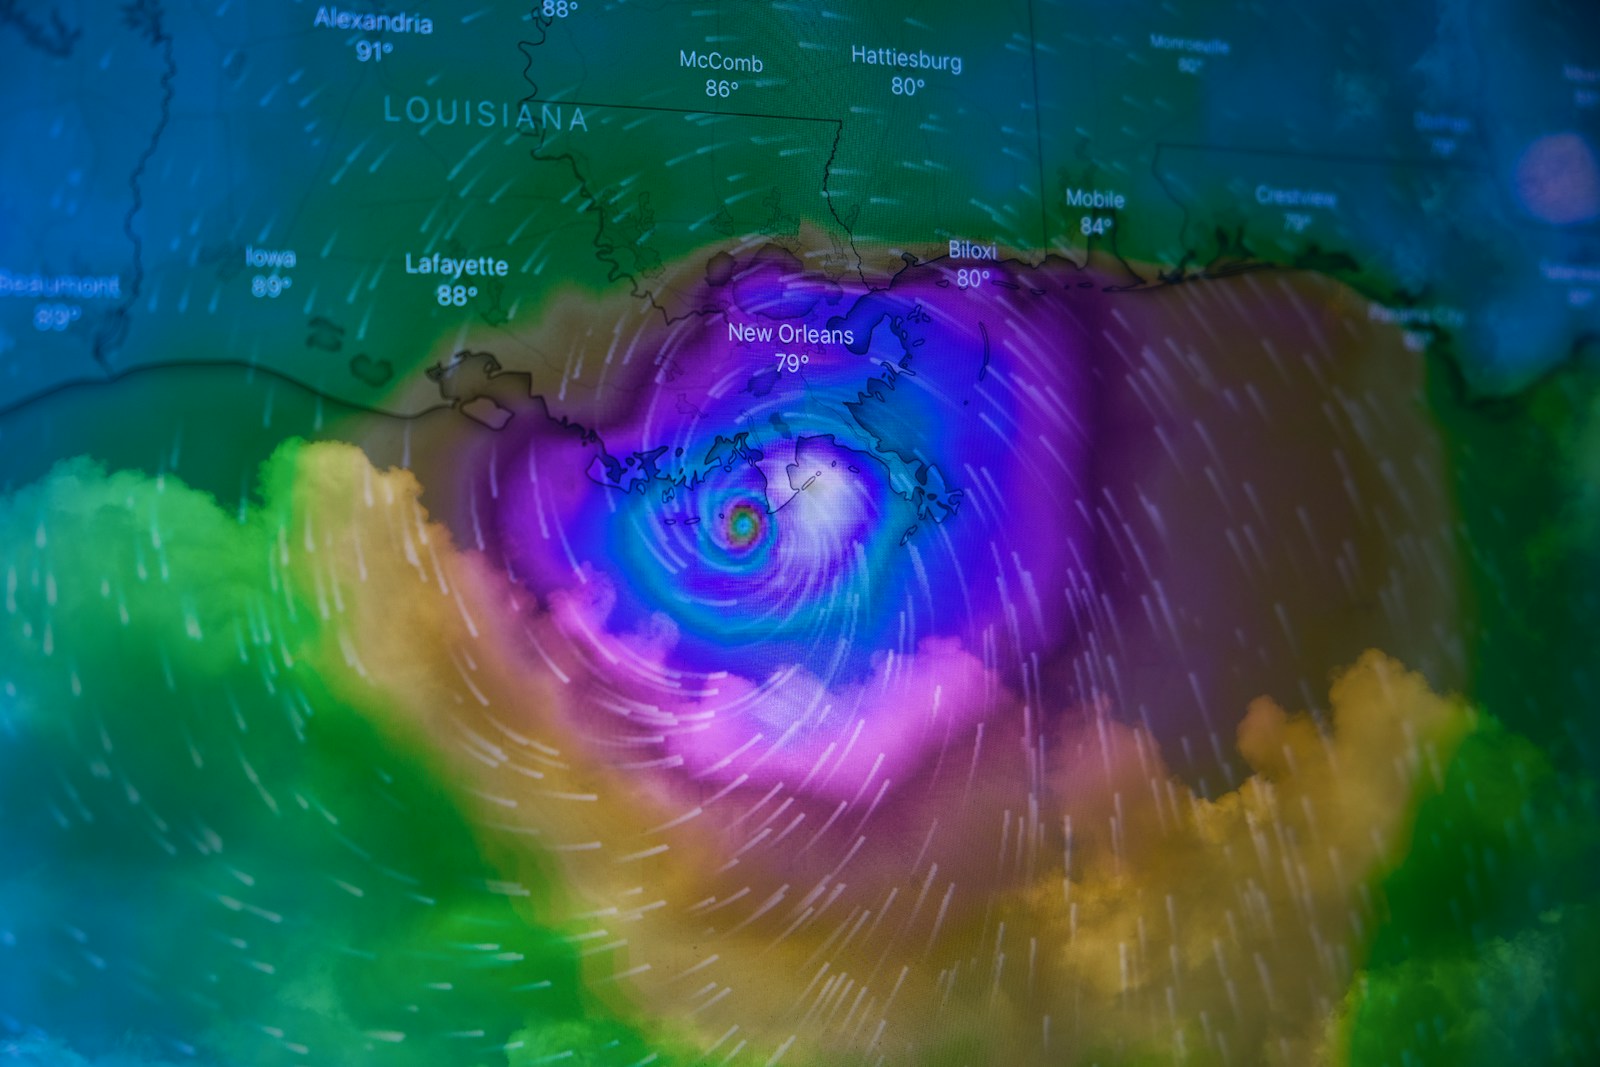
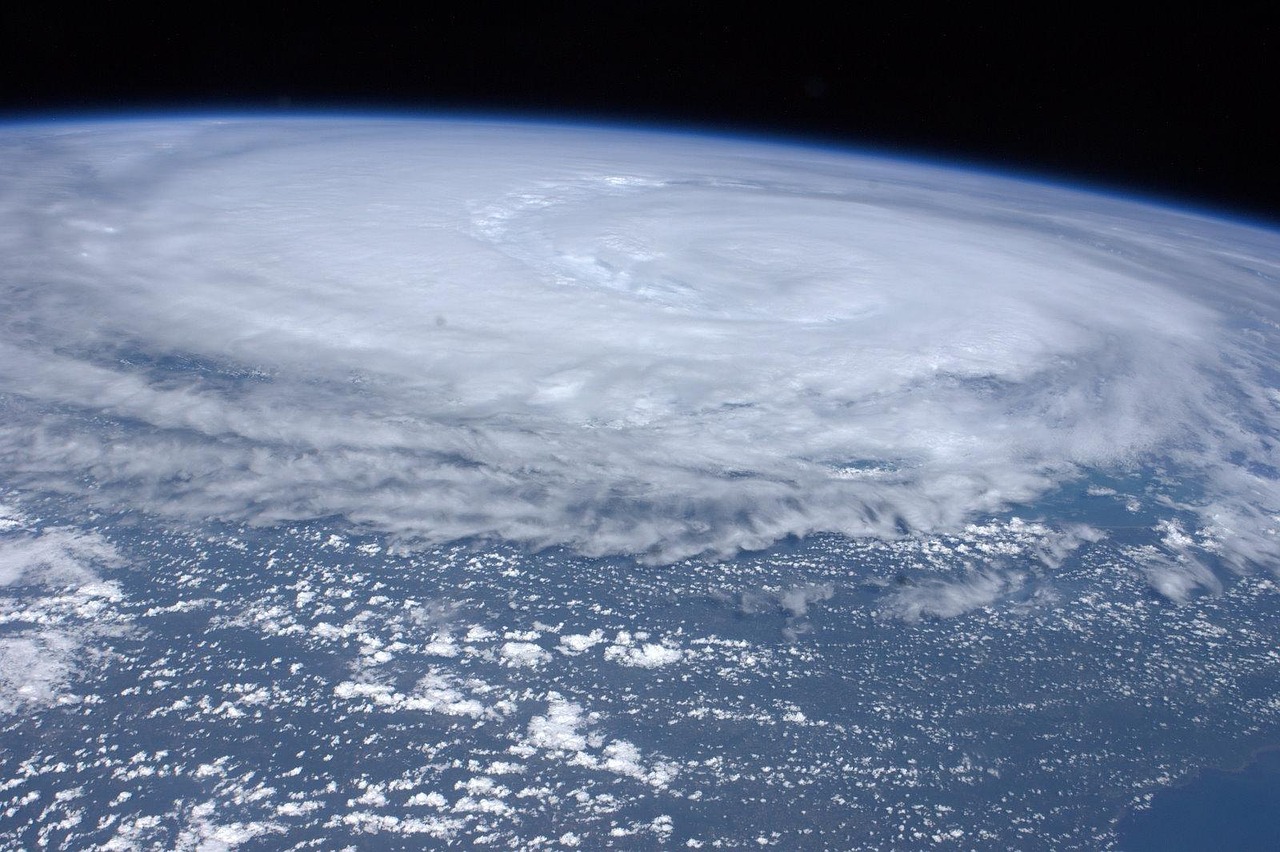
Earlier this year, the NOAA’s National Centers for Environmental Information announced that it would retire its Billion Dollar Weather and Climate Disasters product, a program that tracks the number of weather and climate disasters where damages and costs exceeded $1 billion since 1980. The ceasement of service is part of a broader series of cuts the Trump administration is making to the NOAA and other federal climate research programs.
Whence the next pandemic? Cities Where the Next Pandemic Is Most Likely to Break Out
Hot property? From Maui to Malibu, These Affluent Enclaves Are Becoming Wildfire Hotspots
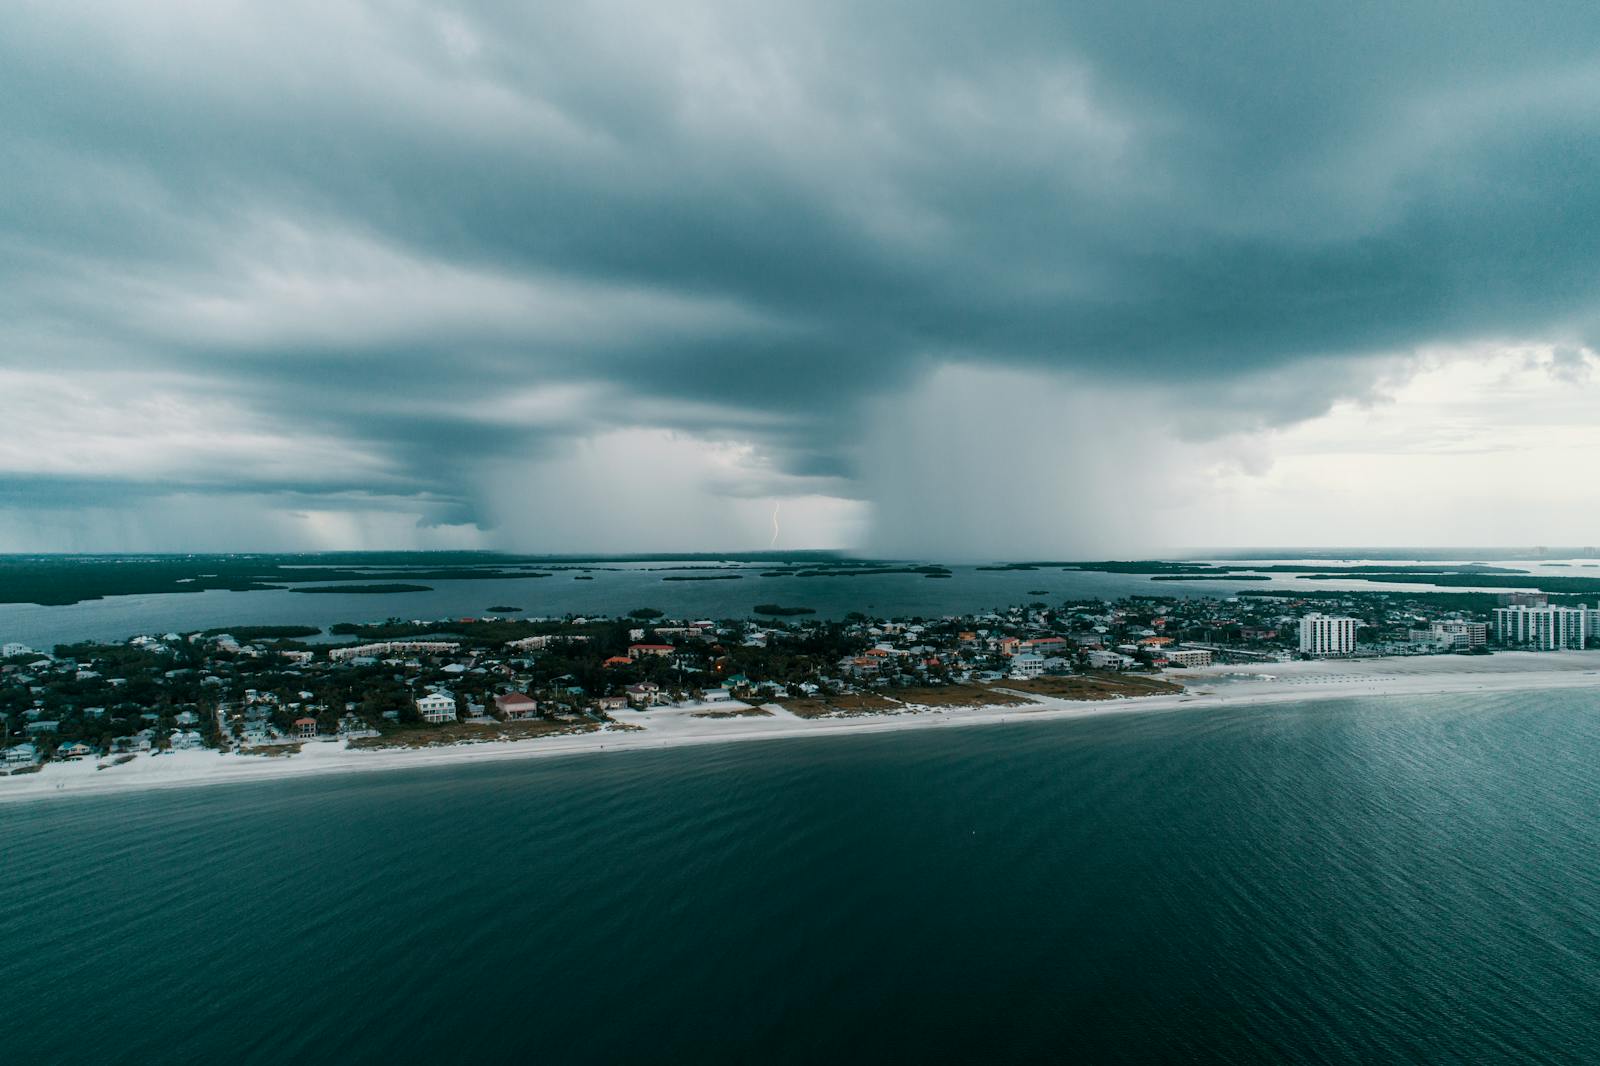
The funding cuts come just as billion-dollar disasters and other extreme weather events are becoming more common. In 2024, there were 27 weather and climate disasters exceeding $1 billion, nearly the most of any year and second only to 2024, when there were 28 billion-dollar disasters. Since 1980, there have been 403 billion-dollar weather disasters, with collective damages totaling nearly $3 trillion.
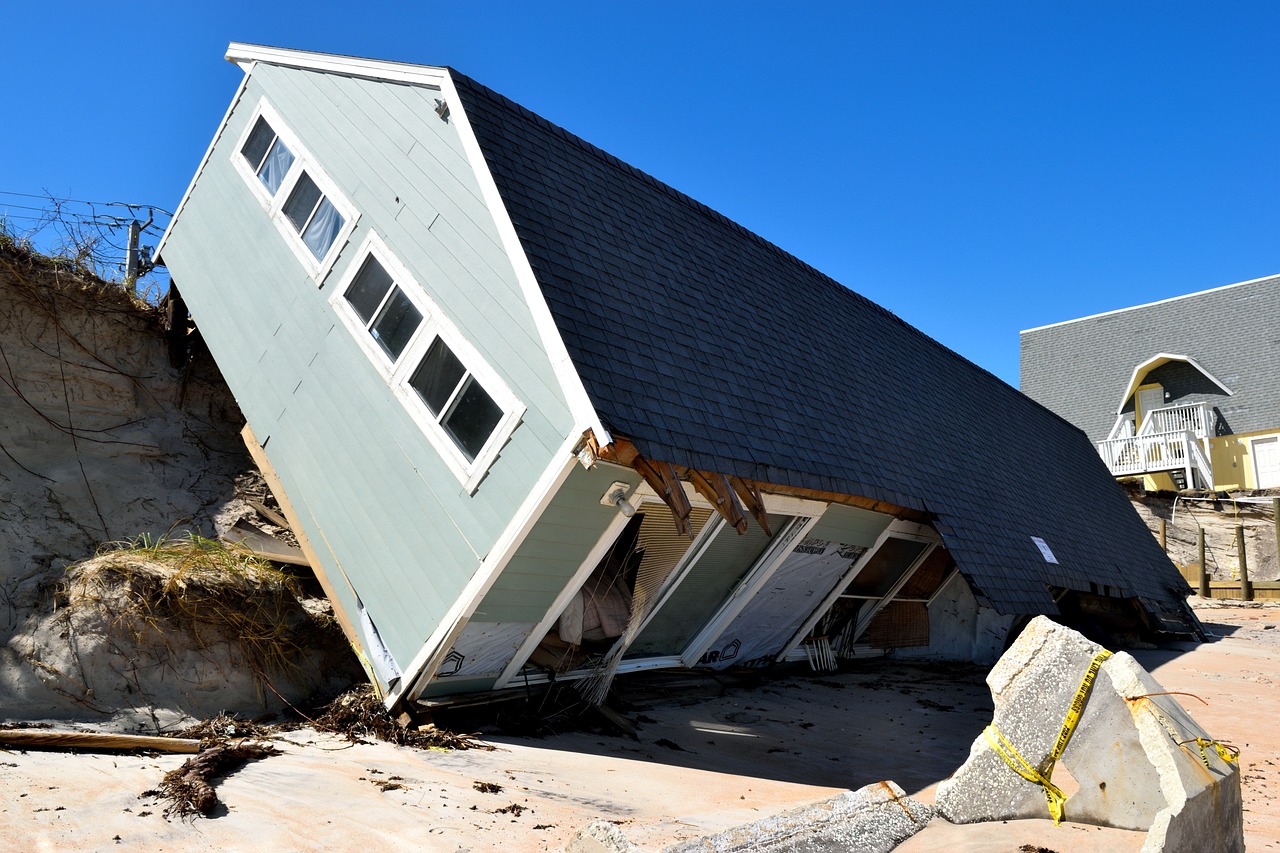
The discontinuation of NOAA’s billion-dollar weather product is a hindrance to scientists and other concerned citizens worldwide. The disaster tally has long been used in congressional hearings, regulatory assessments, and local planning efforts, and could impede economic decision-making around disaster preparedness and infrastructure investment without future updates. A closer look at the data reveals billion-dollar weather disaster data the Trump administration doesn’t want you to see.
To determine the billion-dollar weather disaster data the Trump administration doesn’t want you to see, Climate Crisis 247 reviewed data on billion-dollar weather and climate disasters from NOAA’s NCEI. The 25 costliest disasters are here ranked by total damage cost, adjusted for inflation. Costs are based on insured and uninsured losses, federal relief spending, and localized damage estimates.
25. Western/Central Drought and Heat Wave (2022)

- Total cost, adjusted for inflation: $23.5 billion
- Total cost, unadjusted: $21.0 billion
- Death toll: 136
24. Hurricane Charley (August 2004)
- Total cost, adjusted for inflation: $26.7 billion
- Total cost, unadjusted: $16.0 billion
- Death toll: 35
23. Northwest, Central, Eastern Winter Storm and Cold Wave (February 2021)

- Total cost, adjusted for inflation: $27.2 billion
- Total cost, unadjusted: $22.7 billion
- Death toll: 262
22. Hurricane Laura (August 2020)

- Total cost, adjusted for inflation: $28.1 billion
- Total cost, unadjusted: $23.2 billion
- Death toll: 42
21. Hurricane Rita (September 2005)
- Total cost, adjusted for inflation: $29.4 billion
- Total cost, unadjusted: $18.5 billion
- Death toll: 119
20. Western Wildfires, California Firestorm (Summer-Fall 2018)
- Total cost, adjusted for inflation: $30.0 billion
- Total cost, unadjusted: $24.0 billion
- Death toll: 106
19. Hurricane Florence (September 2018)
- Total cost, adjusted for inflation: $30.0 billion
- Total cost, unadjusted: $24.0 billion
- Death toll: 53
18. Hurricane Wilma (October 2005)
- Total cost, adjusted for inflation: $30.0 billion
- Total cost, unadjusted: $19.0 billion
- Death toll: 35
17. Hurricane Michael (October 2018)
- Total cost, adjusted for inflation: $31.2 billion
- Total cost, unadjusted: $25.0 billion
- Death toll: 49
16. Hurricane Ivan (September 2004)
- Total cost, adjusted for inflation: $34.0 billion
- Total cost, unadjusted: $20.5 billion
- Death toll: 57
15. Hurricane Milton (October 2024)

- Total cost, adjusted for inflation: $34.3 billion
- Total cost, unadjusted: $34.3 billion
- Death toll: 32
14. Central/Eastern Drought/Heat Wave (Summer-Fall 1980)

- Total cost, adjusted for inflation: $40.7 billion
- Total cost, unadjusted: $10.0 billion
- Death toll: 1,260
13. U.S. Drought/Heat Wave (2012)

- Total cost, adjusted for inflation: $41.7 billion
- Total cost, unadjusted: $30.0 billion
- Death toll: 123
12. Hurricane Ike (September 2008)
- Total cost, adjusted for inflation: $43.2 billion
- Total cost, unadjusted: $30.0 billion
- Death toll: 112
11. Midwest Flooding (Summer 1993)

- Total cost, adjusted for inflation: $46.3 billion
- Total cost, unadjusted: $21.0 billion
- Death toll: 48
10. U.S. Drought/Heat Wave (Summer 1988)

- Total cost, adjusted for inflation: $54.6 billion
- Total cost, unadjusted: $20.0 billion
- Death toll: 454
9. Hurricane Andrew (August 1992)

- Total cost, adjusted for inflation: $60.5 billion
- Total cost, unadjusted: $27.0 billion
- Death toll: 61
8. Hurricane Irma (September 2017)
- Total cost, adjusted for inflation: $64.0 billion
- Total cost, unadjusted: $50.0 billion
- Death toll: 97
7. Hurricane Helene (September 2024)

- Total cost, adjusted for inflation: $78.7 billion
- Total cost, unadjusted: $78.7 billion
- Death toll: 219
6. Hurricane Ida (August 2021)

- Total cost, adjusted for inflation: $84.6 billion
- Total cost, unadjusted: $73.6 billion
- Death toll: 96
5. Hurricane Sandy (October 2012)
- Total cost, adjusted for inflation: $88.5 billion
- Total cost, unadjusted: $65.0 billion
- Death toll: 159
4. Hurricane Maria (September 2017)
- Total cost, adjusted for inflation: $115.2 billion
- Total cost, unadjusted: $90.0 billion
- Death toll: 2,981
3. Hurricane Ian (September 2022)
- Total cost, adjusted for inflation: $119.6 billion
- Total cost, unadjusted: $111.8 billion
- Death toll: 152
2. Hurricane Harvey (August 2017)

- Total cost, adjusted for inflation: $160.0 billion
- Total cost, unadjusted: $125.0 billion
- Death toll: 89
1. Hurricane Katrina (August 2005)
- Total cost, adjusted for inflation: $201.3 billion
- Total cost, unadjusted: $125.0 billion
- Death toll: 1,833
Sponsor
Find a Vetted Financial Advisor
- Finding a fiduciary financial advisor doesn't have to be hard. SmartAsset's free tool matches you with up to 3 financial advisors that serve your area in 5 minutes.
- Each advisor has been vetted by SmartAsset and is held to a fiduciary standard to act in your best interests. Get on the path toward achieving your financial goals!