The US Counties Getting Windier Every Year
 https://climate-crisis-247-bucket.nyc3.cdn.digitaloceanspaces.com/wp-content/uploads/2025/06/07215231/9nq1iuhhayg-150x150.jpg
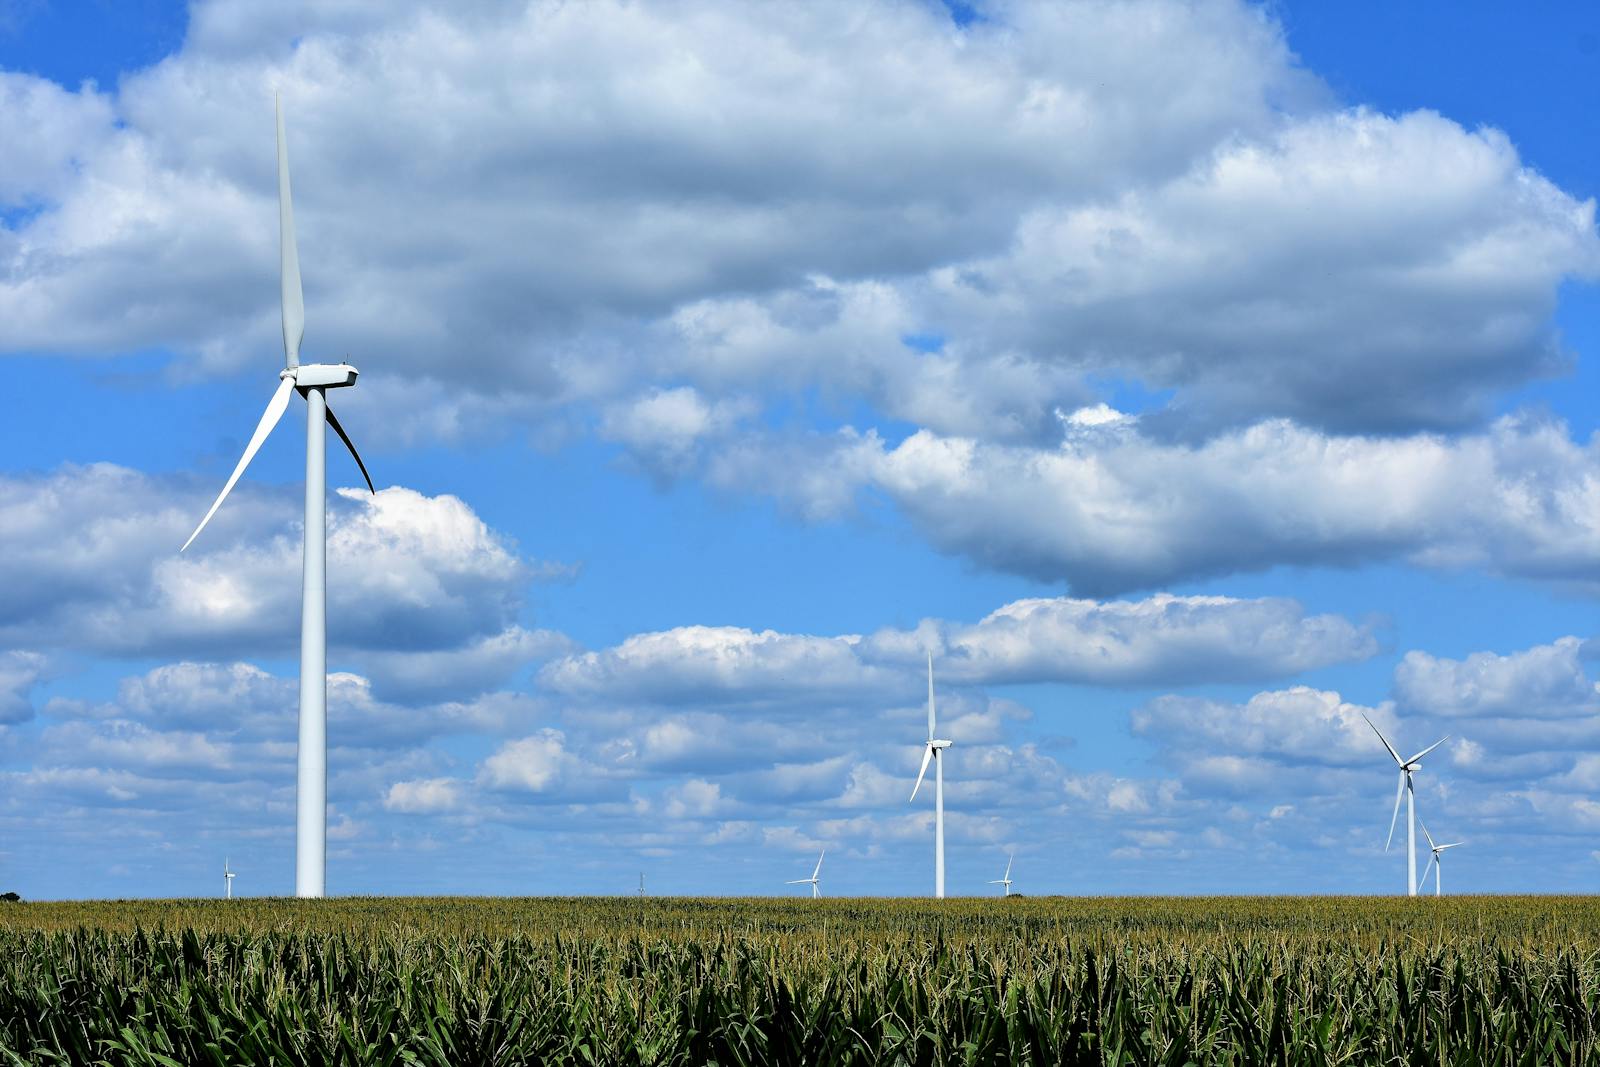
While the most tangible effects of global warming are major disasters like floods, hurricanes, and heat waves, climate change is causing other shifts in U.S. weather patterns. Although land-based changes like taller buildings and increased surface drag slowed global wind speeds for decades, in recent years long-standing ocean-atmosphere oscillations have caused wind speeds to begin to rise on the whole in some cities and fall in others.
Whence the next pandemic? Cities Where the Next Pandemic Is Most Likely to Break Out
Hot property? From Maui to Malibu, These Affluent Enclaves Are Becoming Wildfire Hotspots
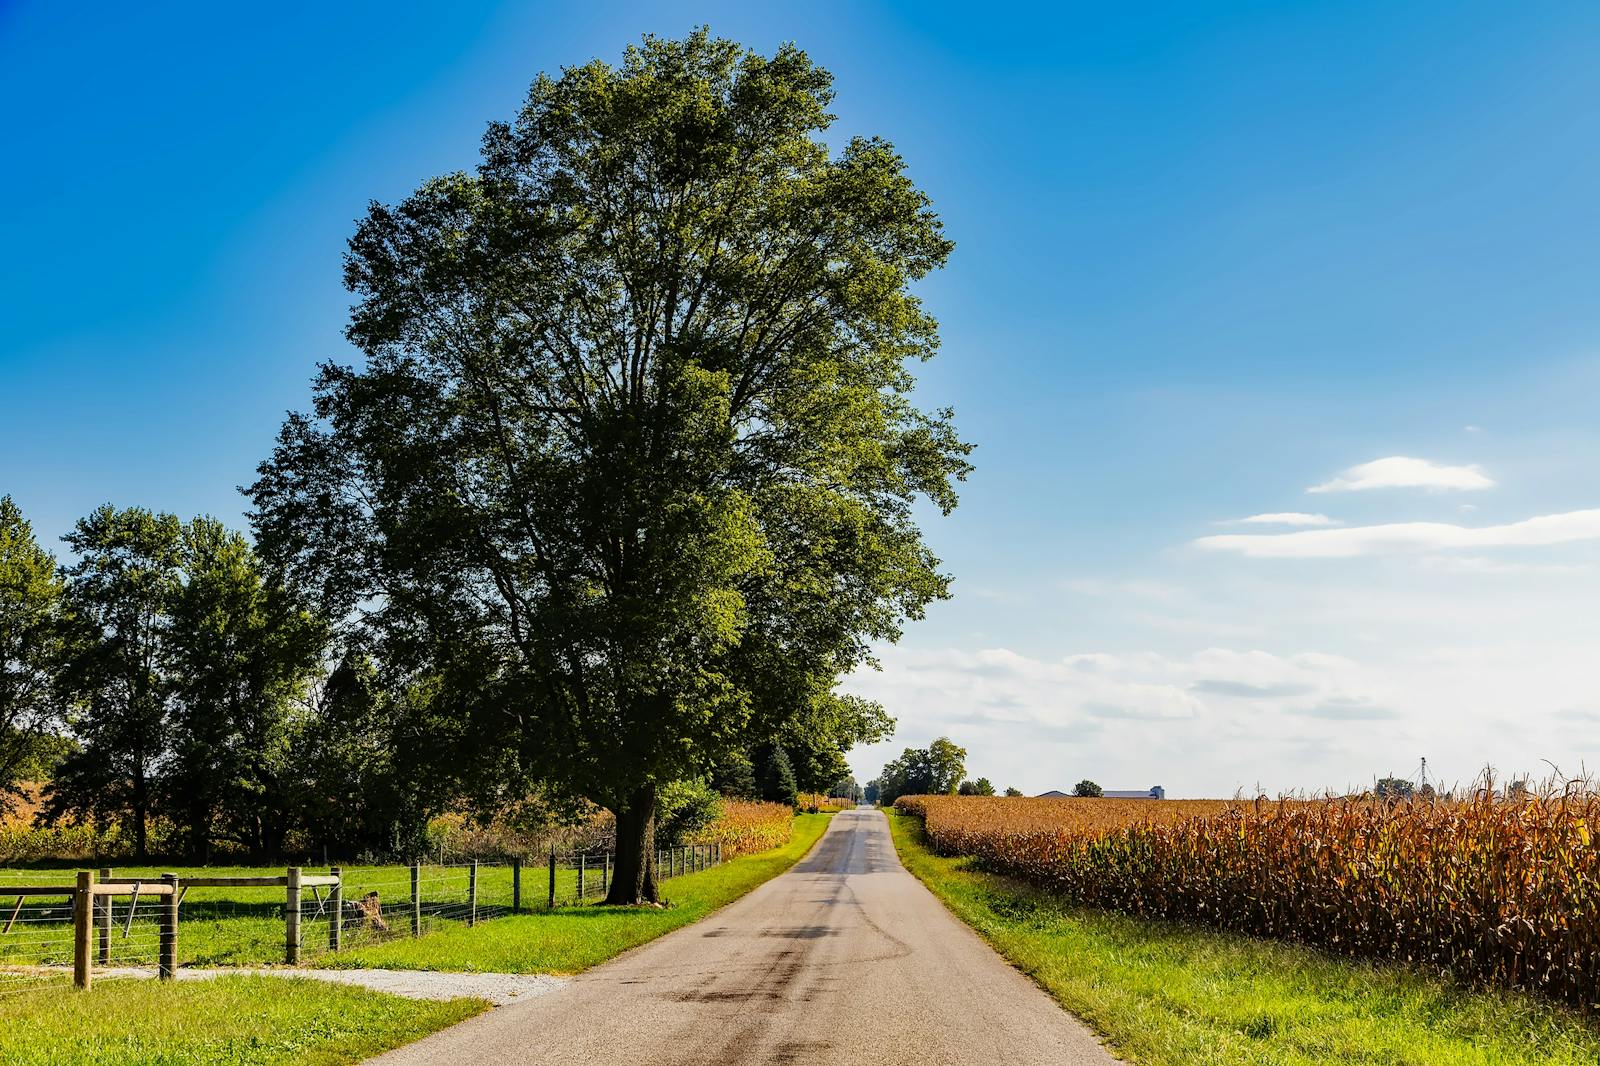
A changing climate may mean faster winds in some areas and slower winds in others. Even in the United States, there is high variability, with wind speeds rising in portions of the South and Ohio Valley and falling in portions of the Northeast. A look at historic wind gust data reveals the counties where wind speeds are rising the fastest.
To determine the counties where wind speeds are rising the fastest, Climate Crisis 247 reviewed data on historical wind patterns from the Storm Prediction Center of the NOAA’s National Weather Service. Counties were ranked based on the average annual change in the speed of wind gust events from 1950 to 2023. Only counties with at least 10 reported wind gust events were considered.
25. Sullivan County, PA

- Avg. annual increase in wind gust speed, 1950-2023: +0.33 mph per year
- Avg. speed of wind gust events: 59.68 mph
- County seat: Laporte
24. Todd County, KY

- Avg. annual increase in wind gust speed, 1950-2023: +0.33 mph per year
- Avg. speed of wind gust events: 67.63 mph
- County seat: Elkton
23. Calhoun County, AR

- Avg. annual increase in wind gust speed, 1950-2023: +0.33 mph per year
- Avg. speed of wind gust events: 61.11 mph
- County seat: Hampton
22. Adair County, OK

- Avg. annual increase in wind gust speed, 1950-2023: +0.33 mph per year
- Avg. speed of wind gust events: 66.88 mph
- County seat: Stilwell
21. Spencer County, IN
- Avg. annual increase in wind gust speed, 1950-2023: +0.33 mph per year
- Avg. speed of wind gust events: 64.94 mph
- County seat: Rockport
20. Hamilton County, IL
- Avg. annual increase in wind gust speed, 1950-2023: +0.34 mph per year
- Avg. speed of wind gust events: 64.37 mph
- County seat: McLeansboro
19. Iberville Parish, LA
- Avg. annual increase in wind gust speed, 1950-2023: +0.34 mph per year
- Avg. speed of wind gust events: 61.67 mph
- County seat: Plaquemine
18. Polk County, AR

- Avg. annual increase in wind gust speed, 1950-2023: +0.35 mph per year
- Avg. speed of wind gust events: 60.72 mph
- County seat: Mena
17. Montour County, PA
- Avg. annual increase in wind gust speed, 1950-2023: +0.35 mph per year
- Avg. speed of wind gust events: 60.03 mph
- County seat: Danville
16. Calloway County, KY

- Avg. annual increase in wind gust speed, 1950-2023: +0.36 mph per year
- Avg. speed of wind gust events: 63.37 mph
- County seat: Bardwell
14. Cleveland County, AR

- Avg. annual increase in wind gust speed, 1950-2023: +0.37 mph per year
- Avg. speed of wind gust events: 62.43 mph
- County seat: Rison
13. Monroe County, AR

- Avg. annual increase in wind gust speed, 1950-2023: +0.38 mph per year
- Avg. speed of wind gust events: 61.20 mph
- County seat: Clarendon
12. Cleburne County, AR

- Avg. annual increase in wind gust speed, 1950-2023: +0.38 mph per year
- Avg. speed of wind gust events: 61.47 mph
- County seat: Heber Springs
11. Johnson County, IL

- Avg. annual increase in wind gust speed, 1950-2023: +0.38 mph per year
- Avg. speed of wind gust events: 62.79 mph
- County seat: Vienna
10. Schleicher County, TX
- Avg. annual increase in wind gust speed, 1950-2023: +0.41 mph per year
- Avg. speed of wind gust events: 67.40 mph
- County seat: Eldorado
9. Warrick County, IN
- Avg. annual increase in wind gust speed, 1950-2023: +0.41 mph per year
- Avg. speed of wind gust events: 64.90 mph
- County seat: Boonville
8. Decatur County, TN

- Avg. annual increase in wind gust speed, 1950-2023: +0.45 mph per year
- Avg. speed of wind gust events: 62.63 mph
- County seat: Decaturville
7. Edwards County, TX

- Avg. annual increase in wind gust speed, 1950-2023: +0.47 mph per year
- Avg. speed of wind gust events: 62.46 mph
- County seat: Rocksprings
6. East Feliciana Parish, LA

- Avg. annual increase in wind gust speed, 1950-2023: +0.47 mph per year
- Avg. speed of wind gust events: 61.50 mph
- County seat: Clinton
5. Dallas County, AR

- Avg. annual increase in wind gust speed, 1950-2023: +0.48 mph per year
- Avg. speed of wind gust events: 61.19 mph
- County seat: Fordyce
4. Austin County, TX

- Avg. annual increase in wind gust speed, 1950-2023: +0.49 mph per year
- Avg. speed of wind gust events: 64.54 mph
- County seat: Bellville
3. Menominee County, WI

- Avg. annual increase in wind gust speed, 1950-2023: +0.52 mph per year
- Avg. speed of wind gust events: 62.19 mph
- County seat: Keshena
2. Madison County, AR

- Avg. annual increase in wind gust speed, 1950-2023: +0.52 mph per year
- Avg. speed of wind gust events: 67.22 mph
- County seat: Huntsville
1. St. Helena Parish, LA

- Avg. annual increase in wind gust speed, 1950-2023: +0.93 mph per year
- Avg. speed of wind gust events: 62.78 mph
- County seat: Greensburg