
The Highest Gas Prices of the Last 50 Years
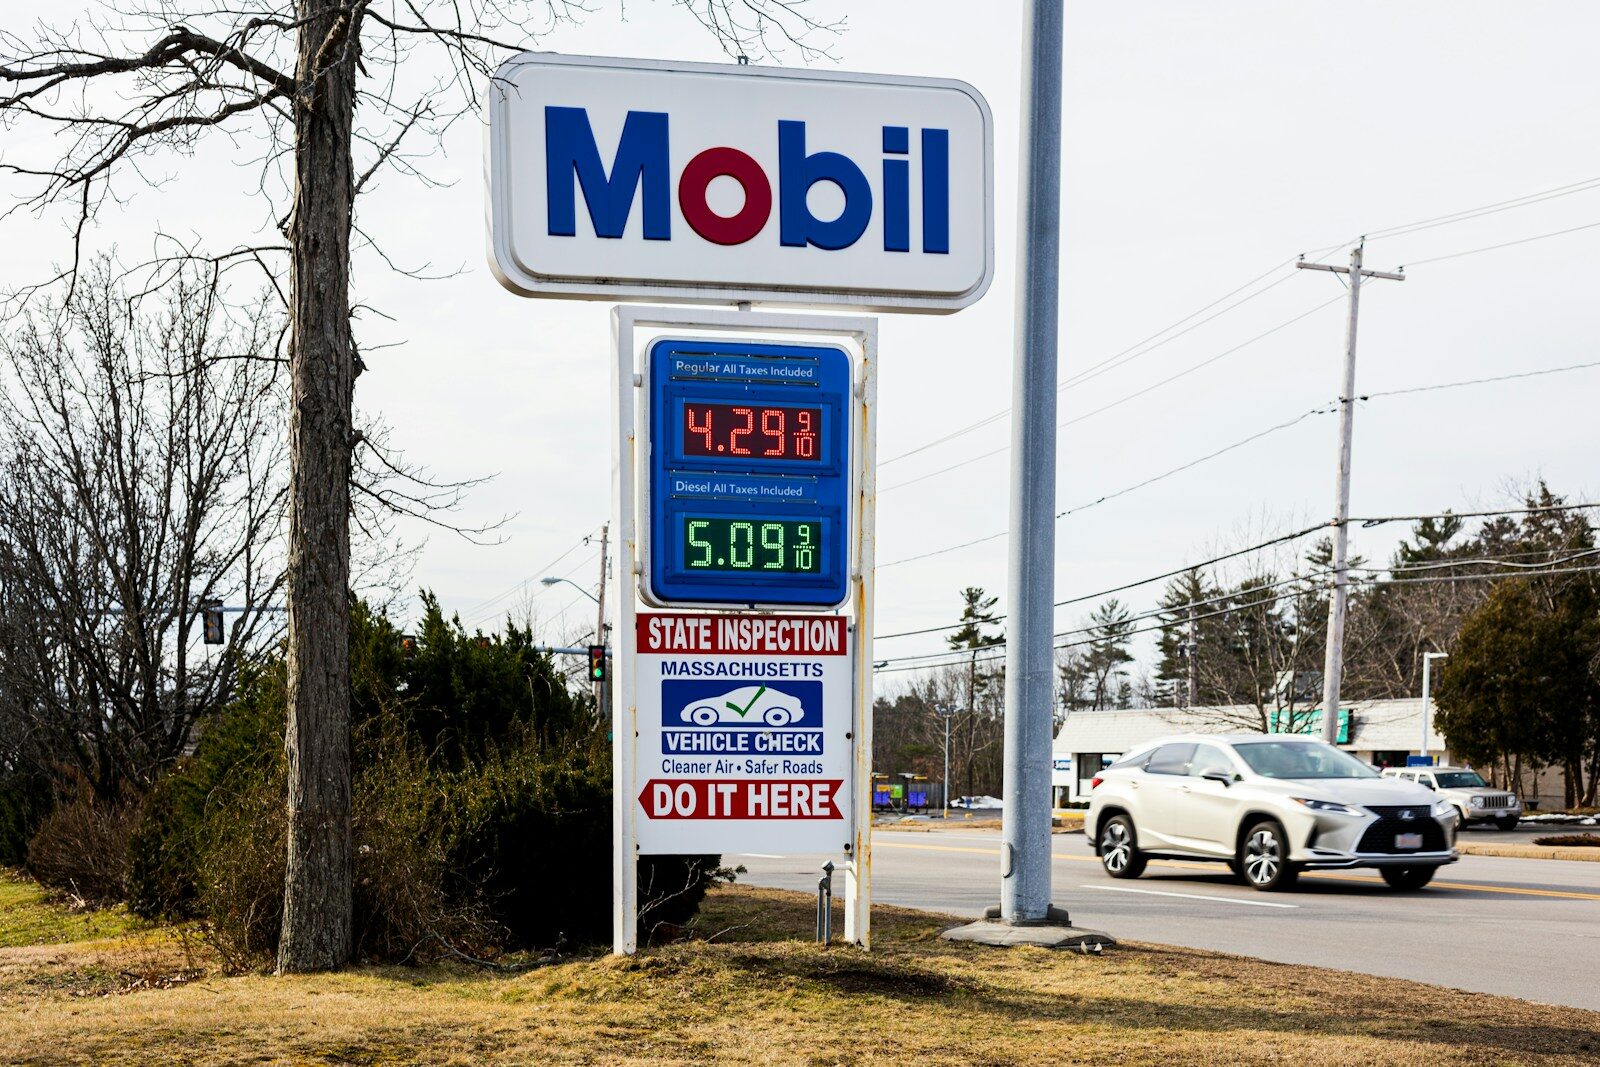
GasBuddy reports that gas prices are about to reach an all-time high. Patrick De Haan, head of petroleum analysis, wrote: “By later this week, the national average could reach its highest level ever recorded for this point in the calendar year — a sobering milestone, even as prices remain well below the all-time record set in 2022.” The primary driver has been several rounds of military activity across the Middle East, which has substantially cut the flow of oil.
That said, there have been periods when prices were actually much higher. As with many prices, it’s useful to adjust for inflation. For example, gas cost just $0.53 a gallon during the early part of the Arab oil embargo. Compared to today’s prices, that sounds cheap — but adjusted for inflation, it comes to $3.37, making it one of the most expensive periods of the last 50 years.
Almost every time gas prices rise sharply, there’s a specific reason behind it, and that reason is almost always tied to a military conflict — most often in the Middle East. Some of the world’s largest oil-producing nations — Saudi Arabia, Iran, Iraq, the UAE, and Kuwait — are all currently involved in Middle East military conflict, including the shutdown of the Strait of Hormuz.
We’ve taken two approaches in the table below. In some cases, gas prices stayed elevated for long stretches of time — sometimes the better part of a year. In other cases, the spike was much shorter. The “Date/Era” column reflects this distinction.
1. July 2008 — $4.11/gal (~$6.20–6.30 adjusted)
Oil speculation combined with a weak dollar drove crude oil to $147.27 a barrel on July 11, 2008. Peterson reports it then collapsed “to less than $40 a barrel in December.”
2. March 1981 — ~$1.35–1.42/gal (~$5.32 adjusted)
The Iranian Revolution cut Iran’s output from 6 million barrels a day to about 1.5 million. According to BOE, “the countries with spare capacity — Saudi Arabia, the United Arab Emirates — [were] unable to compensate” at the time.
3. June 14, 2022 — $5.016/gal (~$5.55 adjusted)
Russia’s invasion of Ukraine disrupted global oil supply, and sanctions reduced Russian exports, though they did not stop production entirely.
4. 1980 (annual) — ~$1.19–1.25/gal (~$4.52 adjusted)
Continued fallout from the Iranian Revolution shock, as in 1981, with conflict intensifying further.
5. Spring 2026 (May) — ~$4.48/gal (~$4.48–4.60 adjusted)
War between Iran and a U.S.-Israel coalition, including Iran’s blockade of the Strait of Hormuz — the bottleneck for roughly 20% of the world’s oil transit.
6. 1974 (annual) — ~$0.53/gal (~$3.37 adjusted)
The first OPEC oil embargo, imposed in retaliation for U.S. support of Israel during the Yom Kippur War — a conflict between Israel and Egypt/Syria.
7. 2012 (annual) — ~$3.64/gal (~$3.90–4.00 adjusted)
Months of elevated crude prices, driven partly by U.S. and EU sanctions on Iran over its nuclear program.
8–10. 2011–2014 (general span) — ~$3.50–3.90/gal (~$4.00–4.90 adjusted)
A prolonged period of elevated global crude prices. According to the Christian Science Monitor, “a combination of high crude prices, refinery shutdowns, and early speculation has sent gas prices soaring.”
Sources include Dr. Randal S. Olson , the U.S. Energy Information Administration’s Gasoline and Diesel Fuel Update, the Federal Reserve Bank of St Louis, and AAA Fuel Gauge. Inflation adjustments came from the BLS CPI Inflation Calculator.
More from ClimateCrisis 247
- Worst Polluting Nations in the World Compared to Shipping & Aviation Industries
- Nations with the Most EV Sales Per Hour, Adjusted for Population
- The States Where People Have Already Left Because Of Climate Change
- Worst Fall Snowstorms to Hit America’s Largest Cities





