
A Month’s Worth of Rain in Two Days: The Cities Hit Hardest
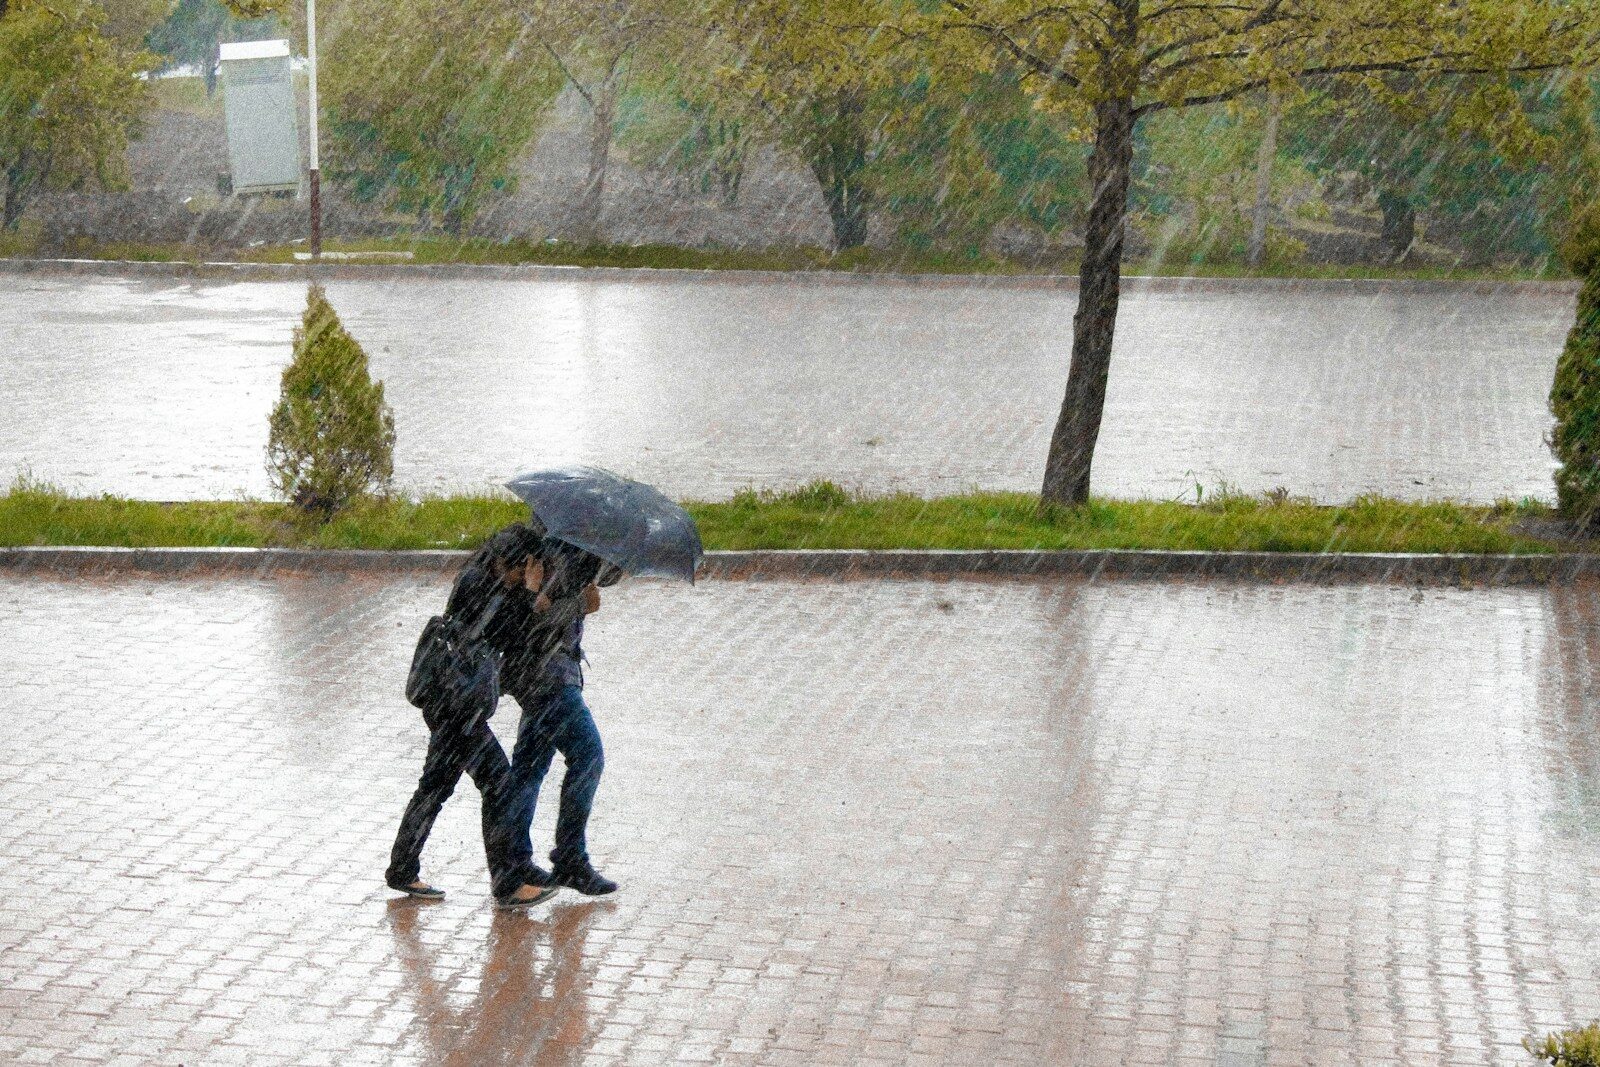
So far in summer 2026, dangerous drought conditions have impacted large swathes of the country. Since the beginning of June, anywhere from 28% to 37% of land area, mostly concentrated in the Western United States, have been in a severe or worse drought, according to the U.S. Drought Monitor. But while the West is drying up, cities across the Northeast are coping with the opposite problem, as the final days of July inundated much of the region with record-shattering rainfall.
Between July 28th and July 29th, a slow moving weather system brought torrential downpours to parts of New England and the mid-Atlantic, breaking two-day rainfall records in cities from Northwestern Pennsylvania, up through Vermont, and out into Eastern Massachusetts. In New York State, multiple counties in the Capital District and Hudson Valley issued state of emergency declarations, as flooding led to road closures, train route disruptions, and damage to homes and businesses.
Several of the hardest hit cities and towns reported nearly half a foot of rain in a 48 hour period – more than they typically get in the entire month of July, according to records from the National Oceanic and Atmospheric Administration.
Using data from NOAA’s Southeast Regional Climate Center, Climate Crisis 247 identified the cities hit hardest by record-breaking rainfall this week. We ranked all cities with available data on the total volume of rain reported between July 28th and July 29th, 2026. Only cities where rainfall broke historic records were considered, and only the 10 places that reported the greatest volume of rain are listed. Supplemental data on 30-year average July rainfall is also from NOAA.

10. North Adams, Massachusetts
- Total rainfall, July 28-29, 2026: 3.4 inches (81.4% of average rainfall for entire month of July)
- 30 year average July rainfall, 1991-2020: 4.1 inches
- Total rainfall on July 28th, 2026: 1.3 inches (1.2 inches more than normal)
- Total rainfall on July 29th, 2026: 2.1 inches (1.9 inches more than normal)
- Local record keeping began: 31 years ago
9. Bennington, Vermont
- Total rainfall, July 28-29, 2026: 3.4 inches (73.8% of average rainfall for entire month of July)
- 30 year average July rainfall, 1991-2020: 4.7 inches
- Total rainfall on July 28th, 2026: 1.9 inches (1.9 inches more than normal)
- Total rainfall on July 29th, 2026: 1.6 inches (1.6 inches more than normal)
- Local record keeping began: 28 years ago
8. Delhi, New York
- Total rainfall, July 28-29, 2026: 3.6 inches (75.8% of average rainfall for entire month of July)
- 30 year average July rainfall, 1991-2020: 4.8 inches
- Total rainfall on July 28th, 2026: 2.7 inches (2.6 inches more than normal)
- Total rainfall on July 29th, 2026: 0.9 inches (0.7 inches more than normal)
- Local record keeping began: 88 years ago
7. Westfield, Massachusetts
- Total rainfall, July 28-29, 2026: 3.8 inches (90.8% of average rainfall for entire month of July)
- 30 year average July rainfall, 1991-2020: 4.2 inches
- Total rainfall on July 28th, 2026: 0.9 inches (0.7 inches more than normal)
- Total rainfall on July 29th, 2026: 2.9 inches (2.7 inches more than normal)
- Local record keeping began: 32 years ago
6. Bradford, Pennsylvania
- Total rainfall, July 28-29, 2026: 3.9 inches (94.0% of average rainfall for entire month of July)
- 30 year average July rainfall, 1991-2020: 4.2 inches
- Total rainfall on July 28th, 2026: 3.9 inches (3.8 inches more than normal)
- Total rainfall on July 29th, 2026: 0 inches (0.1 inches fewer than normal)
- Local record keeping began: 66 years ago
5. Hartford, Connecticut
- Total rainfall, July 28-29, 2026: 4.3 inches (103.1% of average rainfall for entire month of July)
- 30 year average July rainfall, 1991-2020: 4.2 inches
- Total rainfall on July 28th, 2026: 2.0 inches (1.8 inches more than normal)
- Total rainfall on July 29th, 2026: 2.3 inches (2.2 inches more than normal)
- Local record keeping began: 78 years ago
4. Glens Falls, New York
- Total rainfall, July 28-29, 2026: 4.5 inches (104.9% of average rainfall for entire month of July)
- 30 year average July rainfall, 1991-2020: 4.3 inches
- Total rainfall on July 28th, 2026: 1.5 inches (1.4 inches more than normal)
- Total rainfall on July 29th, 2026: 3.0 inches (2.8 inches more than normal)
- Local record keeping began: 81 years ago
3. Worcester, Massachusetts
- Total rainfall, July 28-29, 2026: 5.4 inches (138.2% of average rainfall for entire month of July)
- 30 year average July rainfall, 1991-2020: 3.9 inches
- Total rainfall on July 28th, 2026: 0.9 inches (0.7 inches more than normal)
- Total rainfall on July 29th, 2026: 4.6 inches (4.4 inches more than normal)
- Local record keeping began: 134 years ago
2. Shrub Oak, New York
- Total rainfall, July 28-29, 2026: 5.6 inches (119.1% of average rainfall for entire month of July)
- 30 year average July rainfall, 1991-2020: 4.7 inches
- Total rainfall on July 28th, 2026: 0 inches (0.1 inches fewer than normal)
- Total rainfall on July 29th, 2026: 5.6 inches (5.5 inches more than normal)
- Local record keeping began: 32 years ago
1. Albany, New York
- Total rainfall, July 28-29, 2026: 6.9 inches (152.3% of average rainfall for entire month of July)
- 30 year average July rainfall, 1991-2020: 4.6 inches
- Total rainfall on July 28th, 2026: 1.5 inches (1.3 inches more than normal)
- Total rainfall on July 29th, 2026: 5.5 inches (5.3 inches more than normal)
- Local record keeping began: 153 years ago
More from ClimateCrisis 247
- Ocean Temperatures Hit a Historic High in 2026
- Hottest Falls In US History
- The Fish, Birds, and Mussels America Just Lost for Good
- The American Counties Missing the Most Rain This Year





