
10 US Cities Where Fall is Feeling More Like Summer
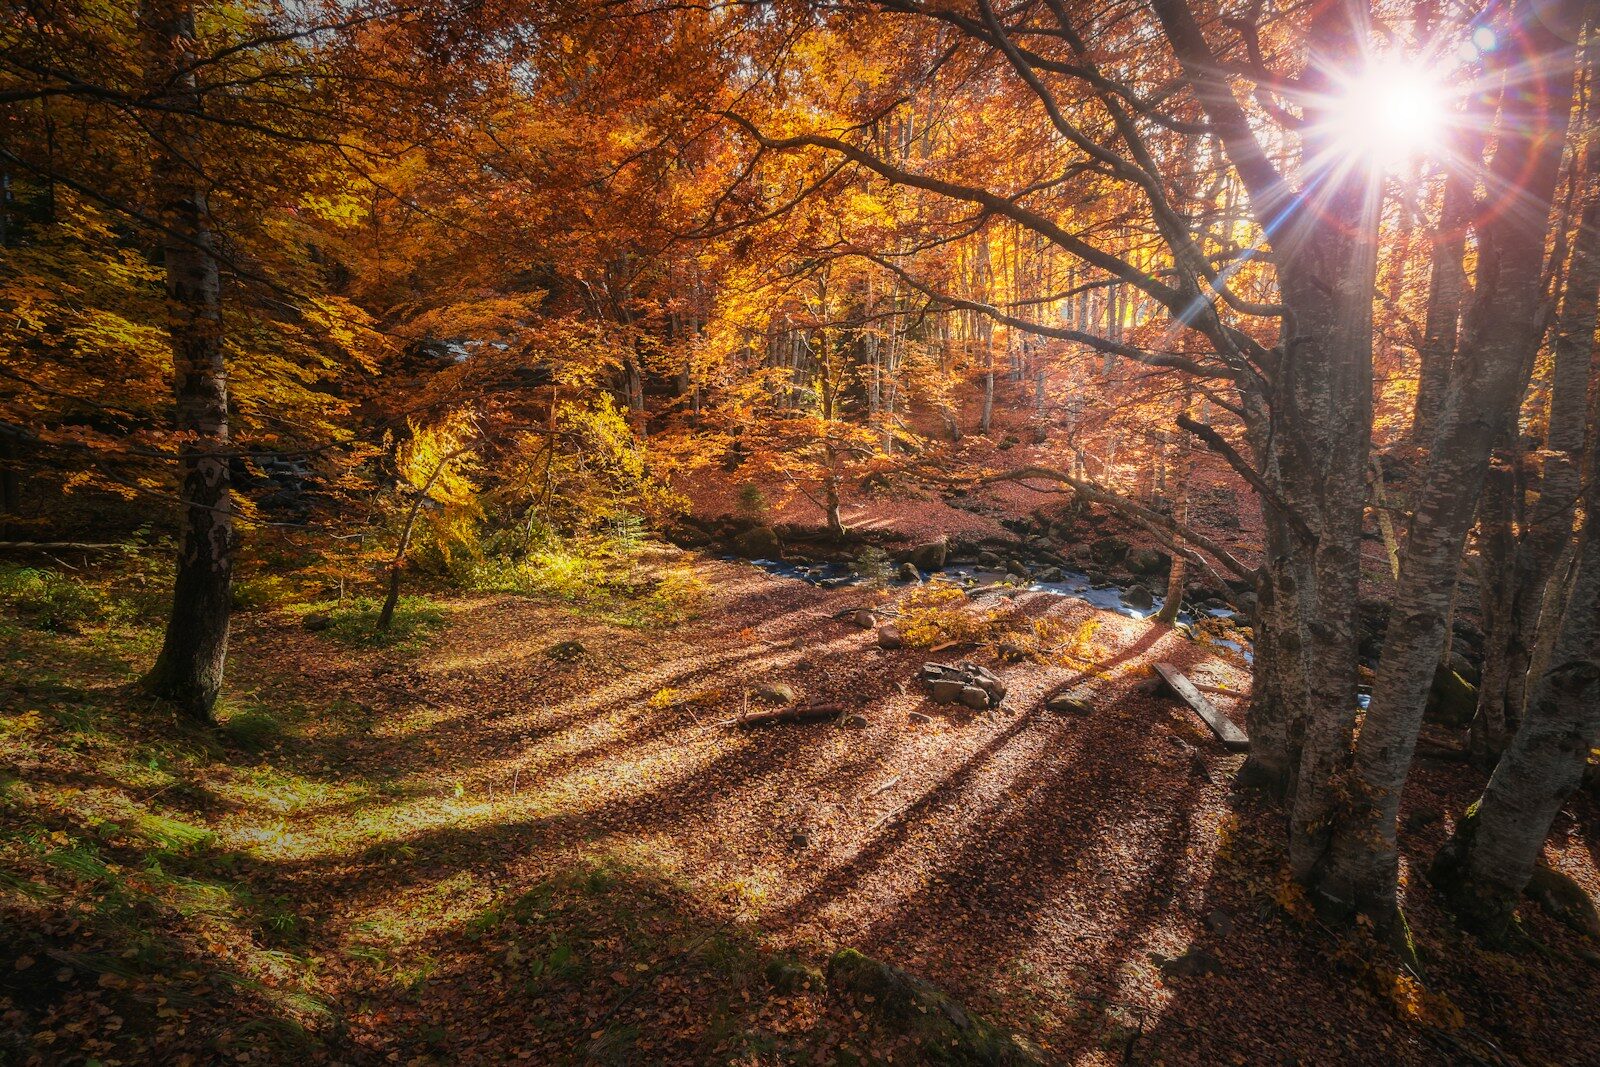
The meteorological fall lasts from the beginning of September through the end of November, and in the United States, the season is marked by a steady cooling trend. According to the National Oceanic and Atmospheric Administration, average fall temperatures decline from 64.8°F in September to 41.7°F in November across the Lower 48. In recent decades, however, fall temperatures have climbed meaningfully across the country – and in certain cities, levels of heat previously confined mostly to the summer season are becoming more common well into autumn.
A recent study published by Climate Central, a research and advocacy group, analyzed historical fall temperatures in 245 major U.S. cities. According to their findings, autumn temperatures measurably rose in all but four of those cities between 1970 and 2025, and by an average of 2.9°F. The study also found that human-caused climate change was responsible for the bulk of the observed warming trend in 200 cities included in the report.
In several places, fall temperatures have climbed by more than double the 2.9°F national average over the last 55 years. In these and other major cities included in the study, there are now dozens more fall days each year where temperatures exceed seasonal norms than there were in the 1970s.
Using data from Climate Central, Climate Crisis 247 identified the U.S. cities where fall is starting to feel more like summer. We ranked all 245 cities included in the study on the observed change in average fall temperatures between 1970 and 2024. Only the 10 cities with the greatest change are listed. Data on historical five-year average fall temperatures and record-high fall temperatures are from the NOAA Northeast Regional Climate Center. All other supplemental data is from Climate Central.
It is important to note that the degree change in average fall temperatures do not necessarily reflect the difference in noted historical fall temperatures, as the latter represent multi-year averages.

10. Burlington, VT
- Change in average fall temperature, 1970-2025: +5.2°F (+2.9°F due to climate change)
- Average fall temperature in city (5-year mean): 52.6°F in 2025, 47.7°F in 1970
- Record-high fall temperature in city: 98°F on September 9, 2022
- Change in number of unusually warm fall days, 1970-2025: +23
9. Minneapolis • St. Paul, MN
- Change in average fall temperature, 1970-2025: +5.5°F (+2.7°F due to climate change)
- Average fall temperature in city (5-year mean): 53.3°F in 2025, 47.2°F in 1970
- Record-high fall temperature in city: 98°F on September 4, 2023
- Change in number of unusually warm fall days, 1970-2025: +26
8. Helena, MT
- Change in average fall temperature, 1970-2025: +5.6°F (+1.9°F due to climate change)
- Average fall temperature in city (5-year mean): 48.7°F in 2025, 44.5°F in 1970
- Record-high fall temperature in city: 102°F on September 7, 2022
- Change in number of unusually warm fall days, 1970-2025: +26
7. Las Cruces, NM
- Change in average fall temperature, 1970-2025: +5.6°F (+3.9°F due to climate change)
- Average fall temperature in city (5-year mean): 65.6°F in 2025, 61.0°F in 1970
- Record-high fall temperature in city: 103°F on September 9, 2023
- Change in number of unusually warm fall days, 1970-2025: +42
6. Phoenix, AZ
- Change in average fall temperature, 1970-2025: +5.8°F (+5.5°F due to climate change)
- Average fall temperature in city (5-year mean): 79.1°F in 2025, 72.1°F in 1970
- Record-high fall temperature in city: 118°F on September 1, 1950
- Change in number of unusually warm fall days, 1970-2025: +39
5. Tucson, AZ
- Change in average fall temperature, 1970-2025: +5.9°F (+4.6°F due to climate change)
- Average fall temperature in city (5-year mean): 74.0°F in 2025, 69.4°F in 1970
- Record-high fall temperature in city: 111°F on September 10, 2023
- Change in number of unusually warm fall days, 1970-2025: +41
4. Tyler, TX
- Change in average fall temperature, 1970-2025: +6°F (+3.5°F due to climate change)
- Average fall temperature in city (5-year mean): N/A
- Record-high fall temperature in city: 107°F on September 1, 2000
- Change in number of unusually warm fall days, 1970-2025: +29
3. Las Vegas, NV
- Change in average fall temperature, 1970-2025: +6.3°F (+4.6°F due to climate change)
- Average fall temperature in city (5-year mean): 71.6°F in 2025, 66.9°F in 1970
- Record-high fall temperature in city: 114°F on September 6, 2020
- Change in number of unusually warm fall days, 1970-2025: +39
2. El Paso, TX
- Change in average fall temperature, 1970-2025: +6.9°F (+3.9°F due to climate change)
- Average fall temperature in city (5-year mean): 69.0°F in 2025, 63.4°F in 1970
- Record-high fall temperature in city: 106°F on September 8, 2023
- Change in number of unusually warm fall days, 1970-2025: +45
1. Reno, NV
- Change in average fall temperature, 1970-2025: +7.9°F (+3.5°F due to climate change)
- Average fall temperature in city (5-year mean): 56.2°F in 2025, 50.3°F in 1970
- Record-high fall temperature in city: 106°F on September 6, 2022
- Change in number of unusually warm fall days, 1970-2025: +44
More from ClimateCrisis 247
- Fastest Warming Congressional Districts Where Politician is Funded by Fossil Fuel Industry
- America’s Best And Worst Cities To Own An EV
- Climate Change Is Increasing Simultaneous Exposure to Heat Waves and Wildfire Smoke
- Wildlife Populations Have Plunged Globally, But Some Buck the Trend





