
Major US Cities Doing the Most to Prepare for Climate Change

Climate change has, and will continue to, affect communities in every corner of the world. But climate change’s impact is by no means evenly distributed. Topography and geographic coordinates alone make some parts of the world more vulnerable to the consequences of climate change than others–but as certain cities are demonstrating, when it comes to climate change, physical location is not destiny.
Around the world, major urban areas are investing in services and infrastructure to adapt to the new realities of climate change and mitigate some of the most devastating impacts. In the United States, coastal cities from Charleston, South Carolina to San Francisco, California are building seawalls to reduce the threat of rising sea-levels and storm-surge flooding. Phoenix, Arizona, where temperatures regularly rise into the triple-digits, launched the permanent Office of Heat Response and Mitigation, a publicly-funded agency tasked with reducing the public health hazards posed by extreme heat. In Los Angeles, improved monitoring technology and construction methods are being employed to reduce wildfire risk.
Through these and other similar methods, major U.S. cities–highly-exposed or otherwise–are taking measures to reduce the threat posed by climate change.
Using data from AlphaGeo, a geo-spatial risk analytics firm, Climate Crisis 247 identified the major U.S. cities doing the most to prepare for climate change. We ranked all 10 U.S. cities with available data on the efficiency of their climate change mitigation efficiency. We also included each city’s natural vulnerability index score, and their current vulnerability index accounting for the adaptation measures they have implemented. Efficiency scores were calculated by dividing the difference in pre- and post-vulnerability hazard scores and multiplying by 100. A full methodology is available here. Supplemental data on population are five-year estimates from the U.S. Census Bureau’s 2024 American Community Survey.
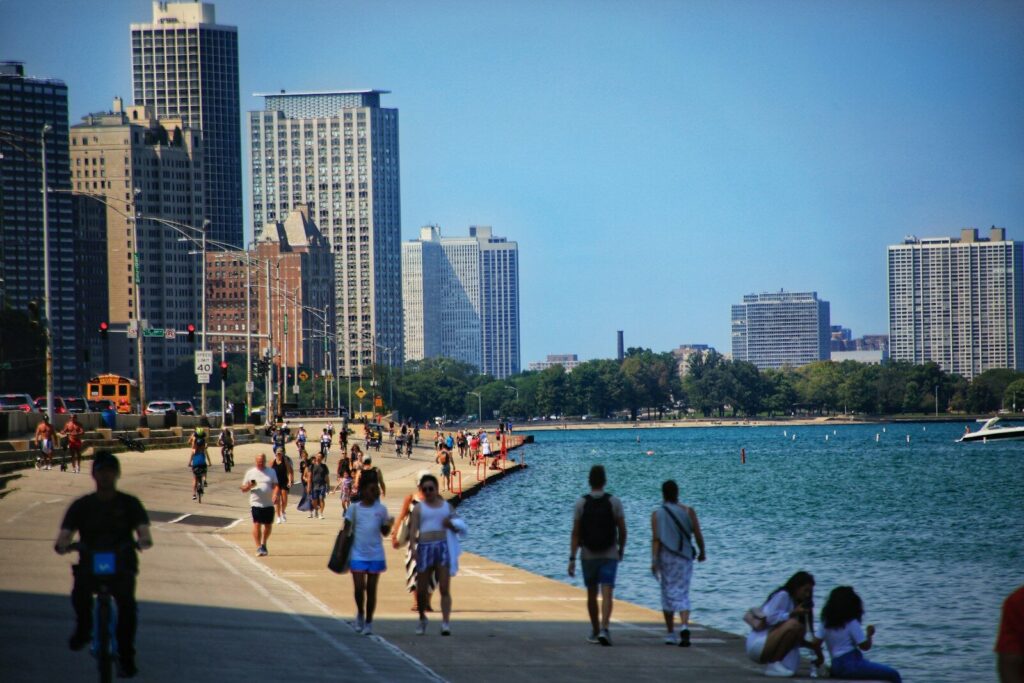
10. Chicago
- Climate change adaptation efficiency score: 33.3 out of 100
- City’s vulnerability to climate hazards with implemented adaptation measures: 8 out of 100 (4 ppt. reduction in vulnerability)
- City’s baseline vulnerability to climate hazards: 12 out of 100
- City population: 2,711,226
9. San Antonio
- Climate change adaptation efficiency score: 37.1 out of 100
- City’s vulnerability to climate hazards with implemented adaptation measures: 22 out of 100 (13 ppt. reduction in vulnerability)
- City’s baseline vulnerability to climate hazards: 35 out of 100
- City population: 1,479,835
8. Miami
- Climate change adaptation efficiency score: 38.7 out of 100
- City’s vulnerability to climate hazards with implemented adaptation measures: 19 out of 100 (12 ppt. reduction in vulnerability)
- City’s baseline vulnerability to climate hazards: 31 out of 100
- City population: 459,745
7. Houston
- Climate change adaptation efficiency score: 41.7 out of 100
- City’s vulnerability to climate hazards with implemented adaptation measures: 21 out of 100 (15 ppt. reduction in vulnerability)
- City’s baseline vulnerability to climate hazards: 36 out of 100
- City population: 2,328,253
6. Washington D.C.
- Climate change adaptation efficiency score: 43.8 out of 100
- City’s vulnerability to climate hazards with implemented adaptation measures: 18 out of 100 (14 ppt. reduction in vulnerability)
- City’s baseline vulnerability to climate hazards: 32 out of 100
- City population: 681,294
5. Dallas
- Climate change adaptation efficiency score: 44.7 out of 100
- City’s vulnerability to climate hazards with implemented adaptation measures: 21 out of 100 (17 ppt. reduction in vulnerability)
- City’s baseline vulnerability to climate hazards: 38 out of 100
- City population: 1,307,930
4. Phoenix
- Climate change adaptation efficiency score: 47.8 out of 100
- City’s vulnerability to climate hazards with implemented adaptation measures: 24 out of 100 (22 ppt. reduction in vulnerability)
- City’s baseline vulnerability to climate hazards: 46 out of 100
- City population: 1,642,323
3. Philadelphia
- Climate change adaptation efficiency score: 50.0 out of 100
- City’s vulnerability to climate hazards with implemented adaptation measures: 17 out of 100 (17 ppt. reduction in vulnerability)
- City’s baseline vulnerability to climate hazards: 34 out of 100
- City population: 1,579,706
2. New York
- Climate change adaptation efficiency score: 52.8 out of 100
- City’s vulnerability to climate hazards with implemented adaptation measures: 17 out of 100 (19 ppt. reduction in vulnerability)
- City’s baseline vulnerability to climate hazards: 36 out of 100
- City population: 8,483,844
1. Los Angeles
- Climate change adaptation efficiency score: 53.8 out of 100
- City’s vulnerability to climate hazards with implemented adaptation measures: 18 out of 100 (21 ppt. reduction in vulnerability)
- City’s baseline vulnerability to climate hazards: 39 out of 100
- City population: 3,857,263
More from ClimateCrisis 247
- The Nations Producing the Most Pollution
- The Biggest Climate Disasters Of The Last Year
- In America’s Largest Cities, October Can Bring Oppressive Heat and Frigid Cold
- America’s Worst Cities For EVs





