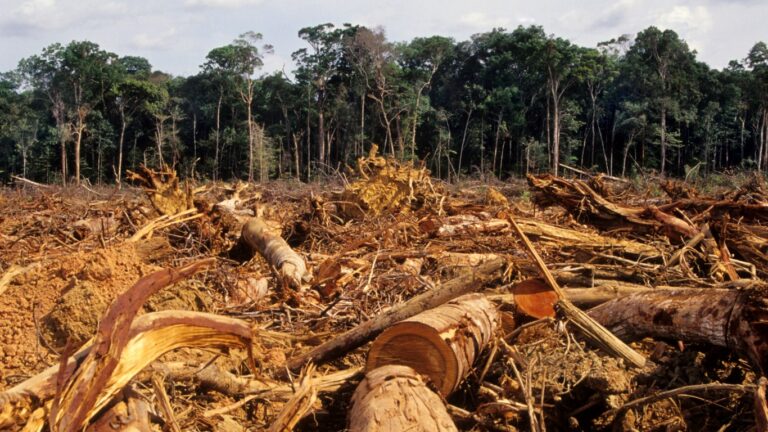
Paris Climate Agreement Signatories Cutting Emissions the Most

The 21st Convention of the Parties to the United Nations Framework Convention on Climate Change, held in Paris in late 2015, yielded a landmark international treaty aimed at reducing the pace and extent of global warming through mutual pledges among nearly 200 signatory nations to reduce greenhouse gas emissions. The Paris Climate Agreement, as it is known, was the first time in history that the international community agreed to take action to limit global warming. The Agreement may have presented a unique moment of hope for those concerned about climate change, but nearly a decade later, any optimism has been significantly diminished.
According to data from the World Bank, carbon dioxide emissions increased globally by nearly 9% between 2015 and 2024–and more heat-trapping emissions has led to continually rising temperatures. Earlier this year, the United Nations Environment Programme announced that there is no longer a realistic pathway to limit global warming to 1.5°C above pre-industrial levels, a stated goal of the Paris Agreement.
But while the Agreement may have been a collective failure, many individual countries party to it have managed to reduce their carbon footprint meaningfully.
Using data from the World Resources Institute, Climate Crisis 247 identified the Paris Climate Agreement signatories that have cut greenhouse gas emissions the most. We ranked all countries party to the Agreement on the relative change in greenhouse gas emissions per capita from 2015 to 2024. Only countries with populations of at least 1 million were considered. Supplemental data on GDP per capita is from the World Bank. It is important to note that certain countries on this list, such as the United Kingdom and Germany, achieved significant emissions reductions through deliberate policy measures, while for others, reductions were largely due to happenstance.

9. United Kingdom
- Change in per capita greenhouse gas emissions, 2015-2024: -29.1% (-2.0 metric tons per person)
- Per capita greenhouse gas emissions by year: 4.8 metric tons in 2024; 6.8 metric tons in 2015
- GDP per capita by year: +17.9% ($53,341 in 2024; $45,256 in 2015)
- Population by year: +5.7% (69,138,185 in 2024; 65,382,107 in 2015)
8. Germany
- Change in per capita greenhouse gas emissions, 2015-2024: -30.1% (-3.1 metric tons per person)
- Per capita greenhouse gas emissions by year: 7.2 metric tons in 2024; 10.3 metric tons in 2015
- GDP per capita by year: +33.8% ($56,104 in 2024; $41,930 in 2015)
- Population by year: +3.0% (84,552,234 in 2024; 82,077,546 in 2015)
7. Venezuela
- Change in per capita greenhouse gas emissions, 2015-2024: -30.7% (-2.1 metric tons per person)
- Per capita greenhouse gas emissions by year: 4.7 metric tons in 2024; 6.8 metric tons in 2015
- GDP per capita by year: +3.6% ($4,244 in 2024; $4,097 in 2015)
- Population by year: +-7.1% (28,405,544 in 2024; 30,573,968 in 2015)
6. East Timor
- Change in per capita greenhouse gas emissions, 2015-2024: -33.1% (-0.3 metric tons per person)
- Per capita greenhouse gas emissions by year: 0.7 metric tons in 2024; 1.0 metric tons in 2015
- GDP per capita by year: +0.9% ($1,332 in 2024; $1,320 in 2015)
- Population by year: +16.2% (1,400,638 in 2024; 1,205,133 in 2015)
5. Netherlands
- Change in per capita greenhouse gas emissions, 2015-2024: -33.2% (-3.4 metric tons per person)
- Per capita greenhouse gas emissions by year: 6.8 metric tons in 2024; 10.2 metric tons in 2015
- GDP per capita by year: +47.3% ($67,465 in 2024; $45,794 in 2015)
- Population by year: +6.6% (18,228,740 in 2024; 17,107,429 in 2015)
4. Finland
- Change in per capita greenhouse gas emissions, 2015-2024: -33.8% (-3.2 metric tons per person)
- Per capita greenhouse gas emissions by year: 6.3 metric tons in 2024; 9.6 metric tons in 2015
- GDP per capita by year: +24.9% ($53,156 in 2024; $42,560 in 2015)
- Population by year: +2.5% (5,617,311 in 2024; 5,479,719 in 2015)
3. Angola
- Change in per capita greenhouse gas emissions, 2015-2024: -44.4% (-1.0 metric tons per person)
- Per capita greenhouse gas emissions by year: 1.3 metric tons in 2024; 2.3 metric tons in 2015
- GDP per capita by year: +-25.3% ($2,721 in 2024; $3,642 in 2015)
- Population by year: +34.5% (37,885,854 in 2024; 28,157,802 in 2015)
2. Estonia
- Change in per capita greenhouse gas emissions, 2015-2024: -50.8% (-6.9 metric tons per person)
- Per capita greenhouse gas emissions by year: 6.7 metric tons in 2024; 13.7 metric tons in 2015
- GDP per capita by year: +77.3% ($31,428 in 2024; $17,722 in 2015)
- Population by year: +3.5% (1,360,548 in 2024; 1,314,580 in 2015)
1. Equatorial Guinea
- Change in per capita greenhouse gas emissions, 2015-2024: -52.4% (-5.7 metric tons per person)
- Per capita greenhouse gas emissions by year: 5.1 metric tons in 2024; 10.8 metric tons in 2015
- GDP per capita by year: +-22.8% ($7,004 in 2024; $9,069 in 2015)
- Population by year: +30.2% (1,892,523 in 2024; 1,453,925 in 2015)
More from ClimateCrisis 247
- LA Wildfires Exposed People To Dangerous Lead
- Cities Where Climate Change May Be Driving Gun Violence
- The Hottest Halloweens on Record in the U.S.
- Total EV Sales are Tanking in 2026 – But These Models Have YOY Growth