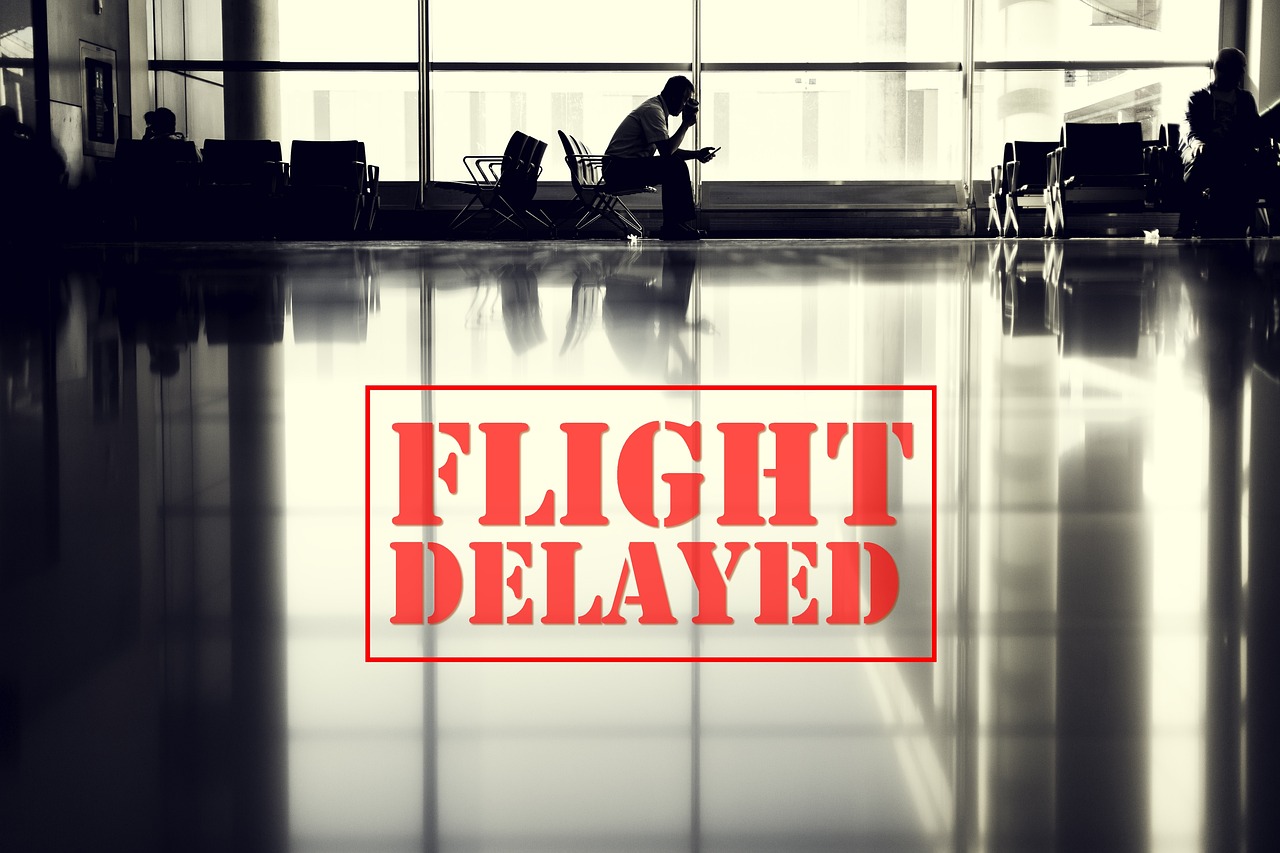
2024 Was the Worst Year for Weather Related Flight Delays in Decades
 https://climate-crisis-247-bucket.nyc3.cdn.digitaloceanspaces.com/wp-content/uploads/2025/04/07224720/3709560-150x150.jpg
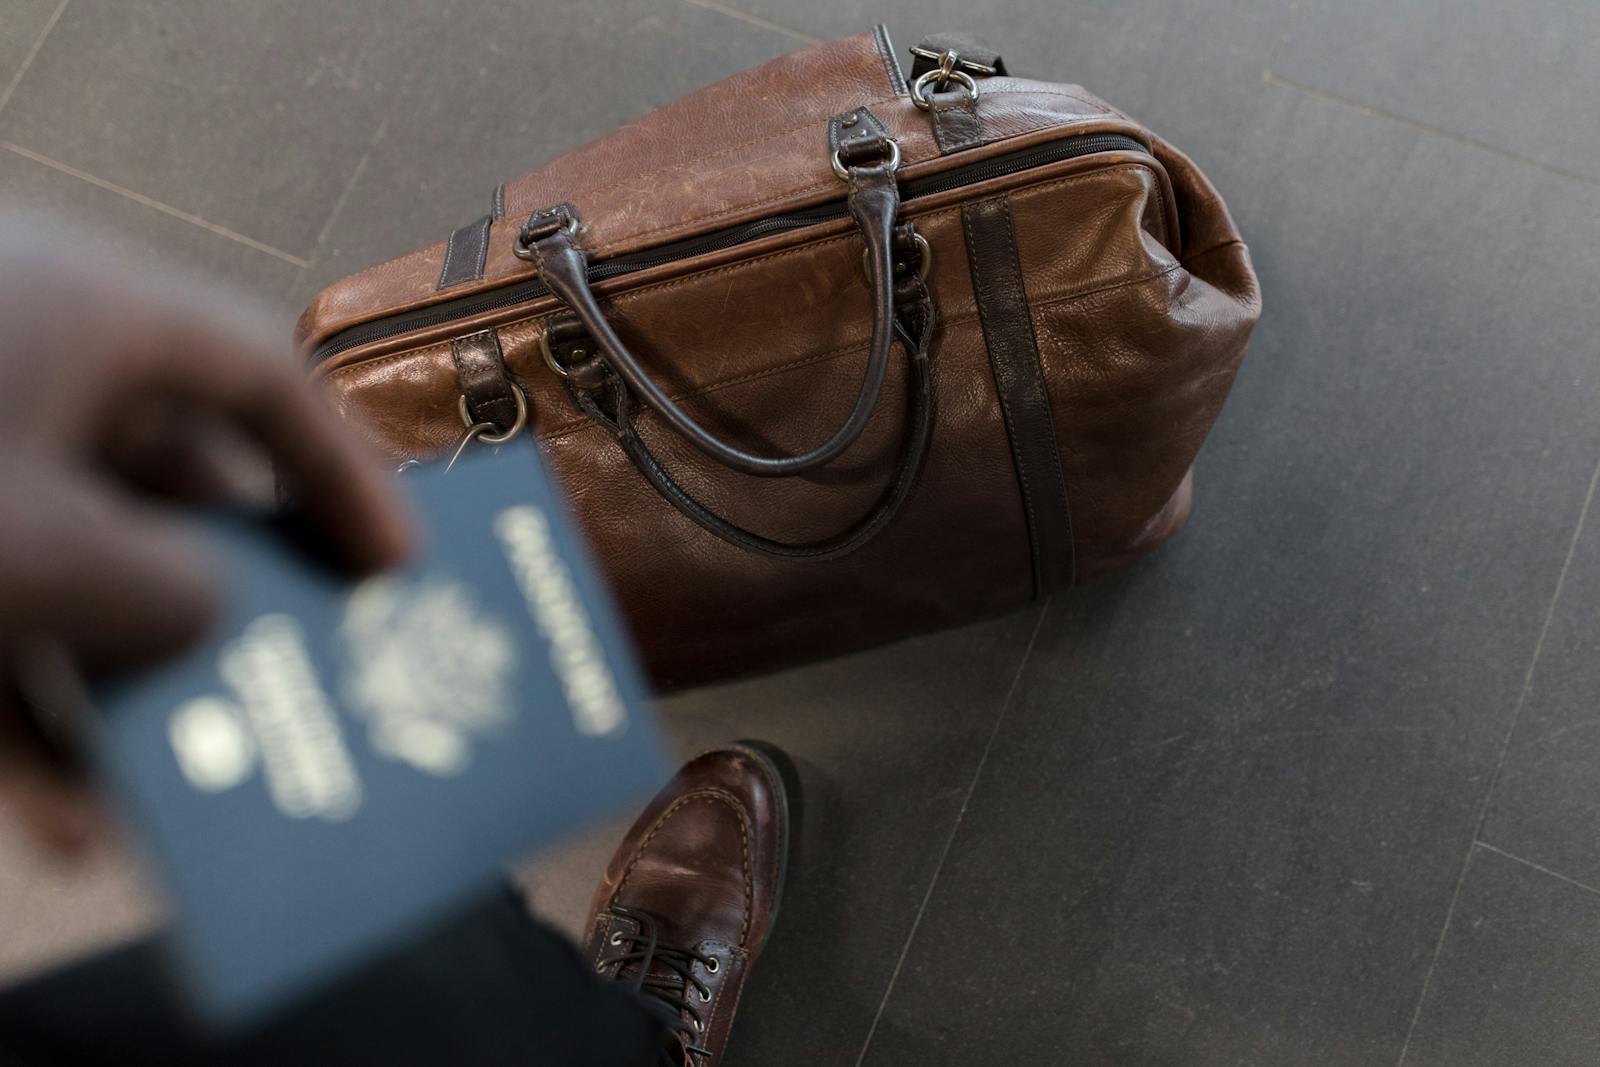
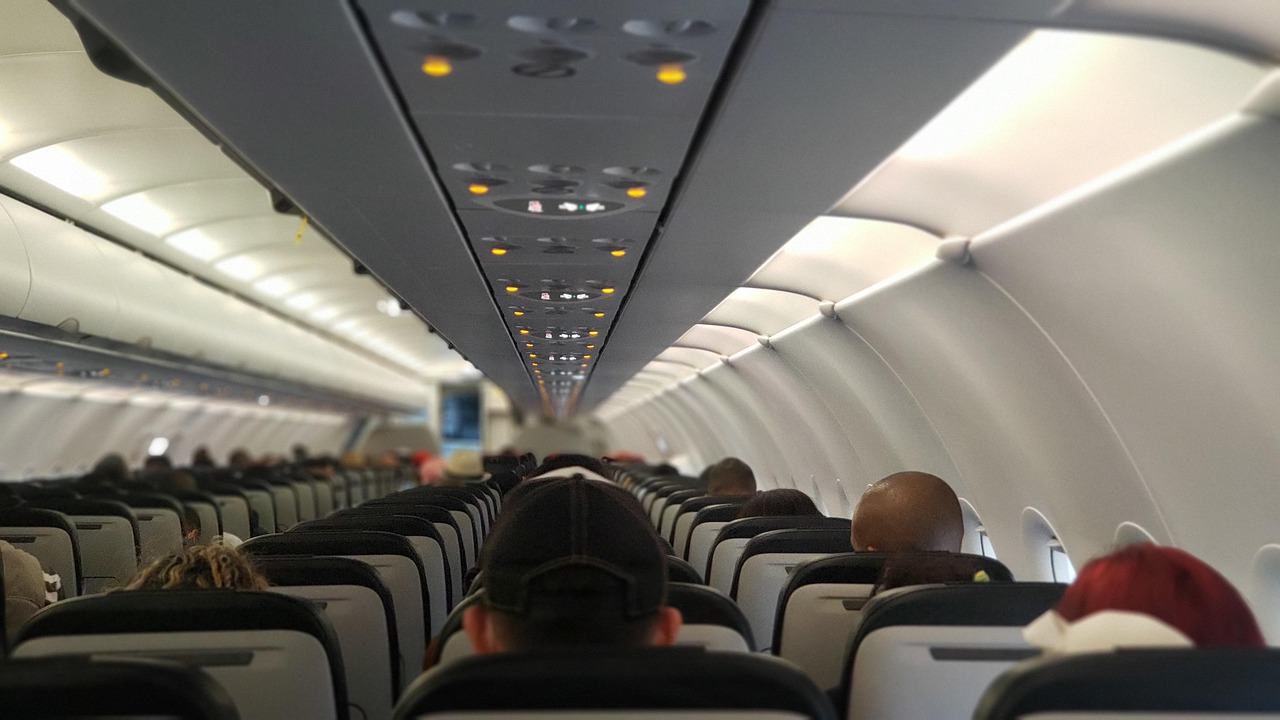
Americans travel by air at least once every year, on average. At this frequency, most adults in the United States have experienced the headache of flight delays. According to the Bureau of Transportation Statistics, for any number of reasons, about one in every five flights in the U.S. are delayed. The majority of these disruptions are attributed to problems with the airline, broader issues with the National Aviation System, or flight security. But in recent years, a growing number of flight delays and cancellations have been the direct result of extreme weather.
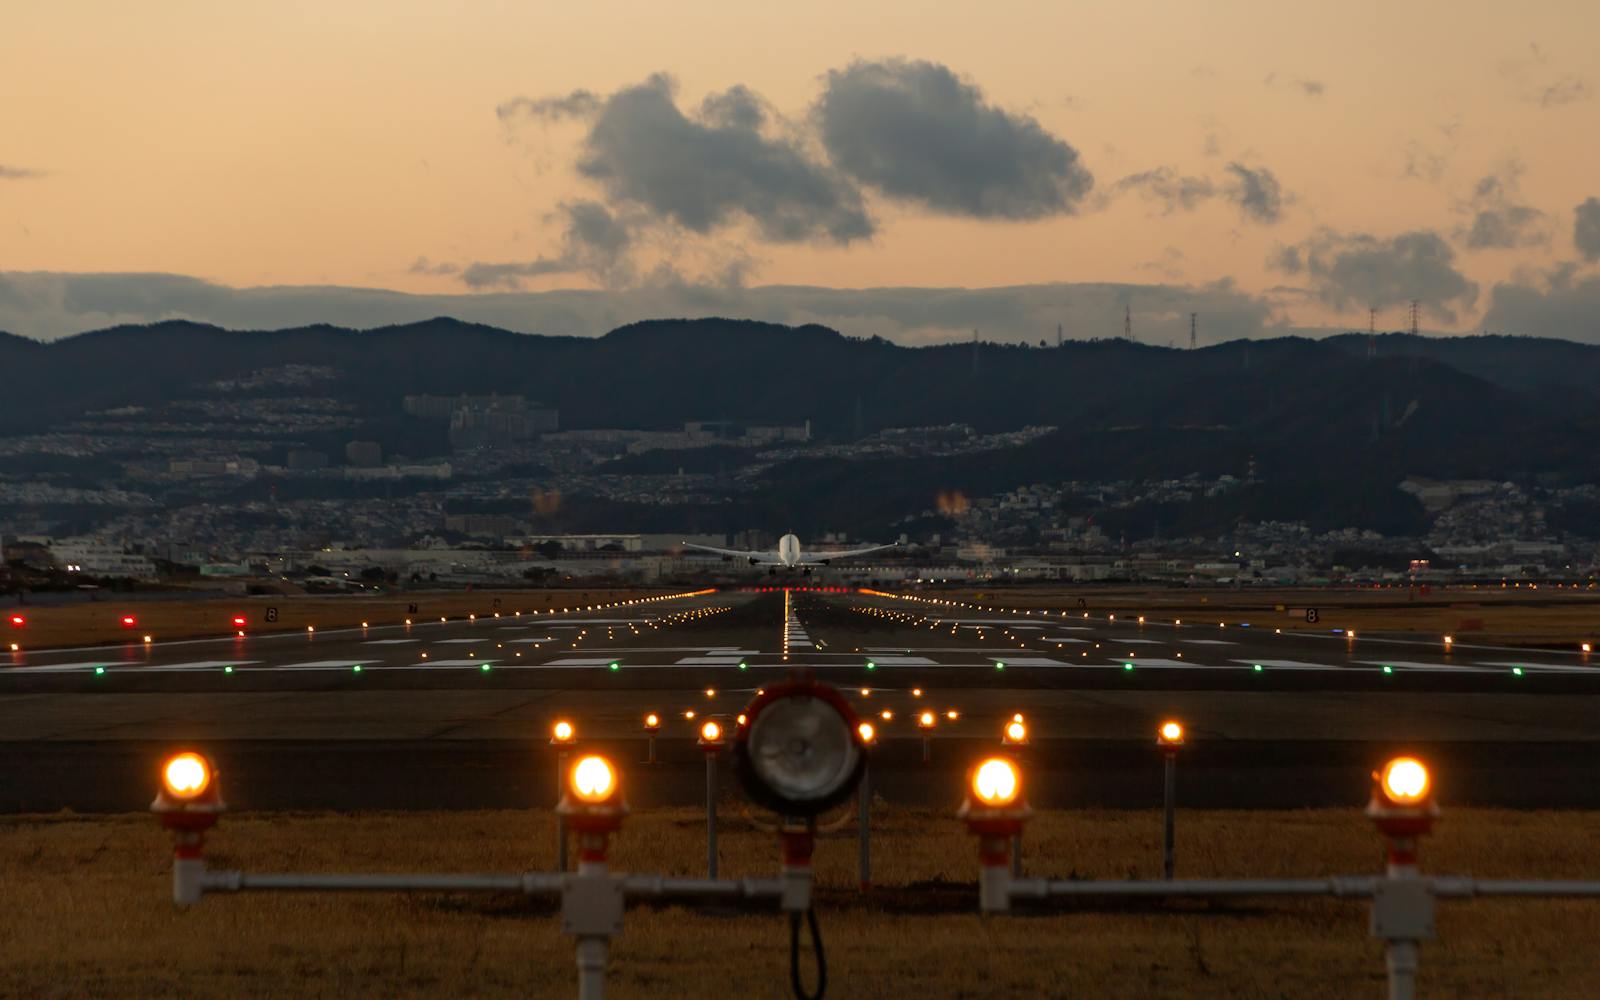
Over the last two decades, time lost to weather delays for air travelers has increased at an average annual rate of 8% in total, and by 4% when adjusting for total volume of air travel. Between 2004 and 2024, all years of available data from the BTS, the time lost to extreme weather delays ranged from about 6 hours to 15 hours per 1,000 flights annually. Notably, four of the five worst years in that time period were in the last half decade.
Using data from the BTS, Climate Crisis 247 identified the worst years for weather related flight delays. Years are ranked on the number of hours lost to extreme weather delays, adjusted for every 1,000 flights. All supplemental data in this story is also from the BTS.
As the measurable effects of climate change continue to pile up, it is likely no coincidence that weather related flight delays are becoming more common and more severe. Each of the last nine years are among the 10 hottest years on record, including 2024 and 2023, which rank as the hottest and second hottest years in history, respectively. These warming trends can contribute to increased frequency and severity of extreme weather events. Indeed, the number of natural disasters resulting in at least $1 billion in damage in the U.S. nearly doubled from the decade ending in 2009 to the decade ending in 2019, adjusting for inflation.
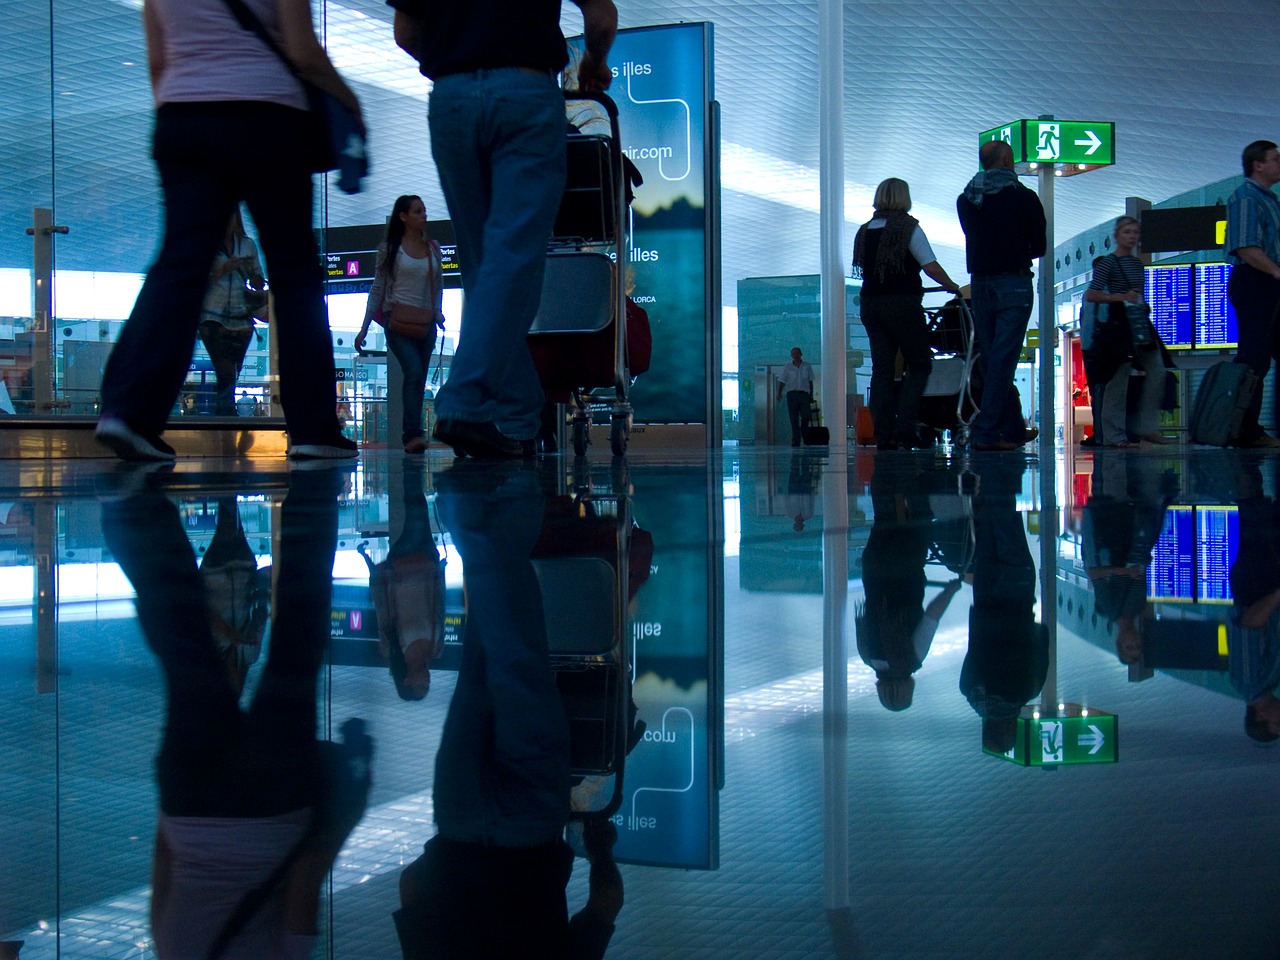
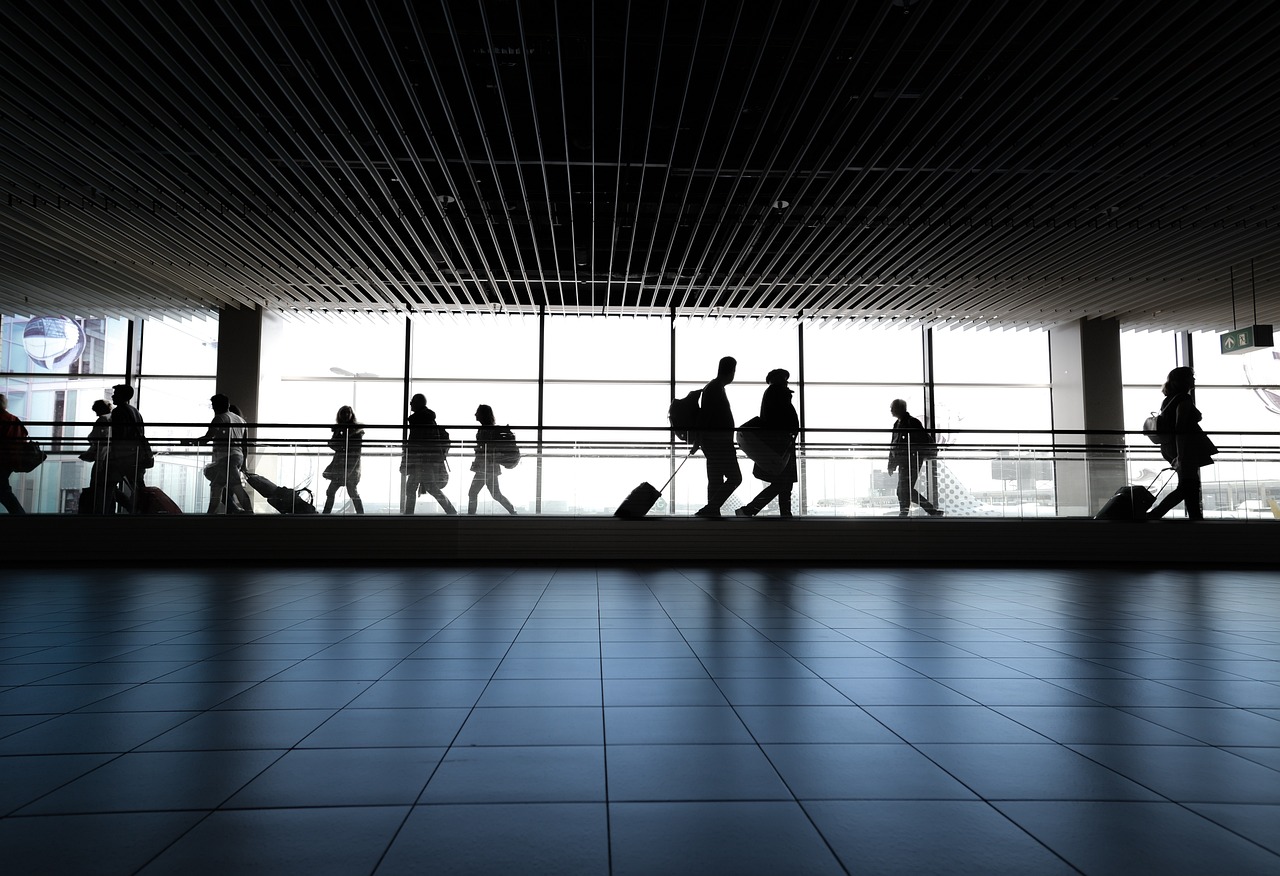
While disruptions to air travel are by no means the most harmful manifestations of climate change, they are not insignificant. Weather related delays have ripple effects across the domestic air travel network, at the expense of not only passengers’ time, but also the finances of airlines and businesses. According to some estimates, air travel delays cost the U.S. economy over $30 billion annually – and recent trends suggest these costs will only continue to rise in the coming years.
21. 2012

- Weather delays for air travel during year: 6.2 hours per 1,000 flights (37,997 total hours)
- Total number of flights delayed by weather: 28,799 (0.5% of all flights)
- Average length of weather delays: 1.3 hours
- Worst month for weather related air travel delays in 2012: July, 11.6 hours per 1,000 flights (6,336 total hours)
- Best month for weather related air travel delays in 2012: October, 2.9 hours per 1,000 flights (1,498 total hours
20. 2020
- Weather delays for air travel during year: 6.8 hours per 1,000 flights (33,911 total hours)
- Total number of flights delayed by weather: 21,039 (0.4% of all flights)
- Average length of weather delays: 1.6 hours
- Worst month for weather related air travel delays in 2020: January, 10.3 hours per 1,000 flights (6,791 total hours)
- Best month for weather related air travel delays in 2020: April, 1.3 hours per 1,000 flights (444 total hours)
19. 2011
- Weather delays for air travel during year: 7.0 hours per 1,000 flights (42,640 total hours)
- Total number of flights delayed by weather: 30,963 (0.5% of all flights)
- Average length of weather delays: 1.4 hours
- Worst month for weather related air travel delays in 2011: May, 11.0 hours per 1,000 flights (5,746 total hours)
- Best month for weather related air travel delays in 2011: November, 2.7 hours per 1,000 flights (1,279 total hours)
18. 2010
- Weather delays for air travel during year: 7.2 hours per 1,000 flights (46,420 total hours)
- Total number of flights delayed by weather: 35,854 (0.6% of all flights)
- Average length of weather delays: 1.3 hours
- Worst month for weather related air travel delays in 2010: February, 10.6 hours per 1,000 flights (5,135 total hours)
- Best month for weather related air travel delays in 2010: November, 3.5 hours per 1,000 flights (1,833 total hours)
17. 2016
- Weather delays for air travel during year: 7.7 hours per 1,000 flights (43,435 total hours)
- Total number of flights delayed by weather: 28,658 (0.5% of all flights)
- Average length of weather delays: 1.5 hours
- Worst month for weather related air travel delays in 2016: July, 14.1 hours per 1,000 flights (7,076 total hours)
- Best month for weather related air travel delays in 2016: October, 2.3 hours per 1,000 flights (1,084 total hours)
16. 2013
- Weather delays for air travel during year: 7.8 hours per 1,000 flights (49,569 total hours)
- Total number of flights delayed by weather: 36,817 (0.6% of all flights)
- Average length of weather delays: 1.3 hours
- Worst month for weather related air travel delays in 2013: June, 15.4 hours per 1,000 flights (8,481 total hours)
- Best month for weather related air travel delays in 2013: October, 2.4 hours per 1,000 flights (1,301 total hours)
15. 2017
- Weather delays for air travel during year: 8.2 hours per 1,000 flights (46,663 total hours)
- Total number of flights delayed by weather: 28,581 (0.5% of all flights)
- Average length of weather delays: 1.6 hours
- Worst month for weather related air travel delays in 2017: April, 13.0 hours per 1,000 flights (6,094 total hours)
- Best month for weather related air travel delays in 2017: November, 2.8 hours per 1,000 flights (1,271 total hours)
14. 2009
- Weather delays for air travel during year: 8.5 hours per 1,000 flights (54,840 total hours)
- Total number of flights delayed by weather: 41,865 (0.7% of all flights)
- Average length of weather delays: 1.3 hours
- Worst month for weather related air travel delays in 2009: January, 13.9 hours per 1,000 flights (7,365 total hours)
- Best month for weather related air travel delays in 2009: November, 2.4 hours per 1,000 flights (1,201 total hours)
13. 2014
- Weather delays for air travel during year: 8.6 hours per 1,000 flights (49,811 total hours)
- Total number of flights delayed by weather: 35,035 (0.6% of all flights)
- Average length of weather delays: 1.4 hours
- Worst month for weather related air travel delays in 2014: January, 20.4 hours per 1,000 flights (9,634 total hours)
- Best month for weather related air travel delays in 2014: October, 4.5 hours per 1,000 flights (2,202 total hours)
12. 2015
- Weather delays for air travel during year: 8.9 hours per 1,000 flights (51,671 total hours)
- Total number of flights delayed by weather: 36,037 (0.6% of all flights)
- Average length of weather delays: 1.4 hours
- Worst month for weather related air travel delays in 2015: February, 16.0 hours per 1,000 flights (6,854 total hours)
- Best month for weather related air travel delays in 2015: October, 3.7 hours per 1,000 flights (1,820 total hours)
11. 2005
- Weather delays for air travel during year: 11.0 hours per 1,000 flights (78,563 total hours)
- Total number of flights delayed by weather: 66,682 (0.9% of all flights)
- Average length of weather delays: 1.2 hours
- Worst month for weather related air travel delays in 2005: July, 19.3 hours per 1,000 flights (12,132 total hours)
- Best month for weather related air travel delays in 2005: September, 5.8 hours per 1,000 flights (3,335 total hours)
10. 2008
- Weather delays for air travel during year: 11.0 hours per 1,000 flights (77,229 total hours)
- Total number of flights delayed by weather: 56,639 (0.8% of all flights)
- Average length of weather delays: 1.4 hours
- Worst month for weather related air travel delays in 2008: February, 22.9 hours per 1,000 flights (12,466 total hours)
- Best month for weather related air travel delays in 2008: October, 3.1 hours per 1,000 flights (1,752 total hours)
9. 2006
- Weather delays for air travel during year: 11.3 hours per 1,000 flights (80,897 total hours)
- Total number of flights delayed by weather: 66,538 (0.9% of all flights)
- Average length of weather delays: 1.2 hours
- Worst month for weather related air travel delays in 2006: June, 16.9 hours per 1,000 flights (10,141 total hours)
- Best month for weather related air travel delays in 2006: April, 7.8 hours per 1,000 flights (4,562 total hours)
8. 2018
- Weather delays for air travel during year: 11.3 hours per 1,000 flights (88,913 total hours)
- Total number of flights delayed by weather: 50,905 (0.7% of all flights)
- Average length of weather delays: 1.7 hours
- Worst month for weather related air travel delays in 2018: July, 15.7 hours per 1,000 flights (11,052 total hours)
- Best month for weather related air travel delays in 2018: March, 6.6 hours per 1,000 flights (4,369 total hours)
7. 2004
- Weather delays for air travel during year: 11.8 hours per 1,000 flights (83,958 total hours)
- Total number of flights delayed by weather: 71,606 (1.0% of all flights)
- Average length of weather delays: 1.2 hours
- Worst month for weather related air travel delays in 2004: June, 19.9 hours per 1,000 flights (11,708 total hours)
- Best month for weather related air travel delays in 2004: April, 5.5 hours per 1,000 flights (3,198 total hours)
6. 2019
- Weather delays for air travel during year: 11.8 hours per 1,000 flights (95,328 total hours)
- Total number of flights delayed by weather: 50,132 (0.6% of all flights)
- Average length of weather delays: 1.9 hours
- Worst month for weather related air travel delays in 2019: February, 17.8 hours per 1,000 flights (10,388 total hours)
- Best month for weather related air travel delays in 2019: November, 6.3 hours per 1,000 flights (4,156 total hours)
5. 2023
- Weather delays for air travel during year: 12.5 hours per 1,000 flights (90,936 total hours)
- Total number of flights delayed by weather: 49,702 (0.7% of all flights)
- Average length of weather delays: 1.8 hours
- Worst month for weather related air travel delays in 2023: July, 21.5 hours per 1,000 flights (13,752 total hours)
- Best month for weather related air travel delays in 2023: November, 5.2 hours per 1,000 flights (3,107 total hours)
4. 2007
- Weather delays for air travel during year: 12.8 hours per 1,000 flights (95,755 total hours)
- Total number of flights delayed by weather: 72,307 (1.0% of all flights)
- Average length of weather delays: 1.3 hours
- Worst month for weather related air travel delays in 2007: June, 21.3 hours per 1,000 flights (13,387 total hours)
- Best month for weather related air travel delays in 2007: November, 5.6 hours per 1,000 flights (3,387 total hours)
3. 2022
- Weather delays for air travel during year: 13.0 hours per 1,000 flights (90,883 total hours)
- Total number of flights delayed by weather: 52,706 (0.8% of all flights)
- Average length of weather delays: 1.7 hours
- Worst month for weather related air travel delays in 2022: December, 22.8 hours per 1,000 flights (13,162 total hours)
- Best month for weather related air travel delays in 2022: October, 6.2 hours per 1,000 flights (3,701 total hours)
2. 2021
- Weather delays for air travel during year: 13.0 hours per 1,000 flights (82,105 total hours)
- Total number of flights delayed by weather: 46,632 (0.7% of all flights)
- Average length of weather delays: 1.8 hours
- Worst month for weather related air travel delays in 2021: February, 25.5 hours per 1,000 flights (8,935 total hours)
- Best month for weather related air travel delays in 2021: November, 4.2 hours per 1,000 flights (2,440 total hours)
1. 2024

- Weather delays for air travel during year: 15.0 hours per 1,000 flights (113,273 total hours)
- Total number of flights delayed by weather: 57,622 (0.8% of all flights)
- Average length of weather delays: 2.0 hours
- Worst month for weather related air travel delays in 2024: January, 30.9 hours per 1,000 flights (17,999 total hours)
- Best month for weather related air travel delays in 2024: October, 4.4 hours per 1,000 flights (2,865 total hours)