Kerr County, Guadalupe River, and the Cities Where Flooding Is at Historic Extremes Right Now
 https://climate-crisis-247-bucket.nyc3.cdn.digitaloceanspaces.com/wp-content/uploads/2025/07/07213201/Historic-percentiles-for-current-streamflow-observations-150x150.png
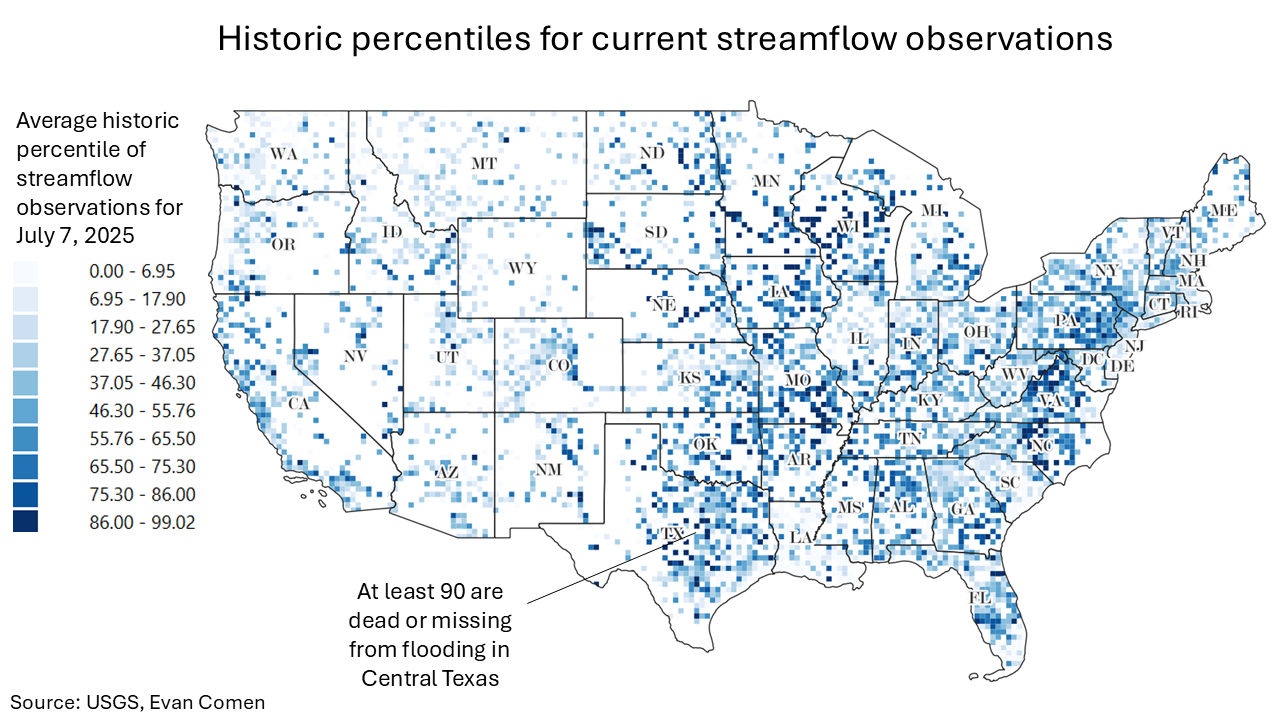
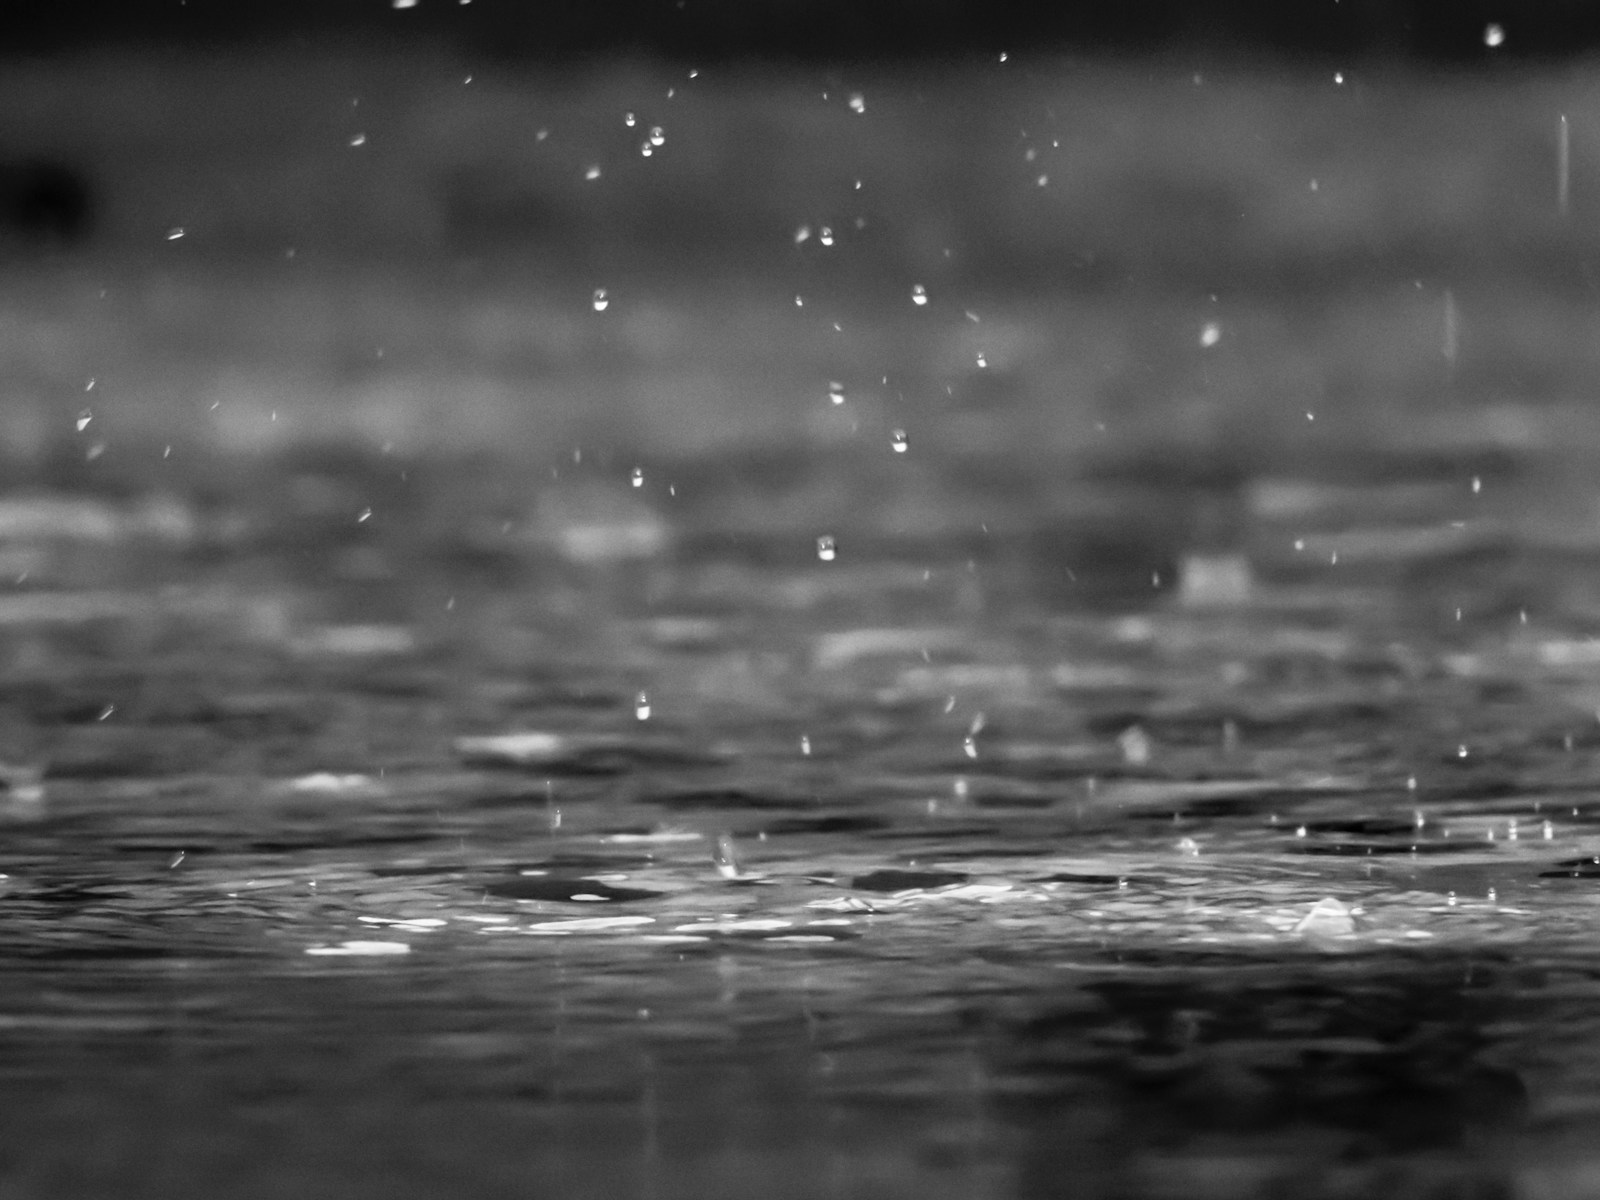
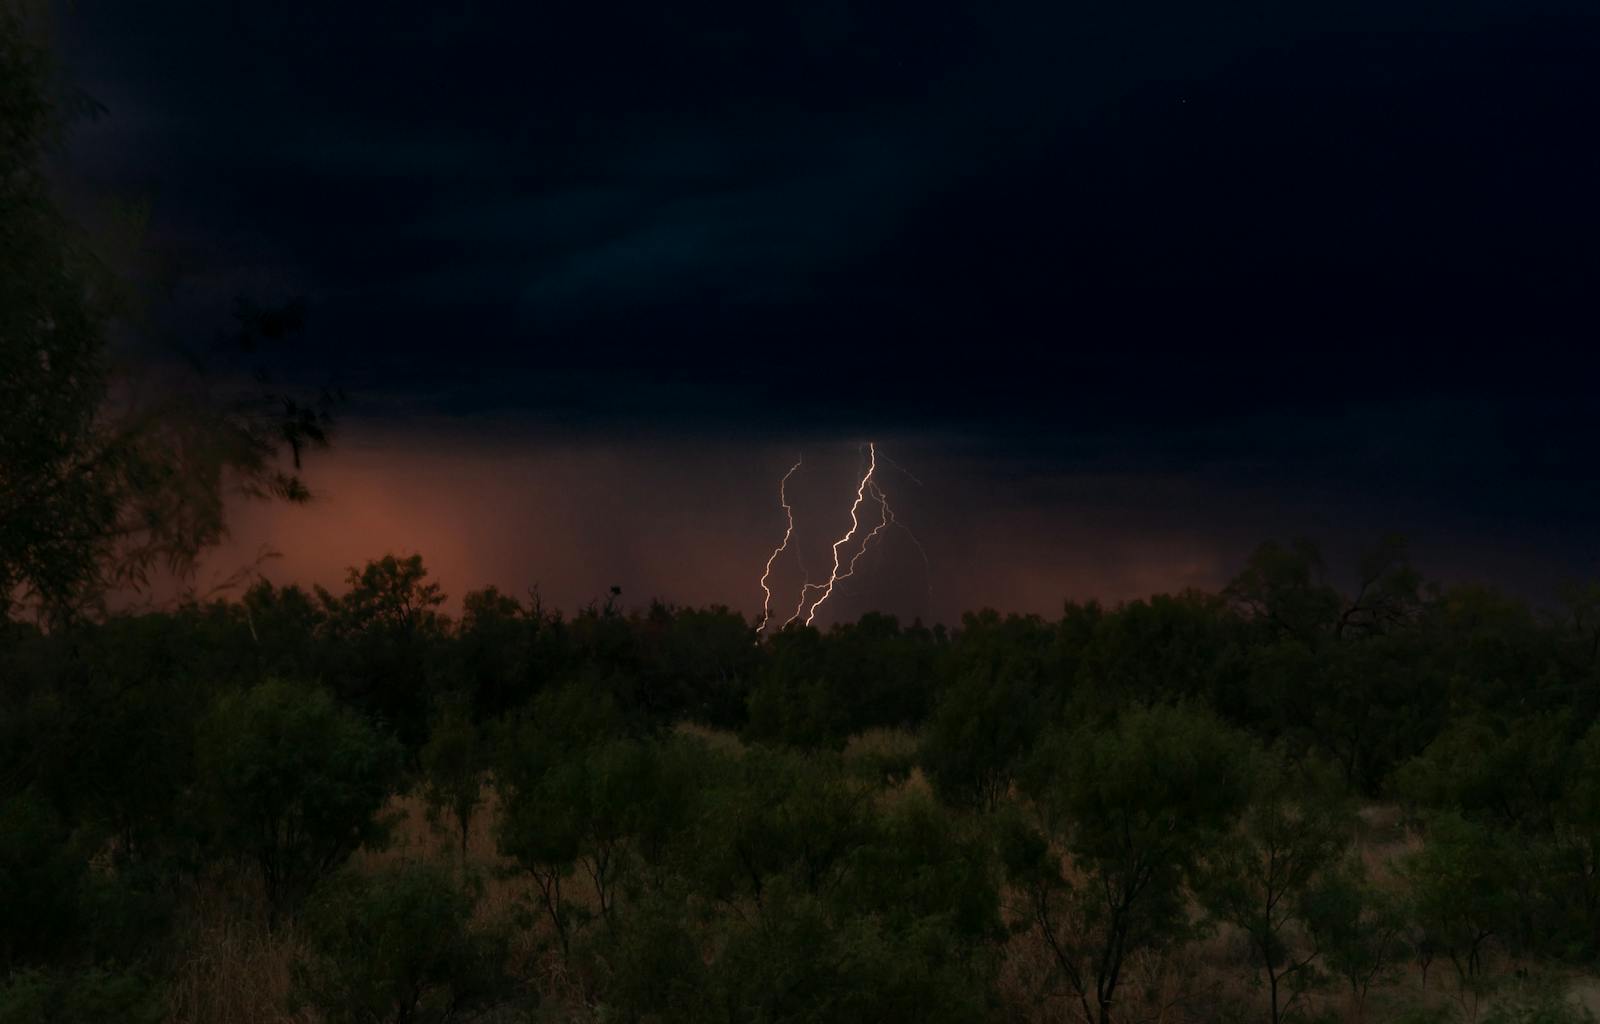
Over the holiday weekend, a catastrophic flash flood swept through Central Texas, leaving at least 80 people dead and more than a dozen missing after torrential rains sent rivers surging over their banks within a matter of hours. While rescue efforts are ongoing, the event has quickly become one of the deadliest disasters in Texas history, with the full extent of the damage unfolding by the minute.
Extra charge? The EVs That Could Lose Their $7,500 Tax Credit
Running dry? The 10 Cities Facing Emergency Drought Conditions, Water Crises
On the East Coast, tropical storm Chantal made landfall in South Carolina on Sunday, delivering up to 10 inches of rainfall as it moved inland. The tropical depression is heading northeast, where it will bring several inches of precipitation to parts of Maryland and New Jersey.
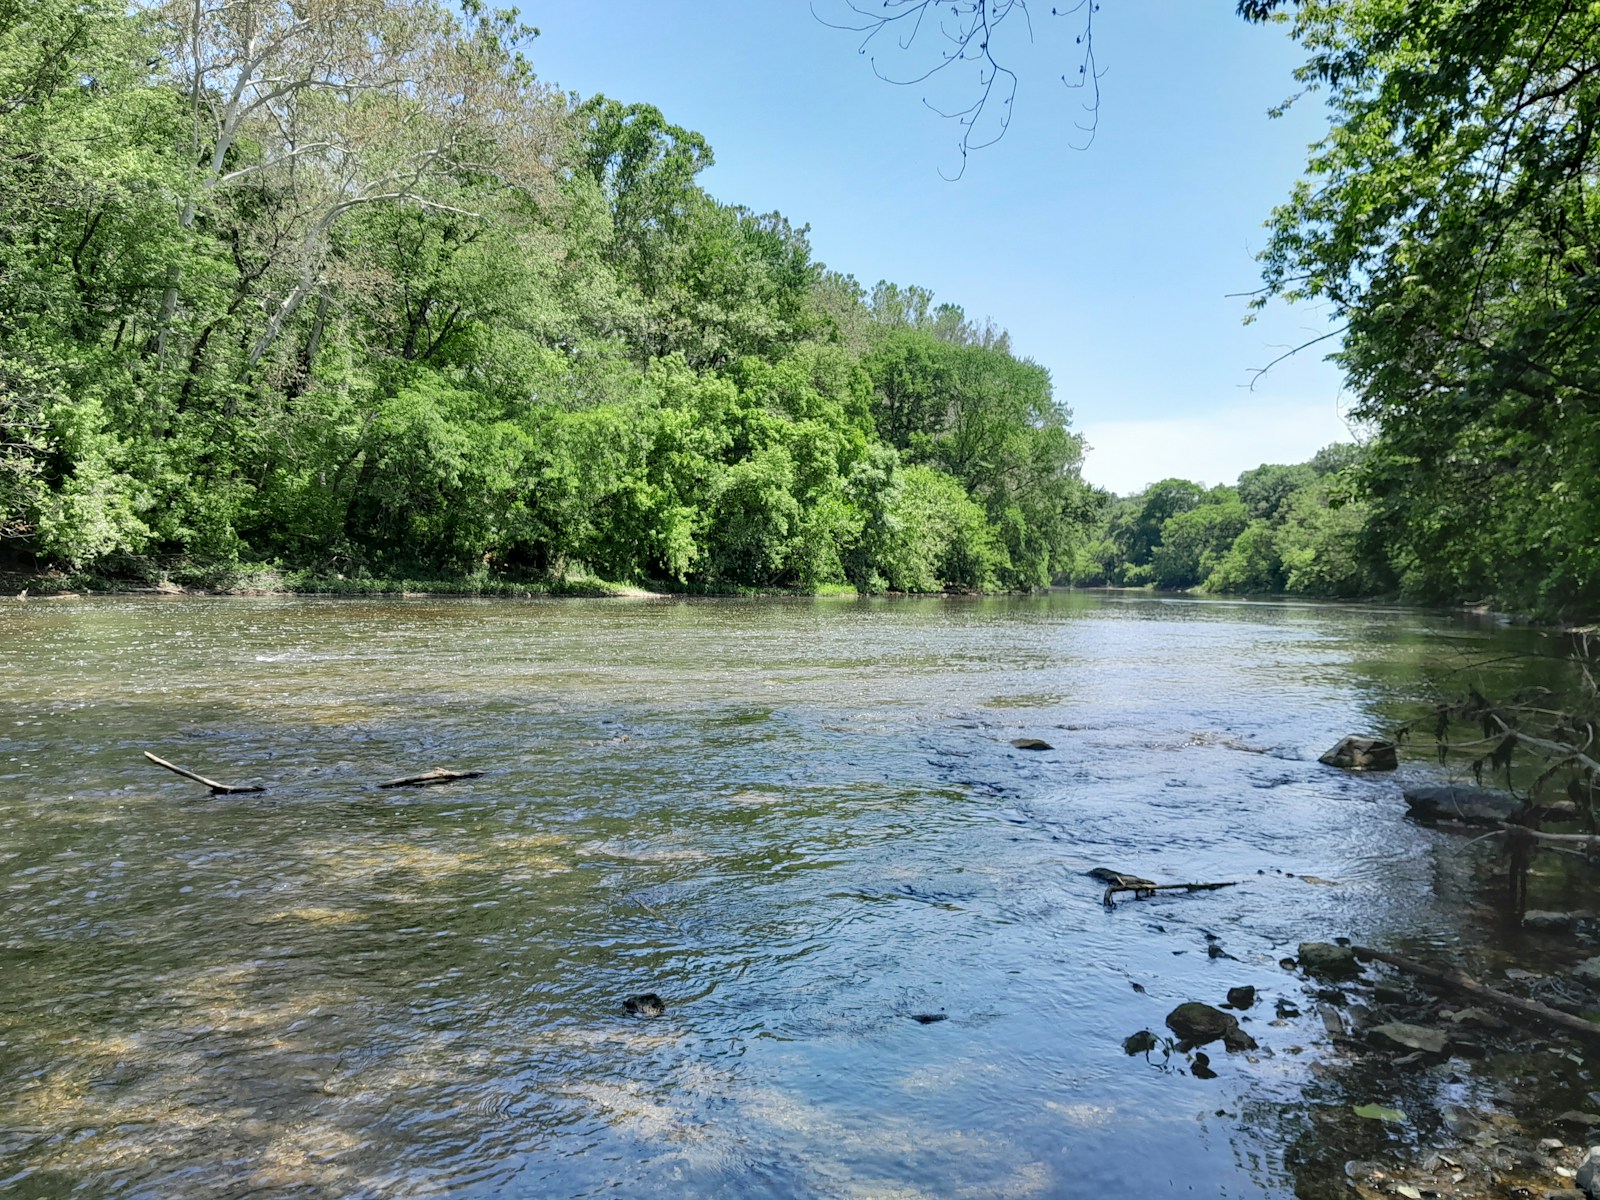
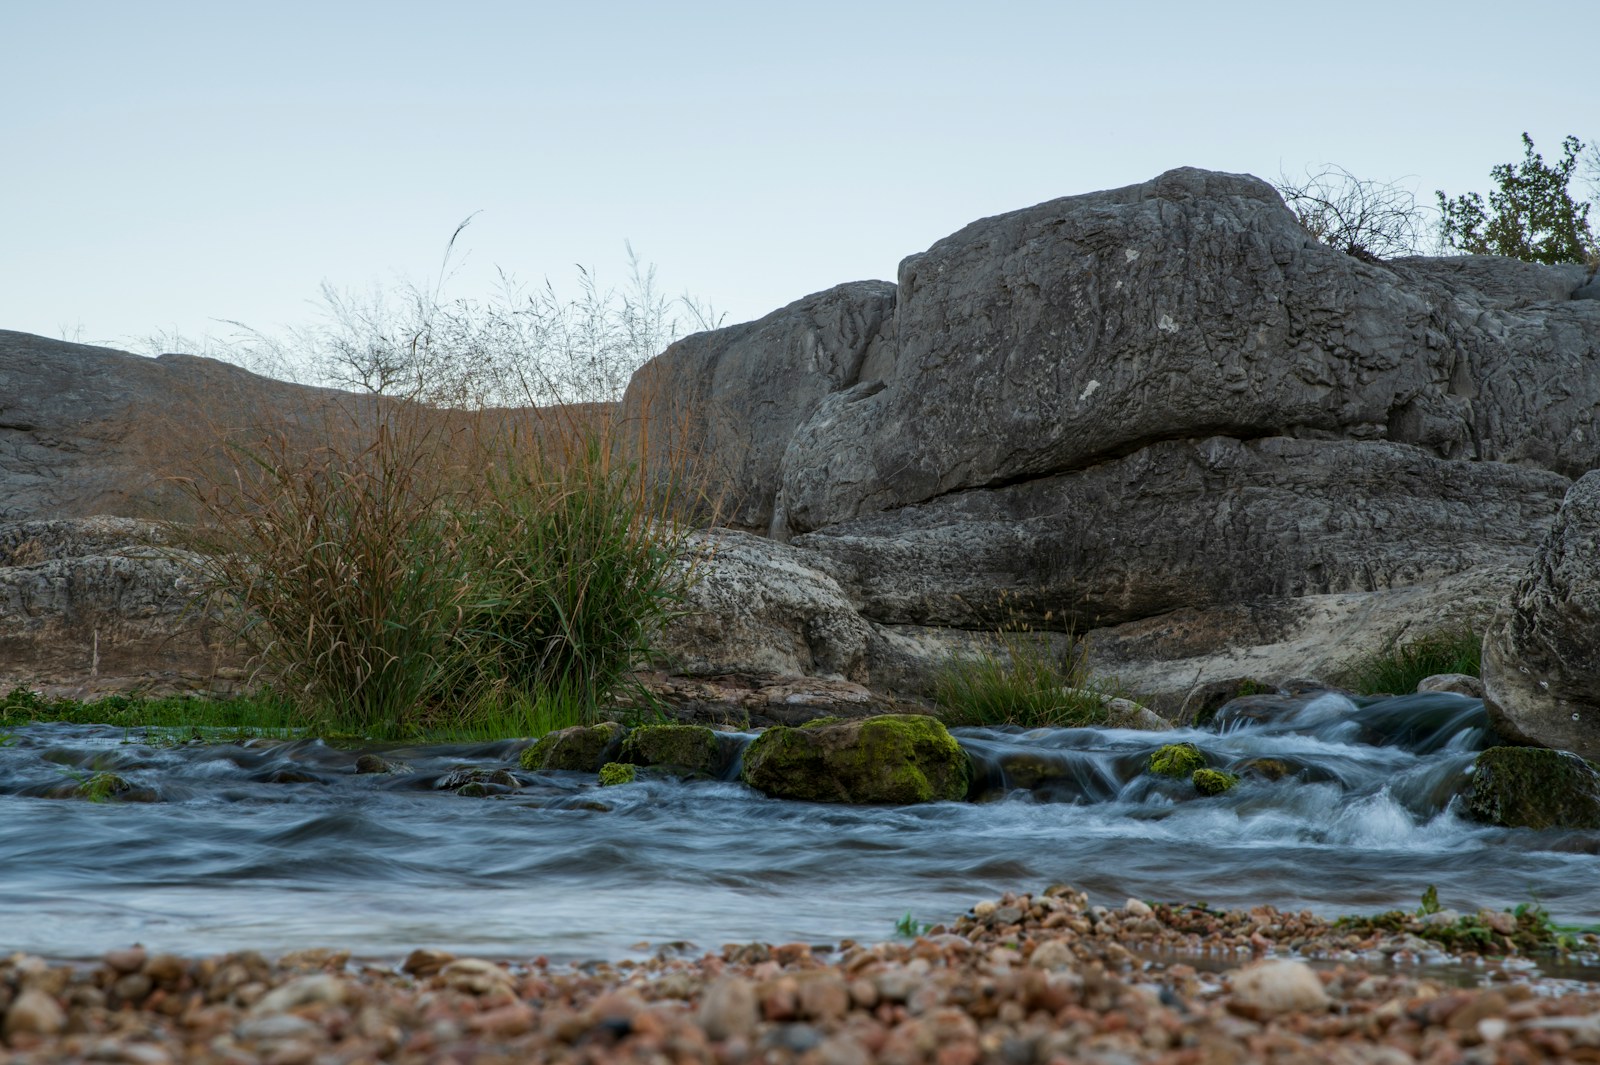
The dual extreme rainfall events are causing unprecedented flood activity in large swaths of the country. There are currently 124 counties under flood watches from the National Weather Service, representing more than 24 million Americans. Streamflow levels are at or near record highs in dozens of rivers, with water levels multiple feet above flooding thresholds. A closer look at real-time data from the U.S. Geological Survey reveals the places where flooding is at historic extremes right now.
To determine where flooding is at historic extremes right now, Climate Crisis 247 reviewed data on current flooding observations from the U.S. Geological Survey. Stations were ranked based on the historic percentile of current streamflow for July 7, 2025. Stations where current streamflow conditions are in the highest percentile – meaning where streamflow levels are at their most record-breaking – were ranked highest. Supplemental data on current water levels and flooding thresholds are also from the USGS. Station locations were paired to Census Bureau places using nearest neighbor analysis.
20. South Fork San Gabriel River at Georgetown, TX (Williamson County)

- Current streamflow: 1,020 cubic feet per second (98.25th percentile)
- Current water level: 4.79 feet
- Flooding threshold: 9.00 feet
19. Flat Creek at Fayetteville, NC (Cumberland County)
- Current streamflow: 44 cubic feet per second (98.25th percentile)
- Current water level: 1.66 feet
- Flooding threshold: 7.00 feet
18. Chickahominy River at New Kent, VA (New Kent County)

- Current streamflow: 561 cubic feet per second (98.27th percentile)
- Current water level: 7.02 feet
- Flooding threshold: 9.00 feet
17. San Saba River at San Saba, TX (San Saba County)
- Current streamflow: 2,480 cubic feet per second (98.28th percentile)
- Current water level: 10.60 feet
- Flooding threshold: 24.00 feet
16. Guadalupe River at Ingram, TX (Kerr County)
- Current streamflow: 504 cubic feet per second (98.33th percentile)
- Current water level: 8.95 feet
- Flooding threshold: 10.00 feet
15. Eno River at Durham, NC (Durham County)
- Current streamflow: 12,300 cubic feet per second (98.36th percentile)
- Current water level: 22.11 feet
- Flooding threshold: 20.00 feet
14. North Bosque River at Valley Mills, TX (Bosque County)
- Current streamflow: 6,340 cubic feet per second (98.41nd percentile)
- Current water level: 14.96 feet
- Flooding threshold: 36.00 feet
13. Flat River Dam at Durham, NC (Durham County)
- Current streamflow: 14,100 cubic feet per second (98.57th percentile)
- Current water level: 18.70 feet
- Flooding threshold: 16.00 feet
12. Little River at Biscoe, NC (Montgomery County)
- Current streamflow: 447 cubic feet per second (98.59th percentile)
- Current water level: 3.39 feet
- Flooding threshold: 14.00 feet
11. Cowhouse Creek at Copperas Cove, TX (Coryell County)
- Current streamflow: 7,830 cubic feet per second (98.65th percentile)
- Current water level: 15.96 feet
- Flooding threshold: 20.00 feet
10. South Loup River at Howard City (Boelus), NE (Howard County)
- Current streamflow: 907 cubic feet per second (98.77th percentile)
- Current water level: 3.94 feet
- Flooding threshold: 9.50 feet
9. Turtle Creek at Clinton, WI (Rock County)
- Current streamflow: 760 cubic feet per second (98.82rd percentile)
- Current water level: 5.76 feet
- Flooding threshold: 8.00 feet
8. Drowning Creek at Aberdeen, NC (Moore County)
- Current streamflow: 1,290 cubic feet per second (98.82rd percentile)
- Current water level: 6.53 feet
- Flooding threshold: 8.00 feet
7. Pedernales River at Johnson City, TX (Blanco County)
- Current streamflow: 2,420 cubic feet per second (98.84th percentile)
- Current water level: 11.67 feet
- Flooding threshold: 14.00 feet
6. Deep River at Moncure, NC (Chatham County)
- Current streamflow: 44,000 cubic feet per second (98.94th percentile)
- Current water level: 12.42 feet
- Flooding threshold: 9.00 feet
5. Haw River at Graham, NC (Alamance County)
- Current streamflow: 24,800 cubic feet per second (98.96th percentile)
- Current water level: 27.04 feet
- Flooding threshold: 18.00 feet
4. Flat River at Rougemont, NC (Durham County)
- Current streamflow: 18,200 cubic feet per second (98.99th percentile)
- Current water level: 13.64 feet
- Flooding threshold: 12.00 feet
3. North Bosque River at Clifton, TX (Bosque County)
- Current streamflow: 5,400 cubic feet per second (99.01nd percentile)
- Current water level: 8.51 feet
- Flooding threshold: 23.00 feet
2. Deep River at Ramseur, NC (Randolph County)

- Current streamflow: 3,070 cubic feet per second (99.02rd percentile)
- Current water level: 6.11 feet
- Flooding threshold: 20.00 feet
1. Minnesota River at Montevideo, MN (Chippewa County)
- Current streamflow: 13,500 cubic feet per second (99.12rd percentile)
- Current water level: 17.03 feet
- Flooding threshold: 14.00 feet