
21 Cities Being Swamped With Rain This Year
 https://climate-crisis-247-bucket.nyc3.cdn.digitaloceanspaces.com/wp-content/uploads/2025/07/07213048/1530423-1-150x150.jpeg
Rising temperatures are the most direct consequence of climate change – and warming trends have been all too evident in recent years, as each of the 10 hottest years on record globally have been reported in the last decade. Hotter climates also have knock-on effects, however, and one of them is increased precipitation, in the form of rain, hail, or snow.
Higher temperatures intensify the evaporation process, which in turn, pumps more moisture into Earth’s atmosphere. As a result, certain parts of the United States will be subjected to more frequent and more intense storms that will drop greater volumes of precipitation as the planet warms. Increasing levels of precipitation put many parts of the country at higher risk of flooding, as more rain and water from snowmelt can cause rivers to swell and inundate low-elevation areas. Recently, catastrophic flooding in Central Texas has claimed over 100 lives, demonstrating the real and growing threat posed by a warming planet and excessive rainfall.
Fortunately, average precipitation levels have been closely in line with historic norms across the United States so far in 2025. But, as the recent tragedy along the Guadalupe River in Texas suggests, national averages do not tell the whole story. In cities and towns across the country, precipitation levels have already exceeded baseline averages by several inches this year.
Using data from the National Atmospheric and Oceanic Administration, Climate Crisis 247 identified the U.S. cities where the volume of precipitation is already well above average in 2025. We reviewed data for over 200 cities, towns, and places in the U.S. and ranked them on the difference between total precipitation so far this year, and their local baseline average level of precipitation. Only places where total precipitation in 2025 exceeds the baseline by at least 5 inches are listed. Baseline precipitation, as classified by NOAA, are average precipitation totals over the months of January through May each year from 1991 through 2020.
21. Fort Smith, Arkansas
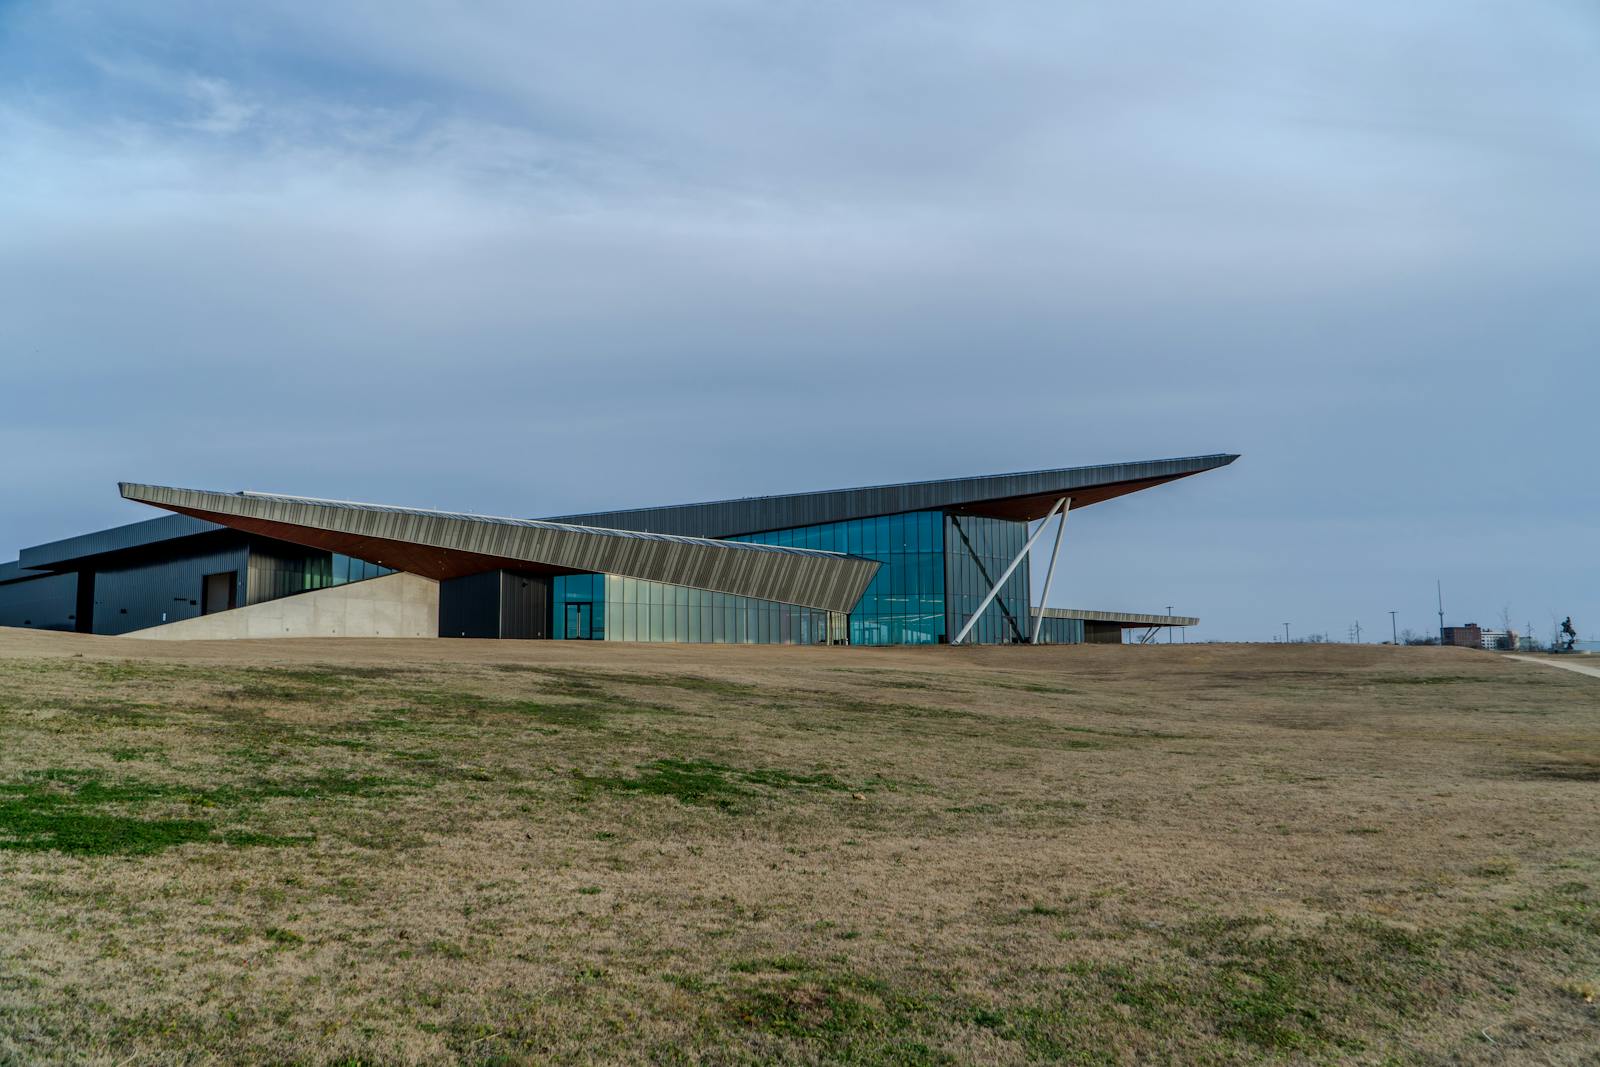
- Total precipitation so far in 2025 compared to baseline: 5.1 inches above avg.
- Total precipitation, January-May 2025: 25.1 inches
- Baseline average precipitation (January-May 1991-2020): 20.0 inches
- Local population: 89,496
20. Huntsville, Alabama
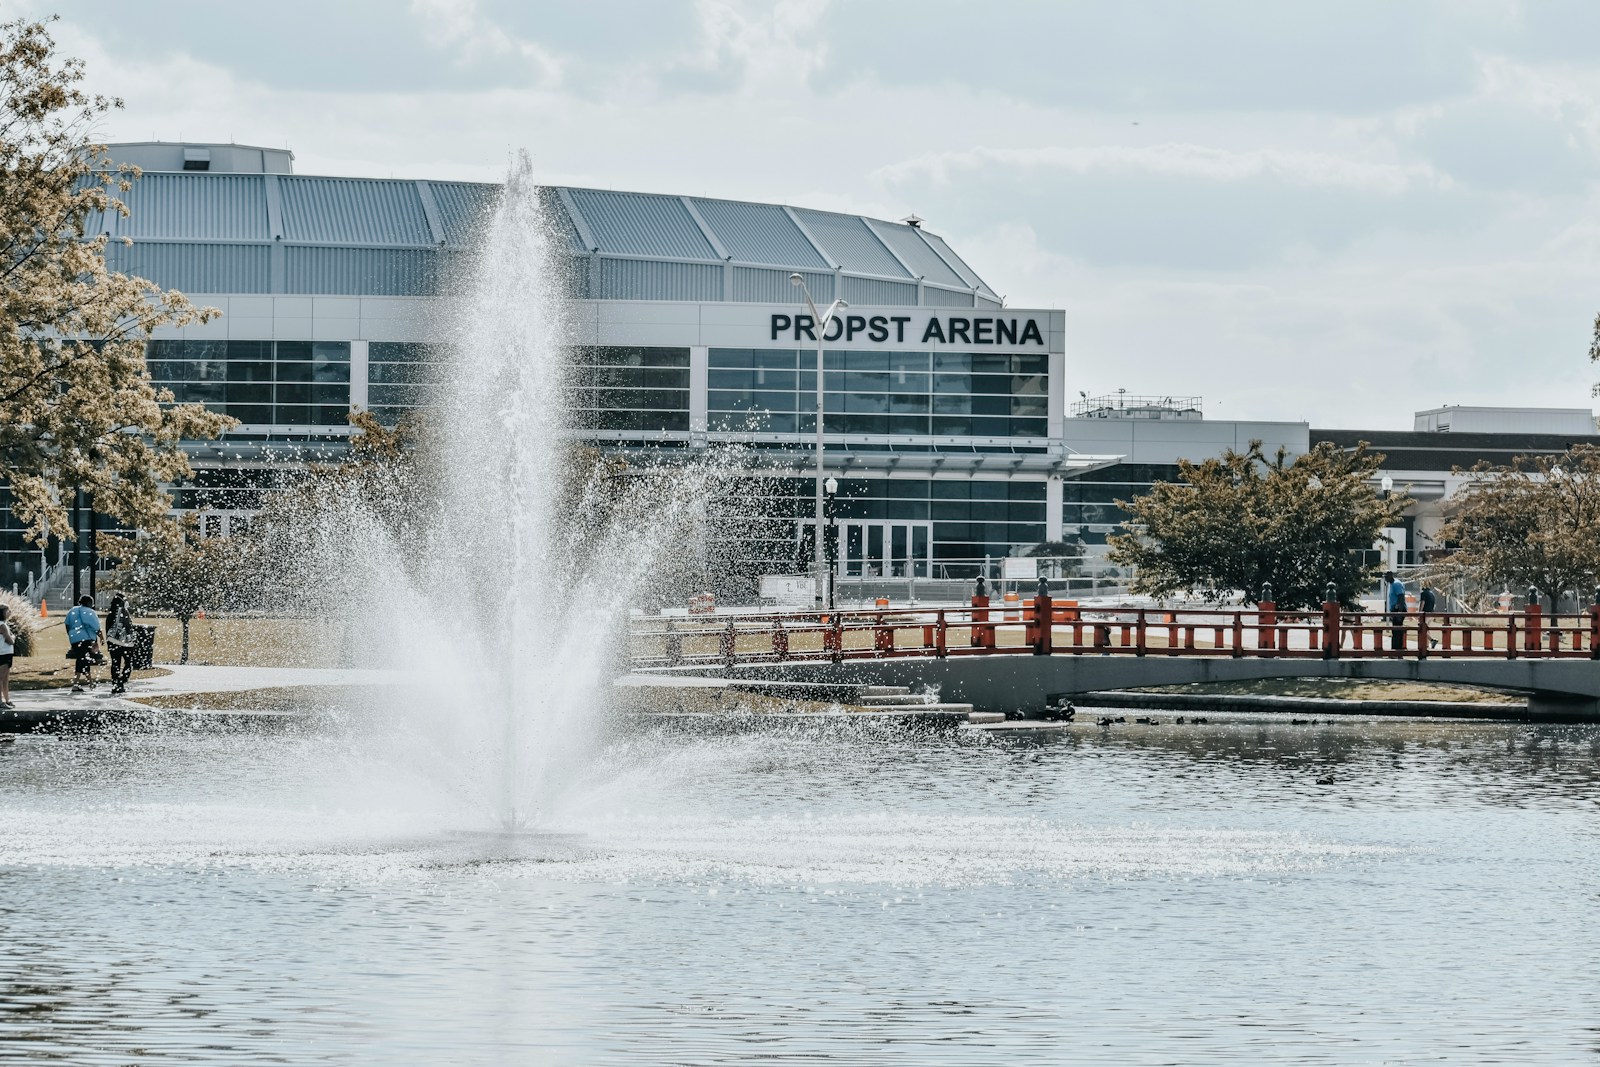
- Total precipitation so far in 2025 compared to baseline: 5.3 inches above avg.
- Total precipitation, January-May 2025: 30.3 inches
- Baseline average precipitation (January-May 1991-2020): 25.0 inches
- Local population: 218,814
19. Tupelo, Mississippi

- Total precipitation so far in 2025 compared to baseline: 5.6 inches above avg.
- Total precipitation, January-May 2025: 31.8 inches
- Baseline average precipitation (January-May 1991-2020): 26.2 inches
- Local population: 37,825
18. Richmond, Virginia
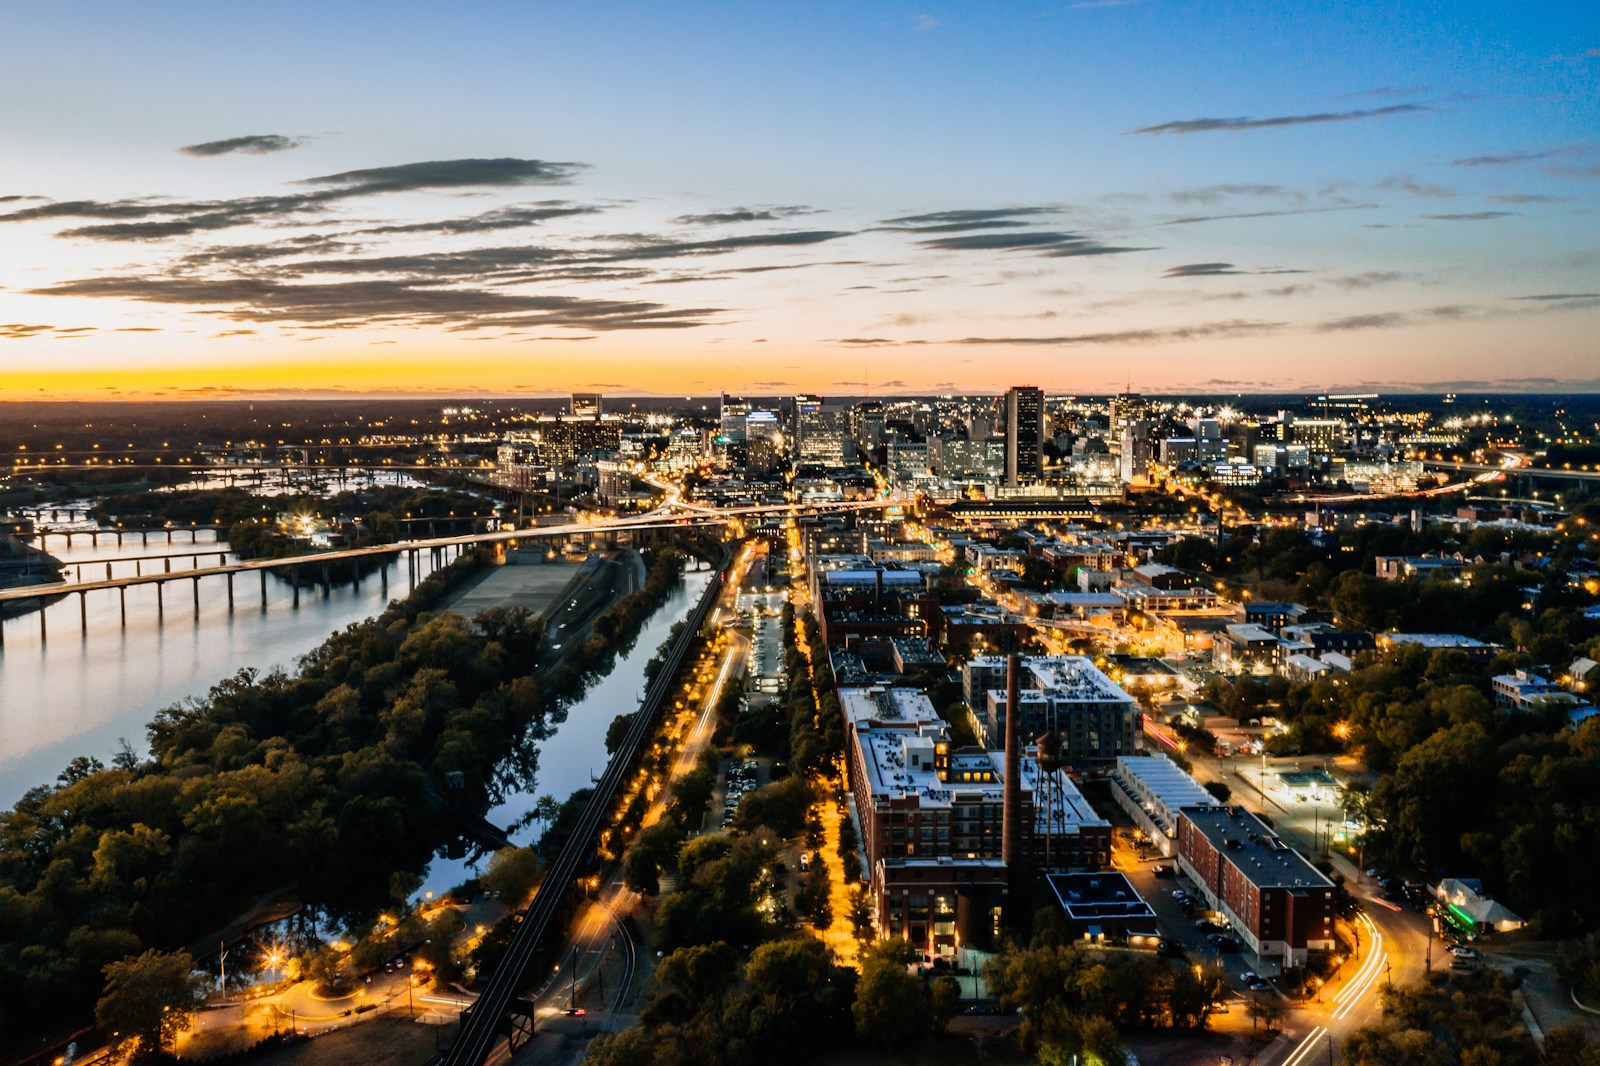
- Total precipitation so far in 2025 compared to baseline: 5.6 inches above avg.
- Total precipitation, January-May 2025: 22.6 inches
- Baseline average precipitation (January-May 1991-2020): 17.0 inches
- Local population: 227,595
17. Springfield, Missouri
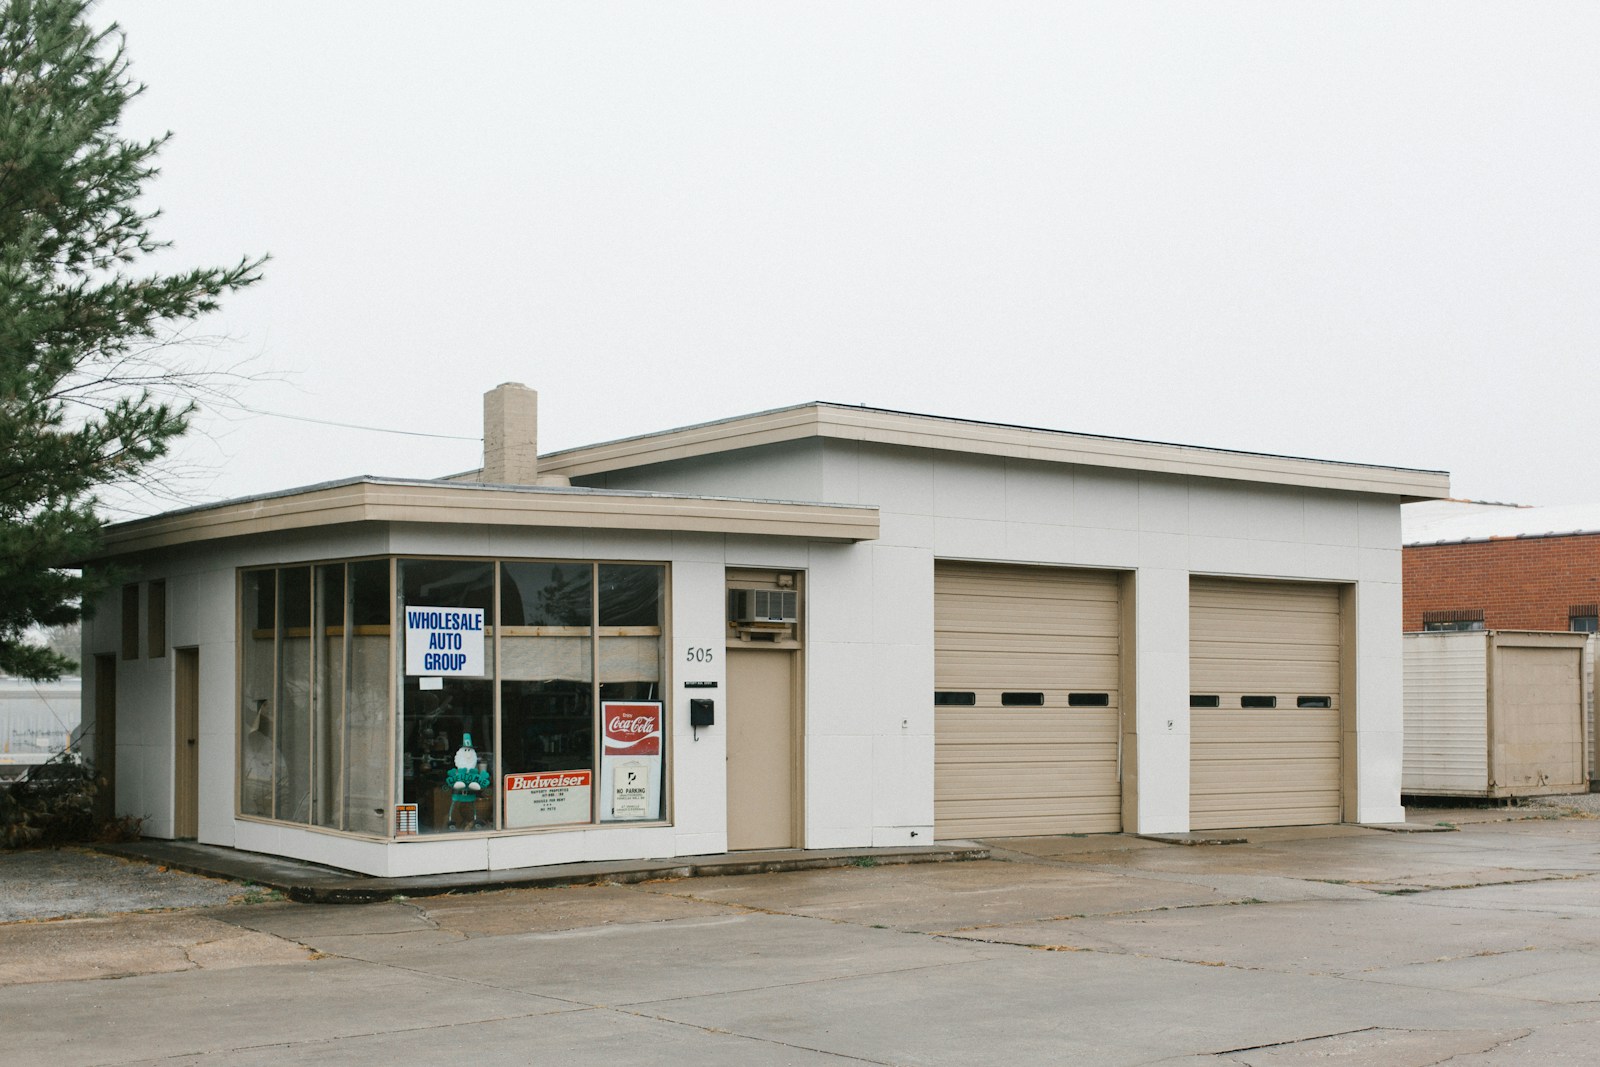
- Total precipitation so far in 2025 compared to baseline: 6.2 inches above avg.
- Total precipitation, January-May 2025: 25.0 inches
- Baseline average precipitation (January-May 1991-2020): 18.7 inches
- Local population: 169,432
16. Brownsville, Texas

- Total precipitation so far in 2025 compared to baseline: 6.3 inches above avg.
- Total precipitation, January-May 2025: 13.6 inches
- Baseline average precipitation (January-May 1991-2020): 7.2 inches
- Local population: 188,023
15. Evansville, Indiana
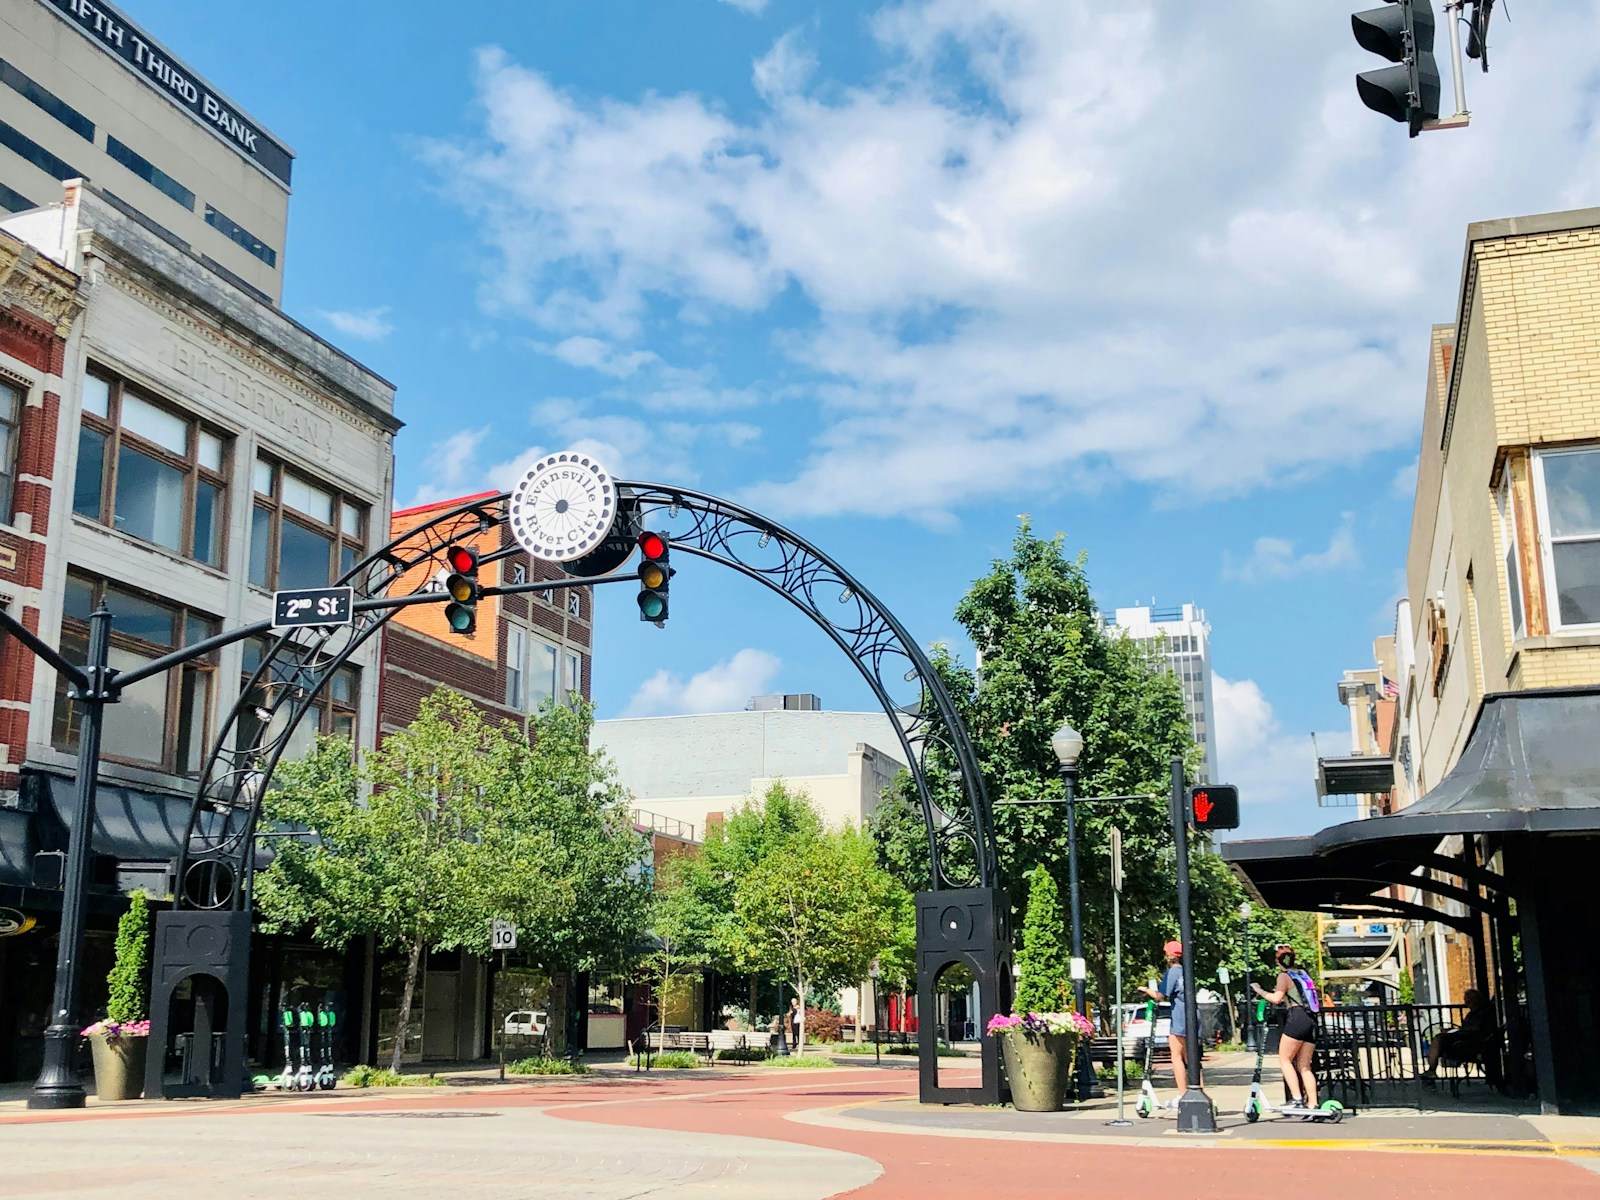
- Total precipitation so far in 2025 compared to baseline: 6.5 inches above avg.
- Total precipitation, January-May 2025: 27.9 inches
- Baseline average precipitation (January-May 1991-2020): 21.4 inches
- Local population: 116,441
14. Paducah, Kentucky

- Total precipitation so far in 2025 compared to baseline: 6.5 inches above avg.
- Total precipitation, January-May 2025: 28.9 inches
- Baseline average precipitation (January-May 1991-2020): 22.5 inches
- Local population: 26,894
13. Chattanooga, Tennessee
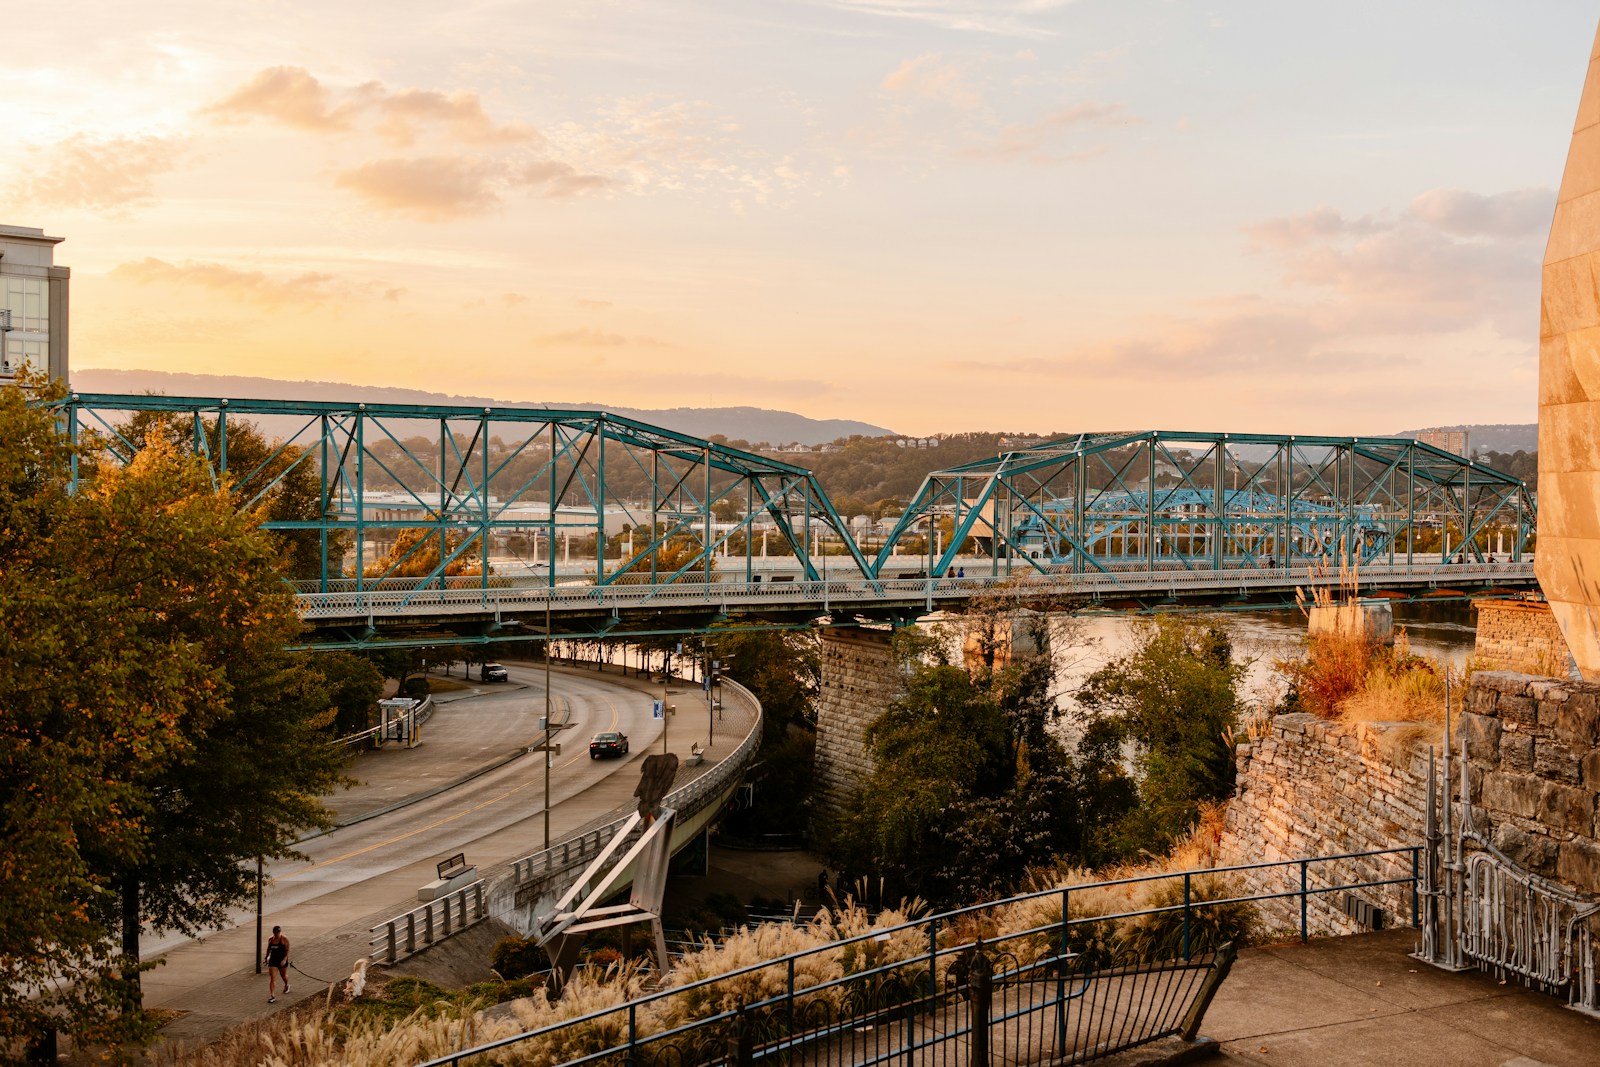
- Total precipitation so far in 2025 compared to baseline: 6.8 inches above avg.
- Total precipitation, January-May 2025: 30.9 inches
- Baseline average precipitation (January-May 1991-2020): 24.2 inches
- Local population: 182,832
12. Sault Ste. Marie, Michigan
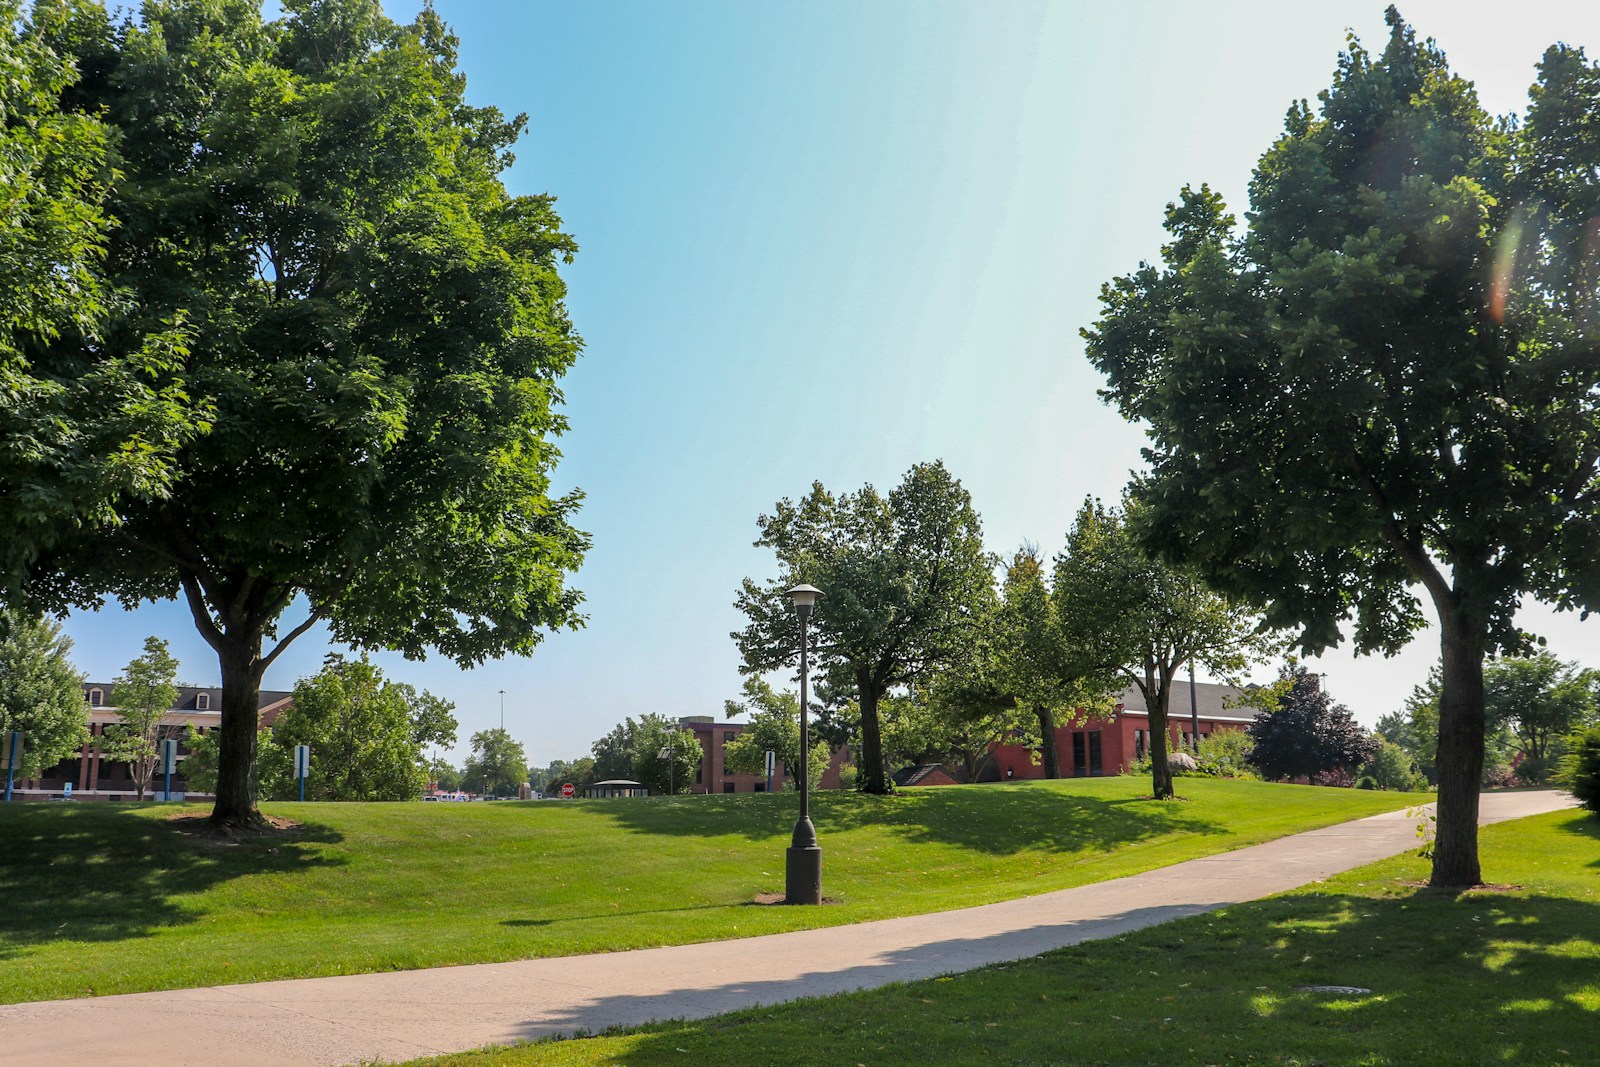
- Total precipitation so far in 2025 compared to baseline: 6.8 inches above avg.
- Total precipitation, January-May 2025: 17.6 inches
- Baseline average precipitation (January-May 1991-2020): 10.8 inches
- Local population: 13,373
11. Oklahoma City, Oklahoma

- Total precipitation so far in 2025 compared to baseline: 7.0 inches above avg.
- Total precipitation, January-May 2025: 21.1 inches
- Baseline average precipitation (January-May 1991-2020): 14.2 inches
- Local population: 688,693
10. Louisville, Kentucky
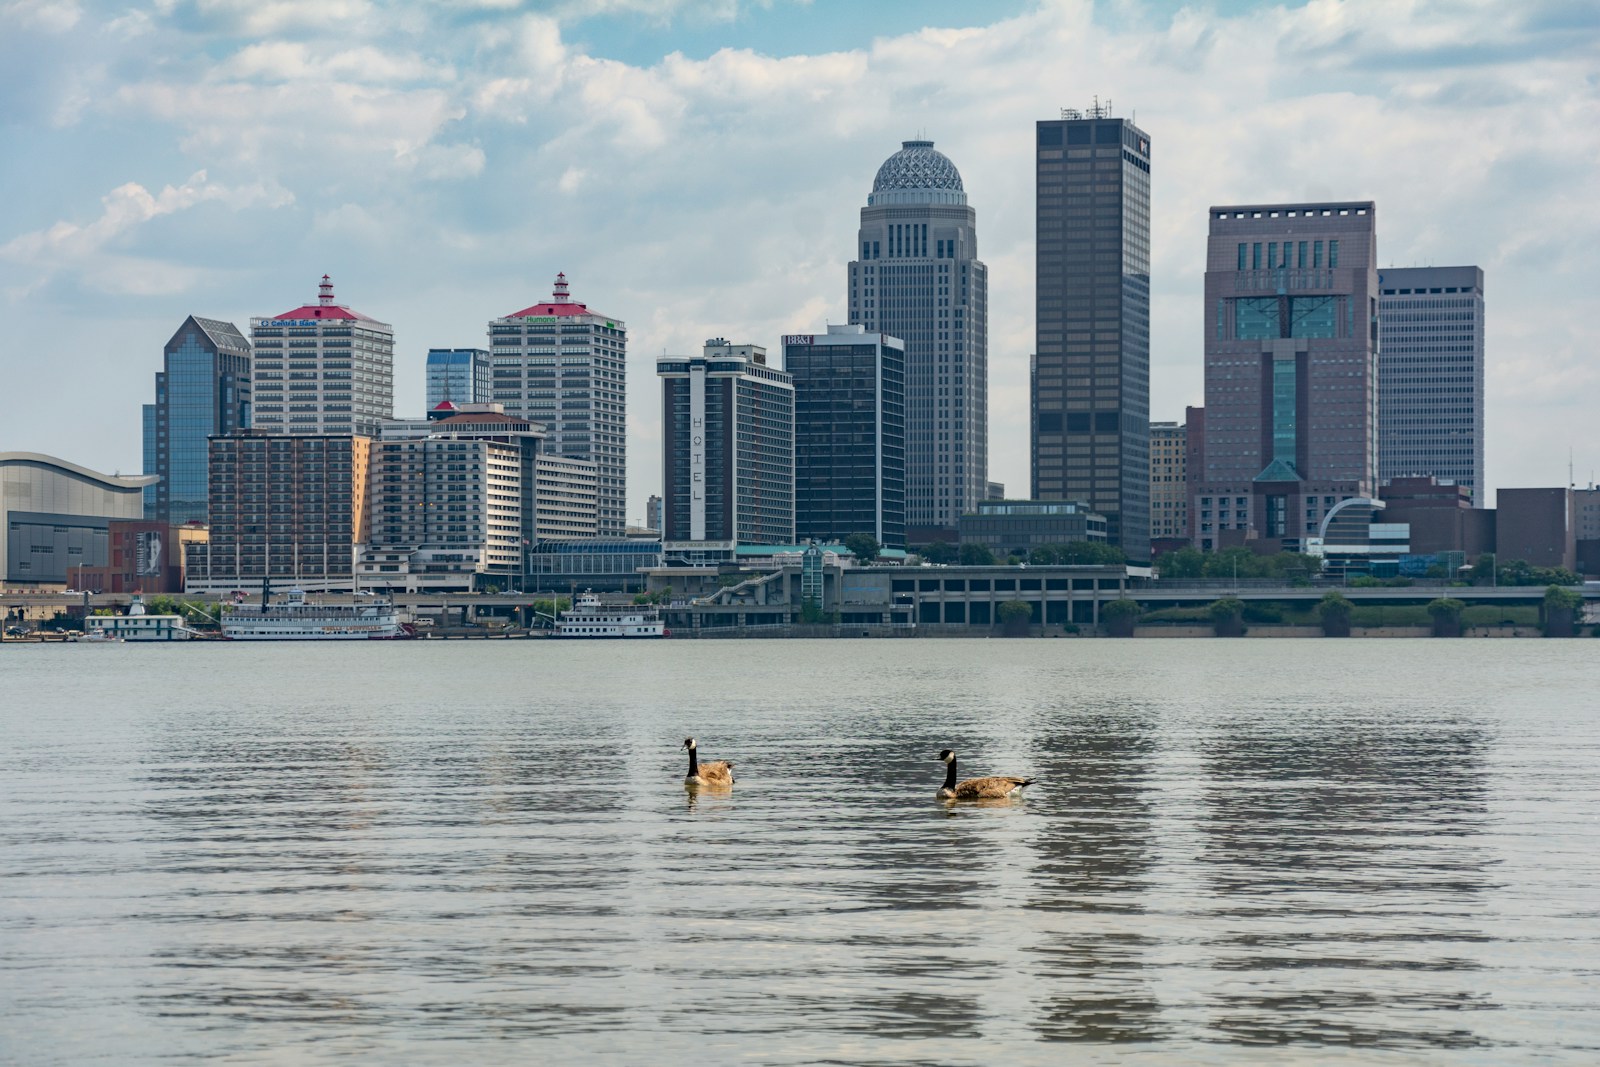
- Total precipitation so far in 2025 compared to baseline: 7.1 inches above avg.
- Total precipitation, January-May 2025: 28.5 inches
- Baseline average precipitation (January-May 1991-2020): 21.4 inches
- Local population: 627,210
9. Jackson, Mississippi
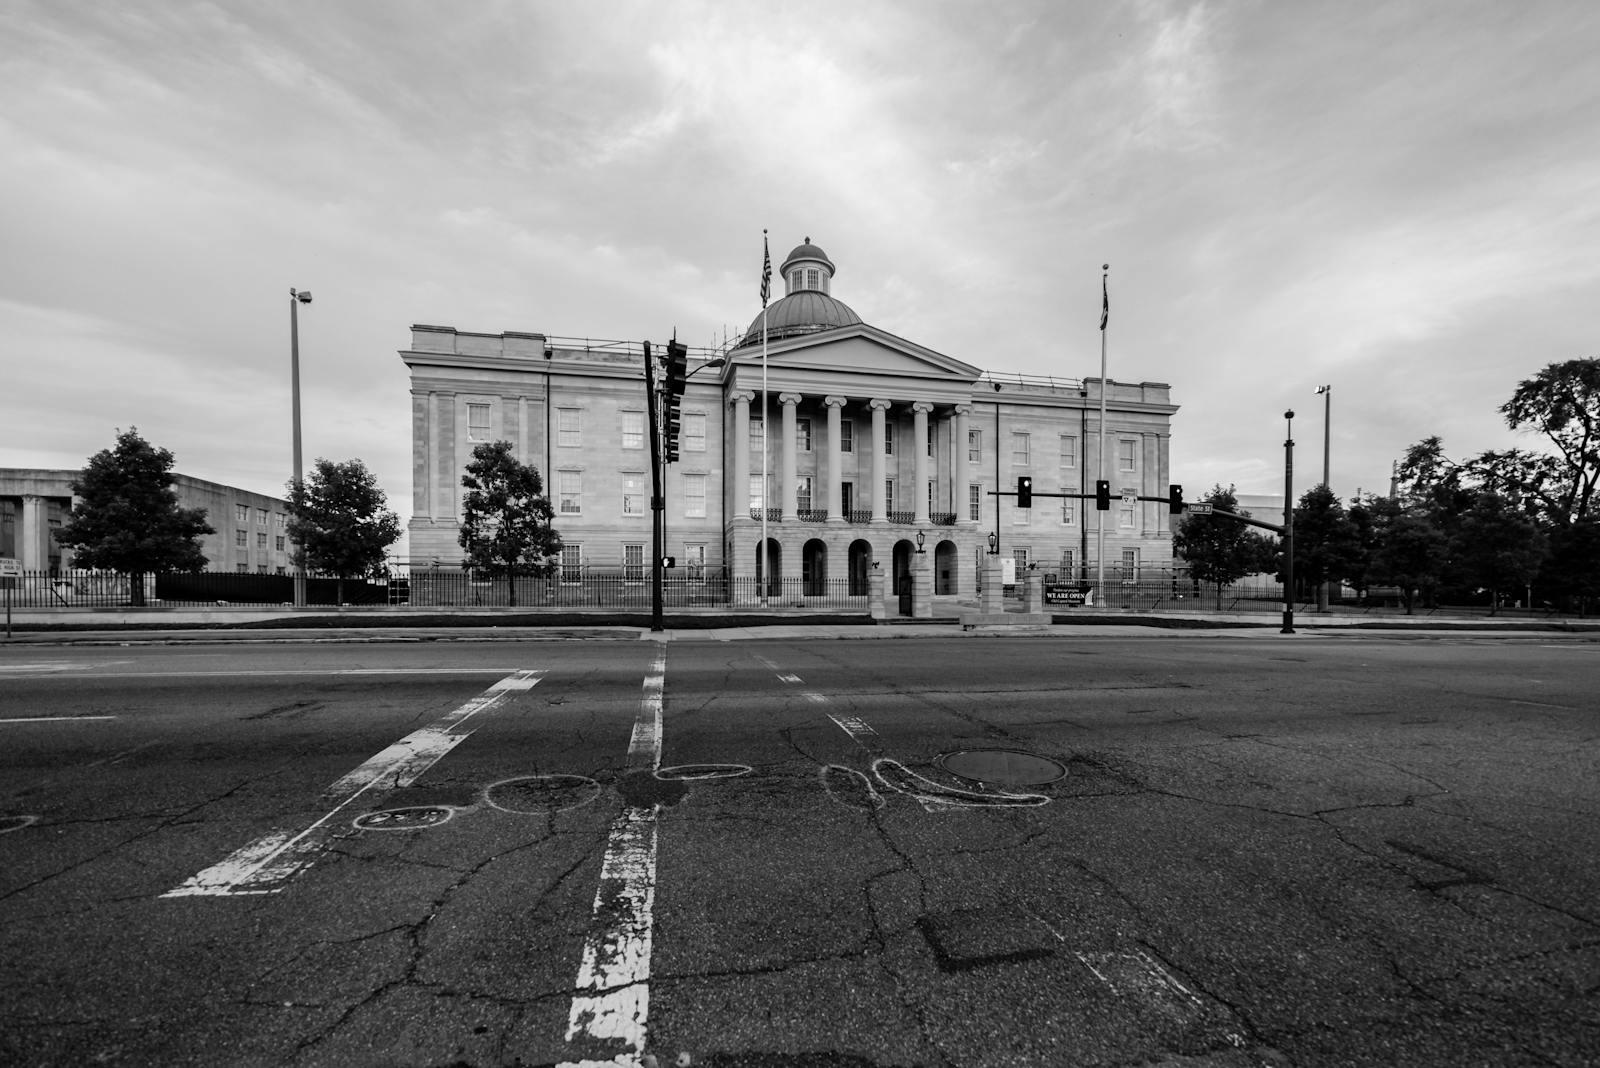
- Total precipitation so far in 2025 compared to baseline: 7.4 inches above avg.
- Total precipitation, January-May 2025: 33.8 inches
- Baseline average precipitation (January-May 1991-2020): 26.4 inches
- Local population: 149,827
8. Little Rock, Arkansas
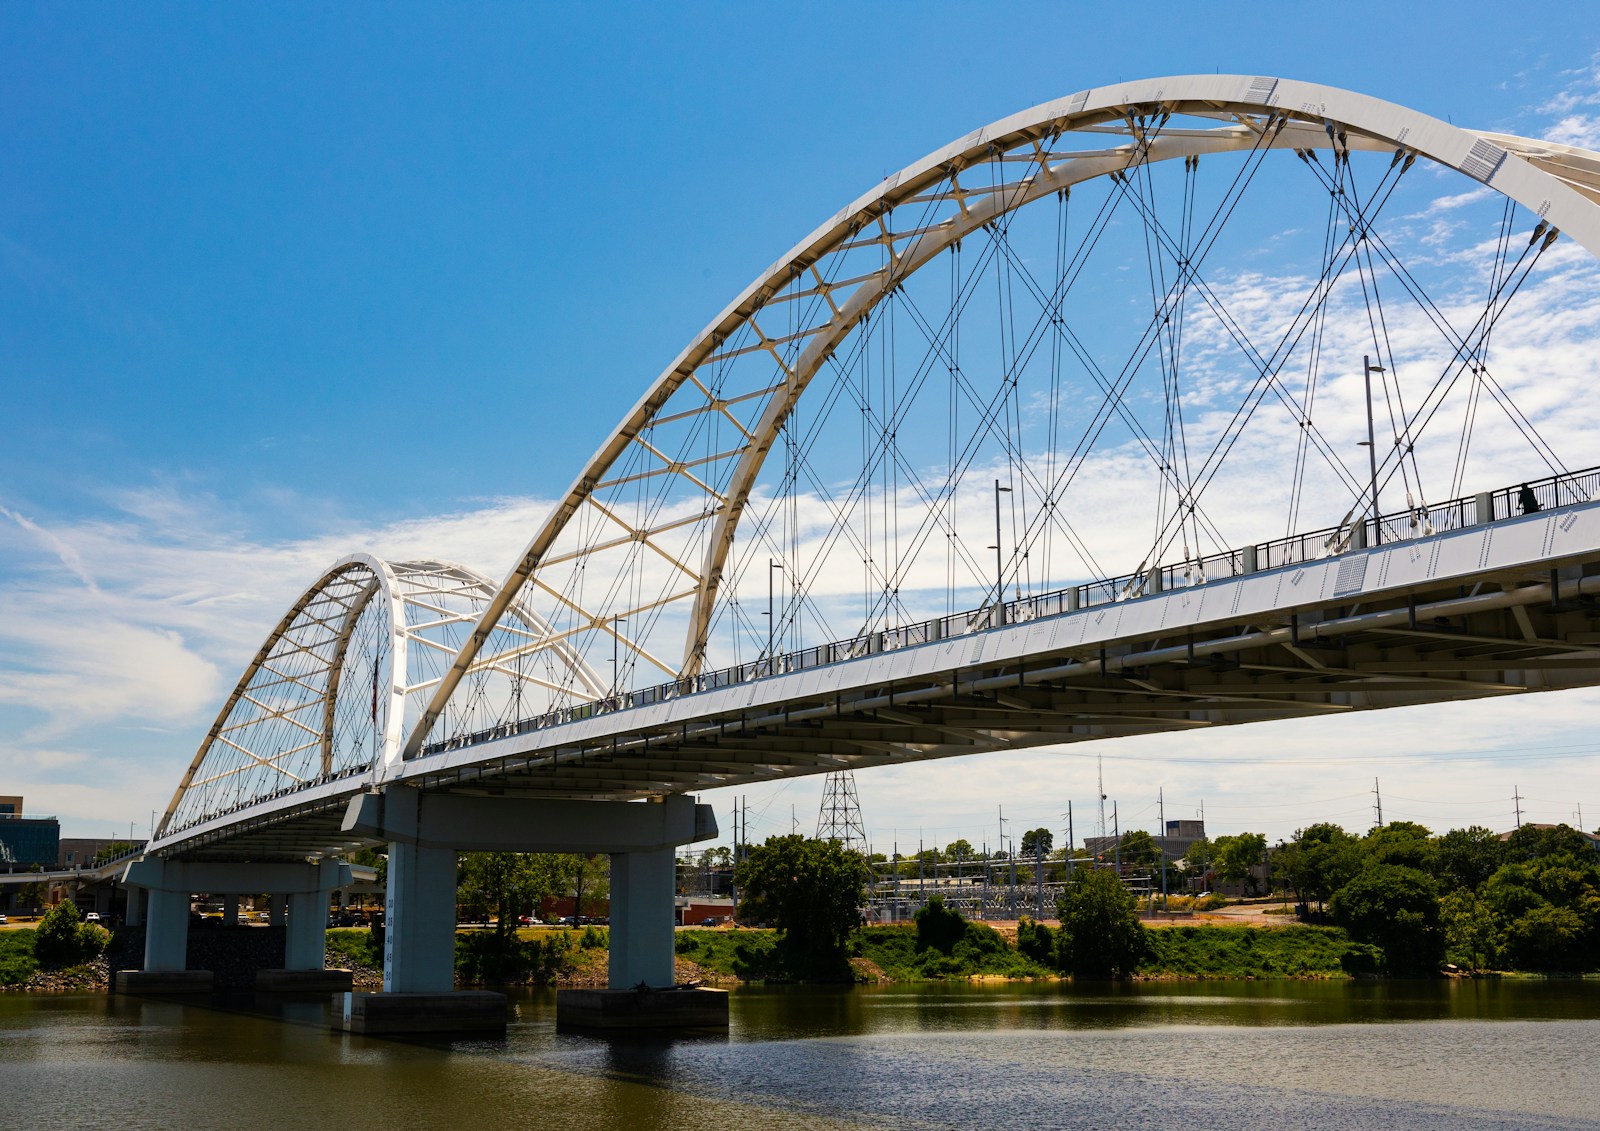
- Total precipitation so far in 2025 compared to baseline: 7.6 inches above avg.
- Total precipitation, January-May 2025: 30.7 inches
- Baseline average precipitation (January-May 1991-2020): 23.1 inches
- Local population: 202,739
7. Wichita Falls, Texas

- Total precipitation so far in 2025 compared to baseline: 7.6 inches above avg.
- Total precipitation, January-May 2025: 18.5 inches
- Baseline average precipitation (January-May 1991-2020): 10.9 inches
- Local population: 102,558
6. Memphis, Tennessee
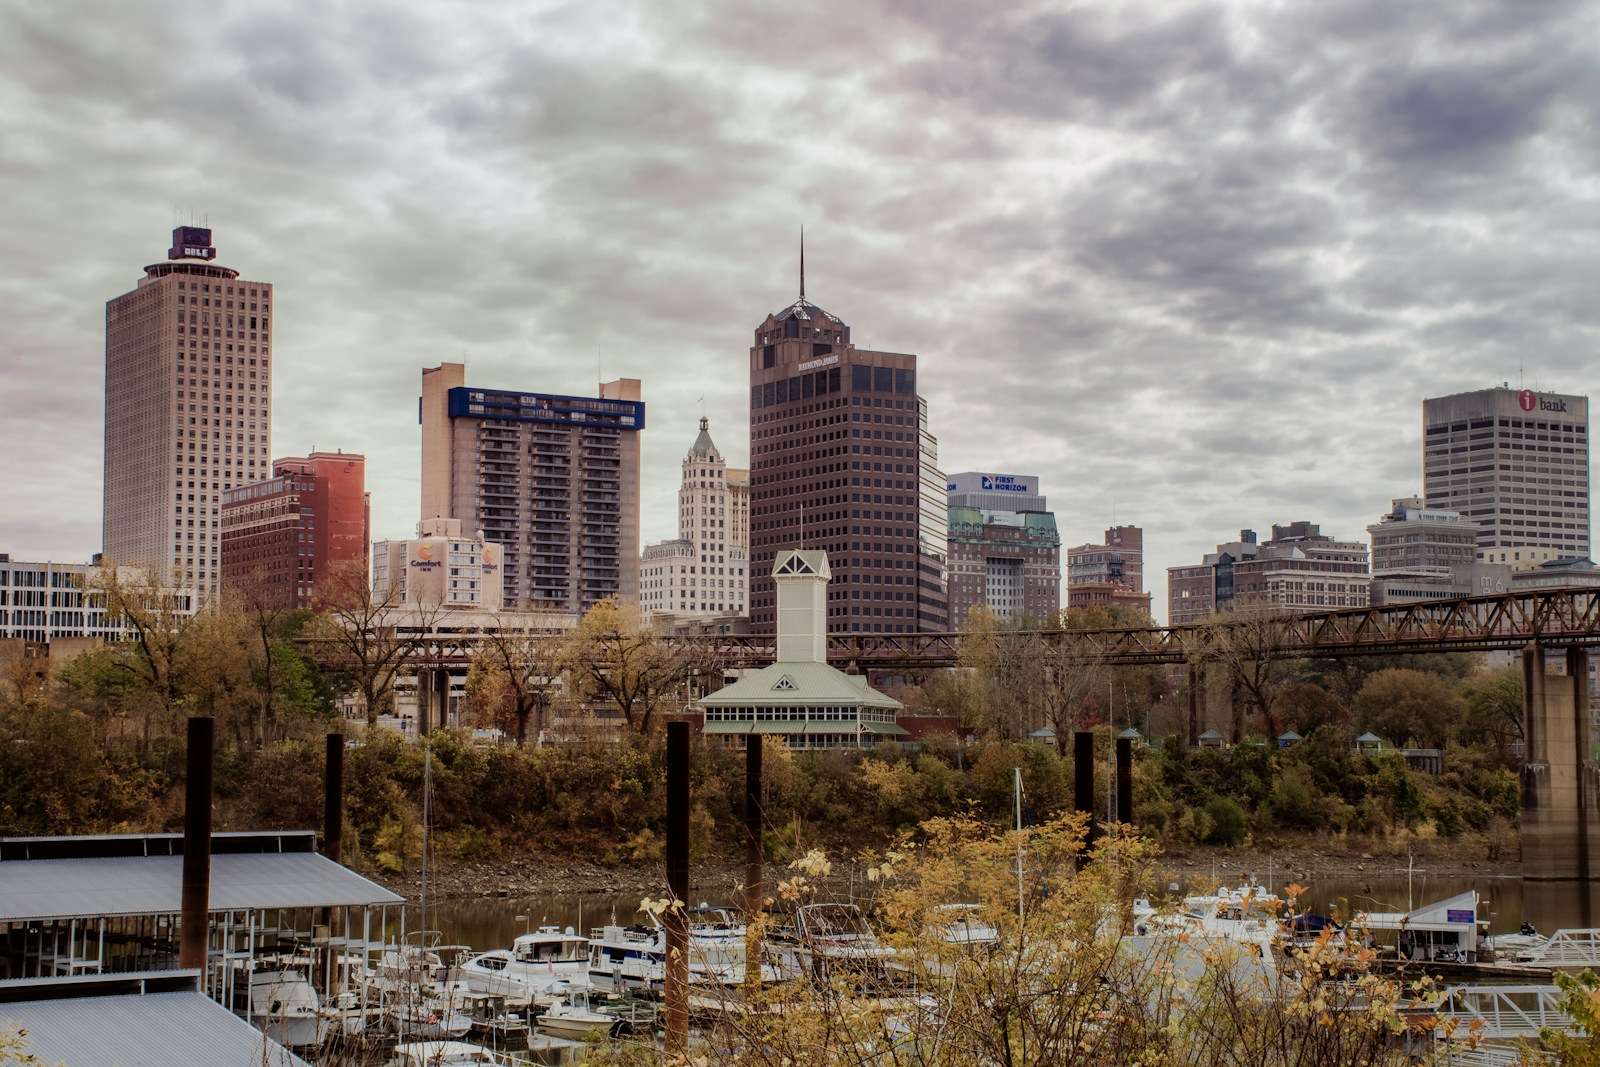
- Total precipitation so far in 2025 compared to baseline: 8.0 inches above avg.
- Total precipitation, January-May 2025: 33.6 inches
- Baseline average precipitation (January-May 1991-2020): 25.6 inches
- Local population: 629,063
5. Tulsa, Oklahoma
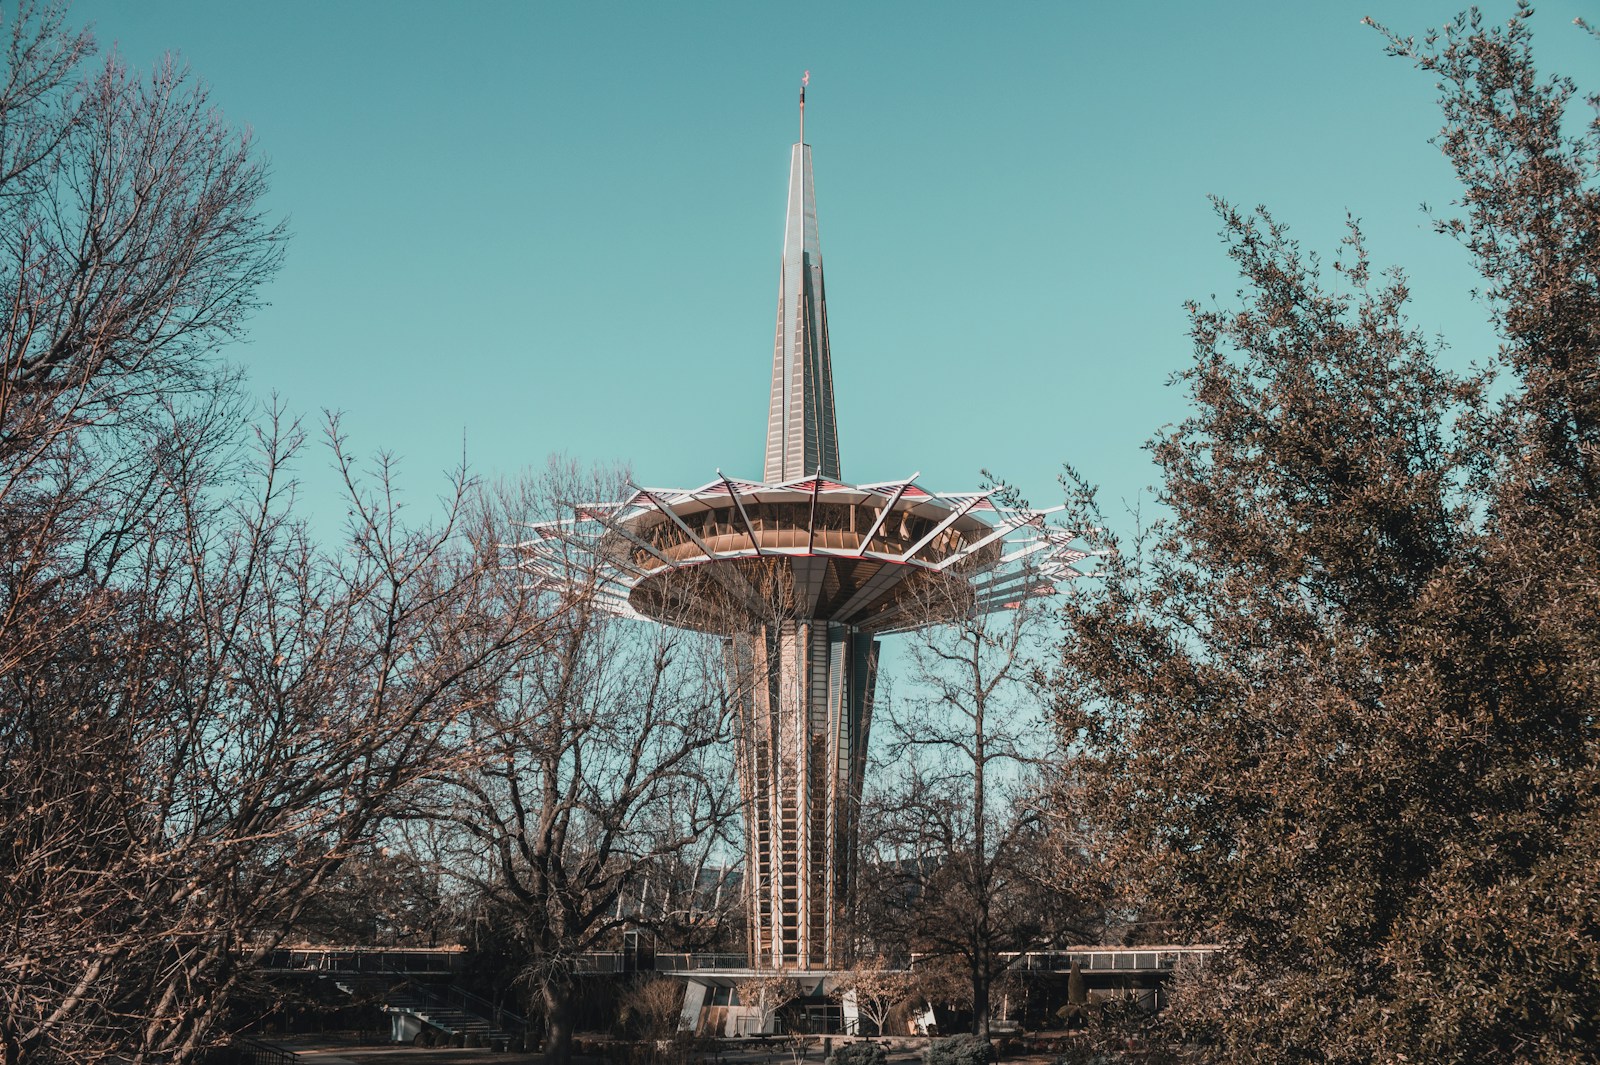
- Total precipitation so far in 2025 compared to baseline: 8.5 inches above avg.
- Total precipitation, January-May 2025: 24.7 inches
- Baseline average precipitation (January-May 1991-2020): 16.3 inches
- Local population: 412,322
4. Shreveport, Louisiana
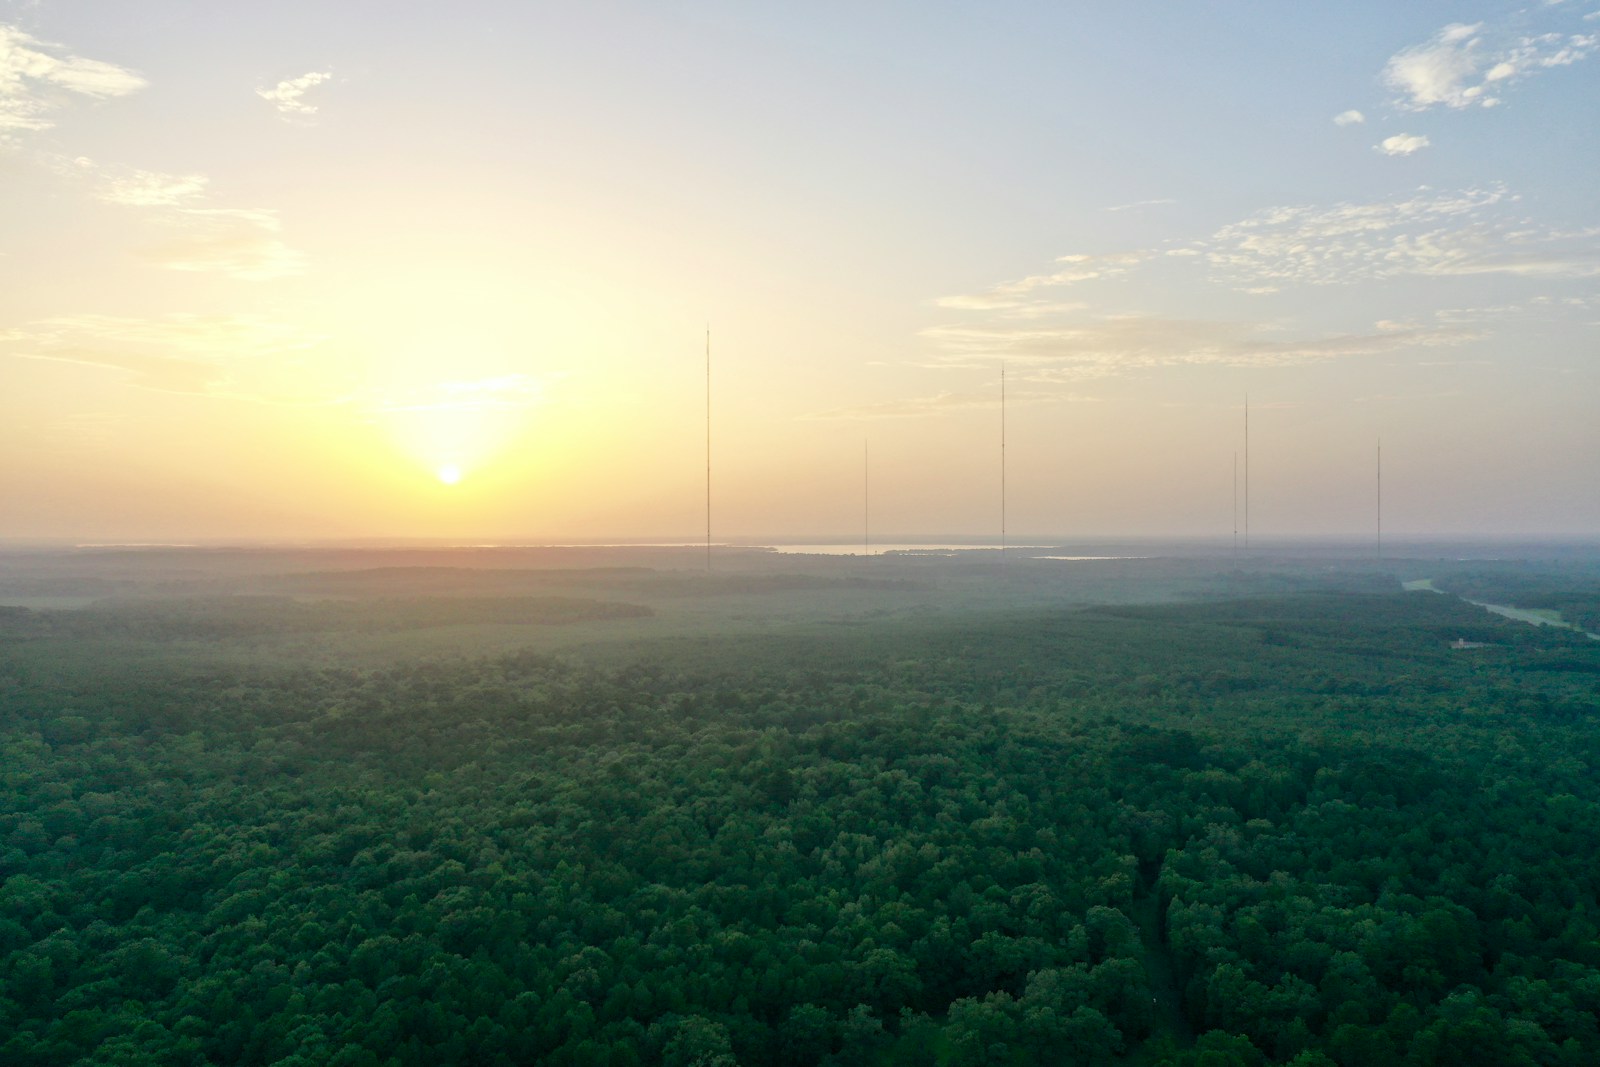
- Total precipitation so far in 2025 compared to baseline: 8.5 inches above avg.
- Total precipitation, January-May 2025: 31.7 inches
- Baseline average precipitation (January-May 1991-2020): 23.3 inches
- Local population: 183,483
3. Nashville, Tennessee
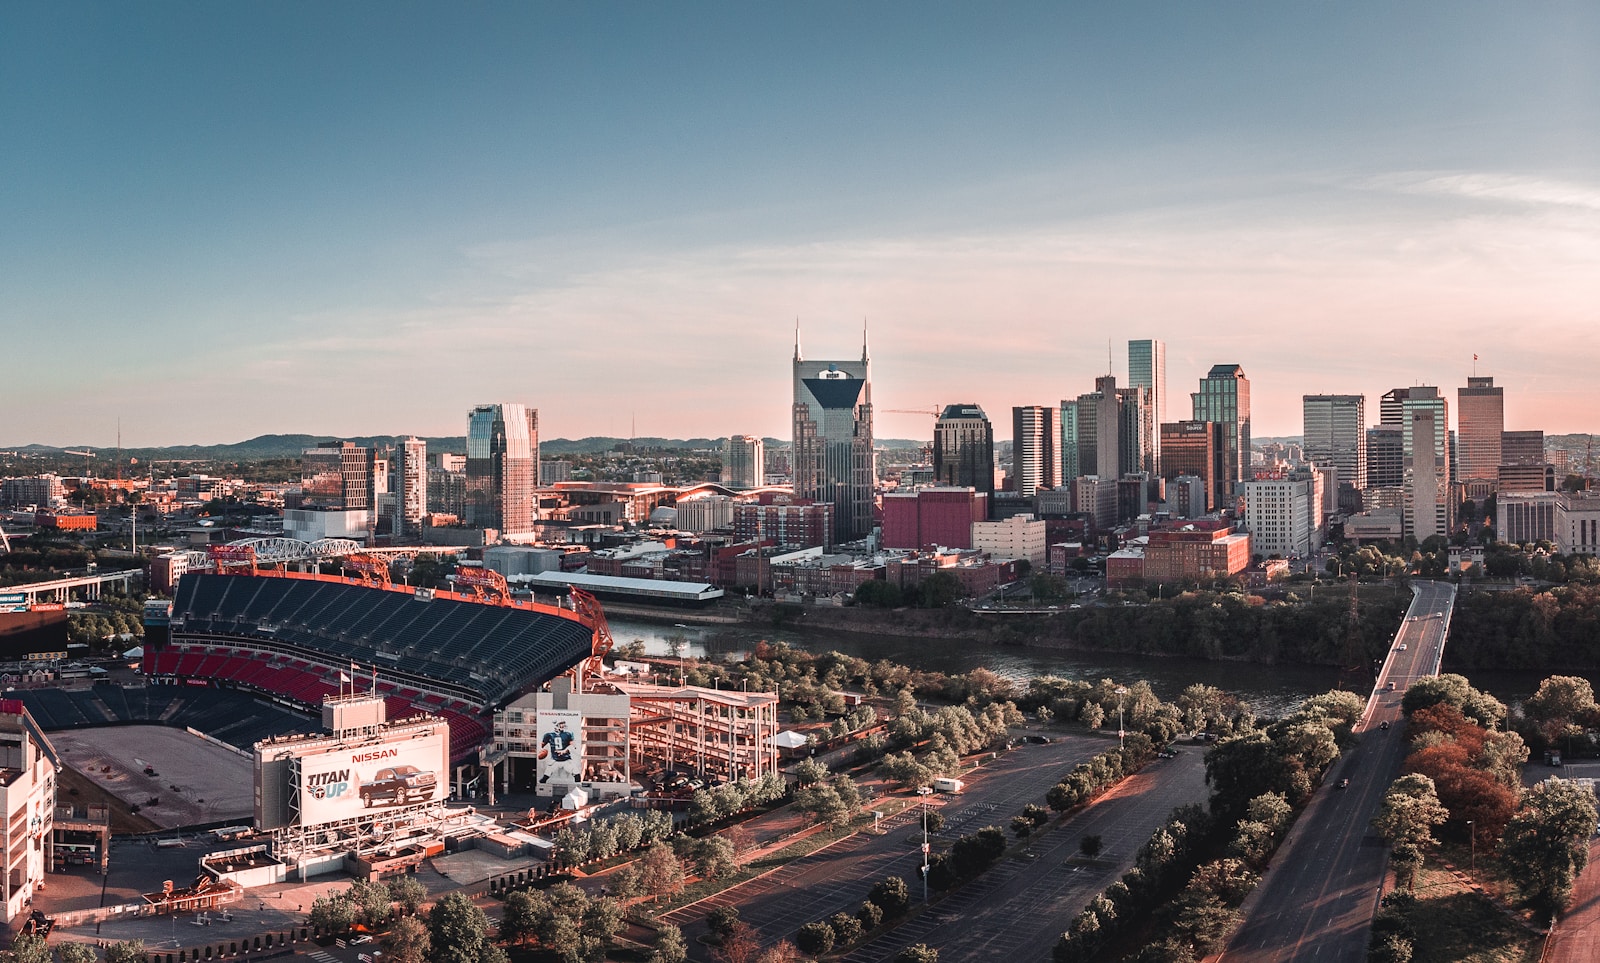
- Total precipitation so far in 2025 compared to baseline: 8.8 inches above avg.
- Total precipitation, January-May 2025: 31.5 inches
- Baseline average precipitation (January-May 1991-2020): 22.8 inches
- Local population: 684,298
2. Lexington, Kentucky
- Total precipitation so far in 2025 compared to baseline: 10.7 inches above avg.
- Total precipitation, January-May 2025: 32.1 inches
- Baseline average precipitation (January-May 1991-2020): 21.4 inches
- Local population: 321,122
1. Lafayette, Louisiana
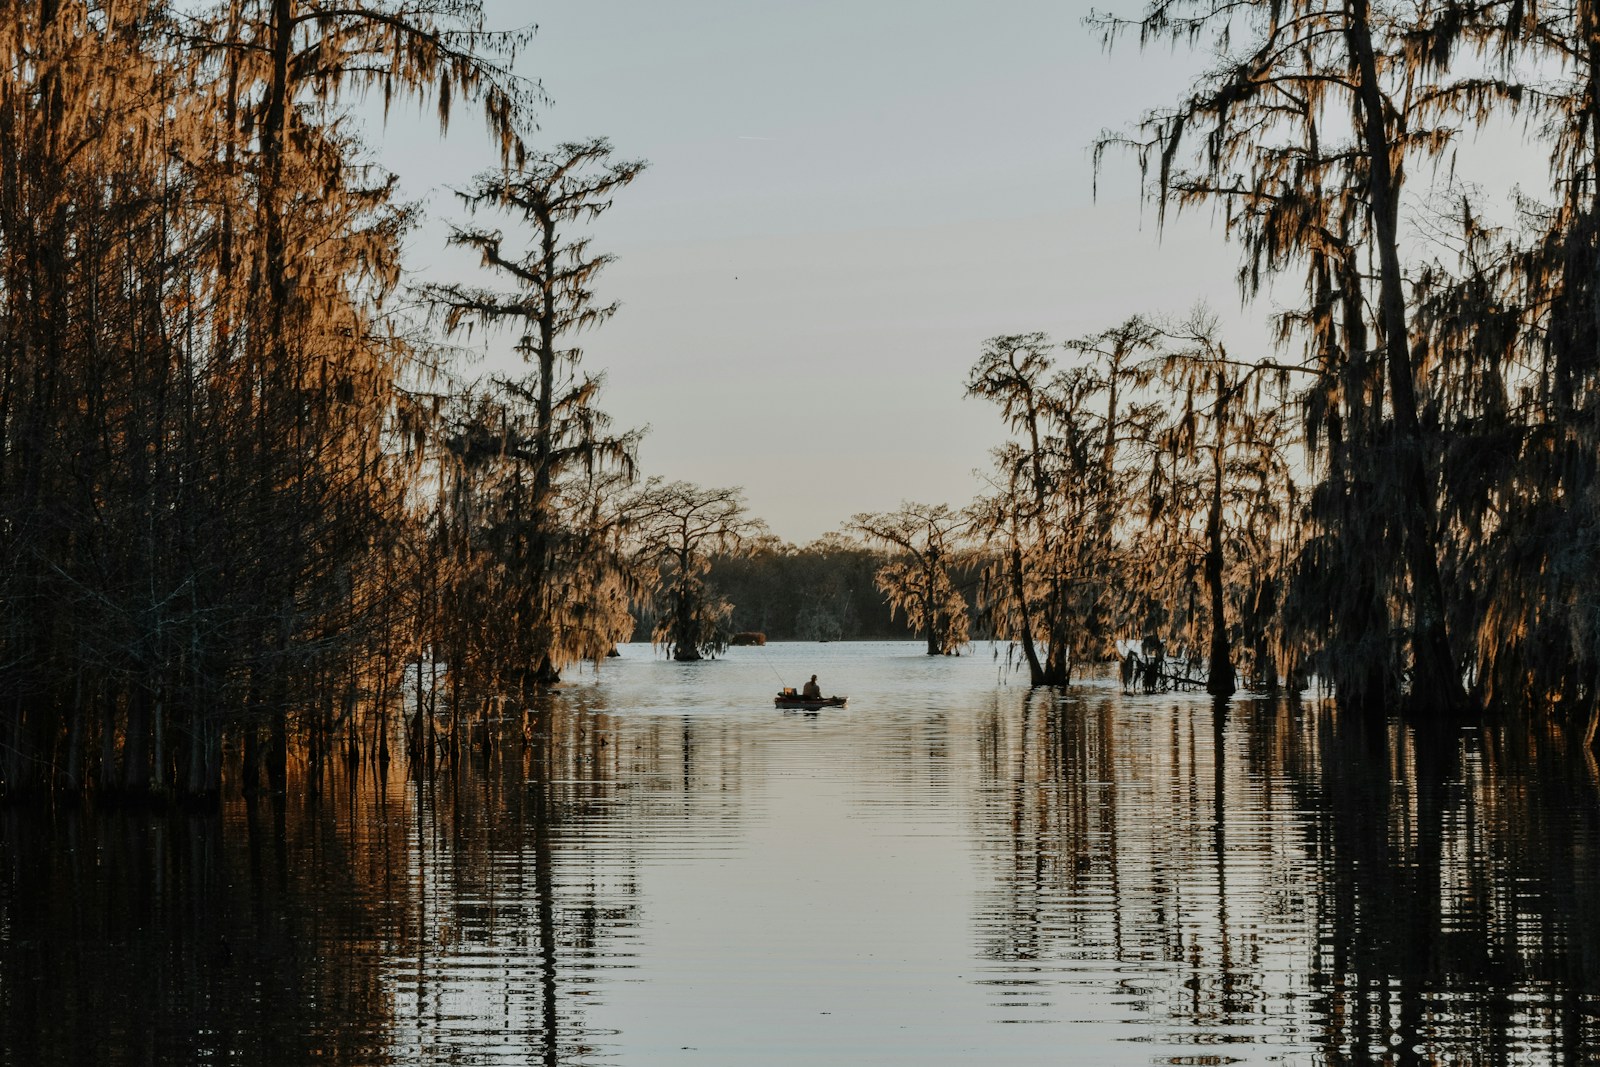
- Total precipitation so far in 2025 compared to baseline: 12.3 inches above avg.
- Total precipitation, January-May 2025: 36.1 inches
- Baseline average precipitation (January-May 1991-2020): 23.8 inches
- Local population: 121,537