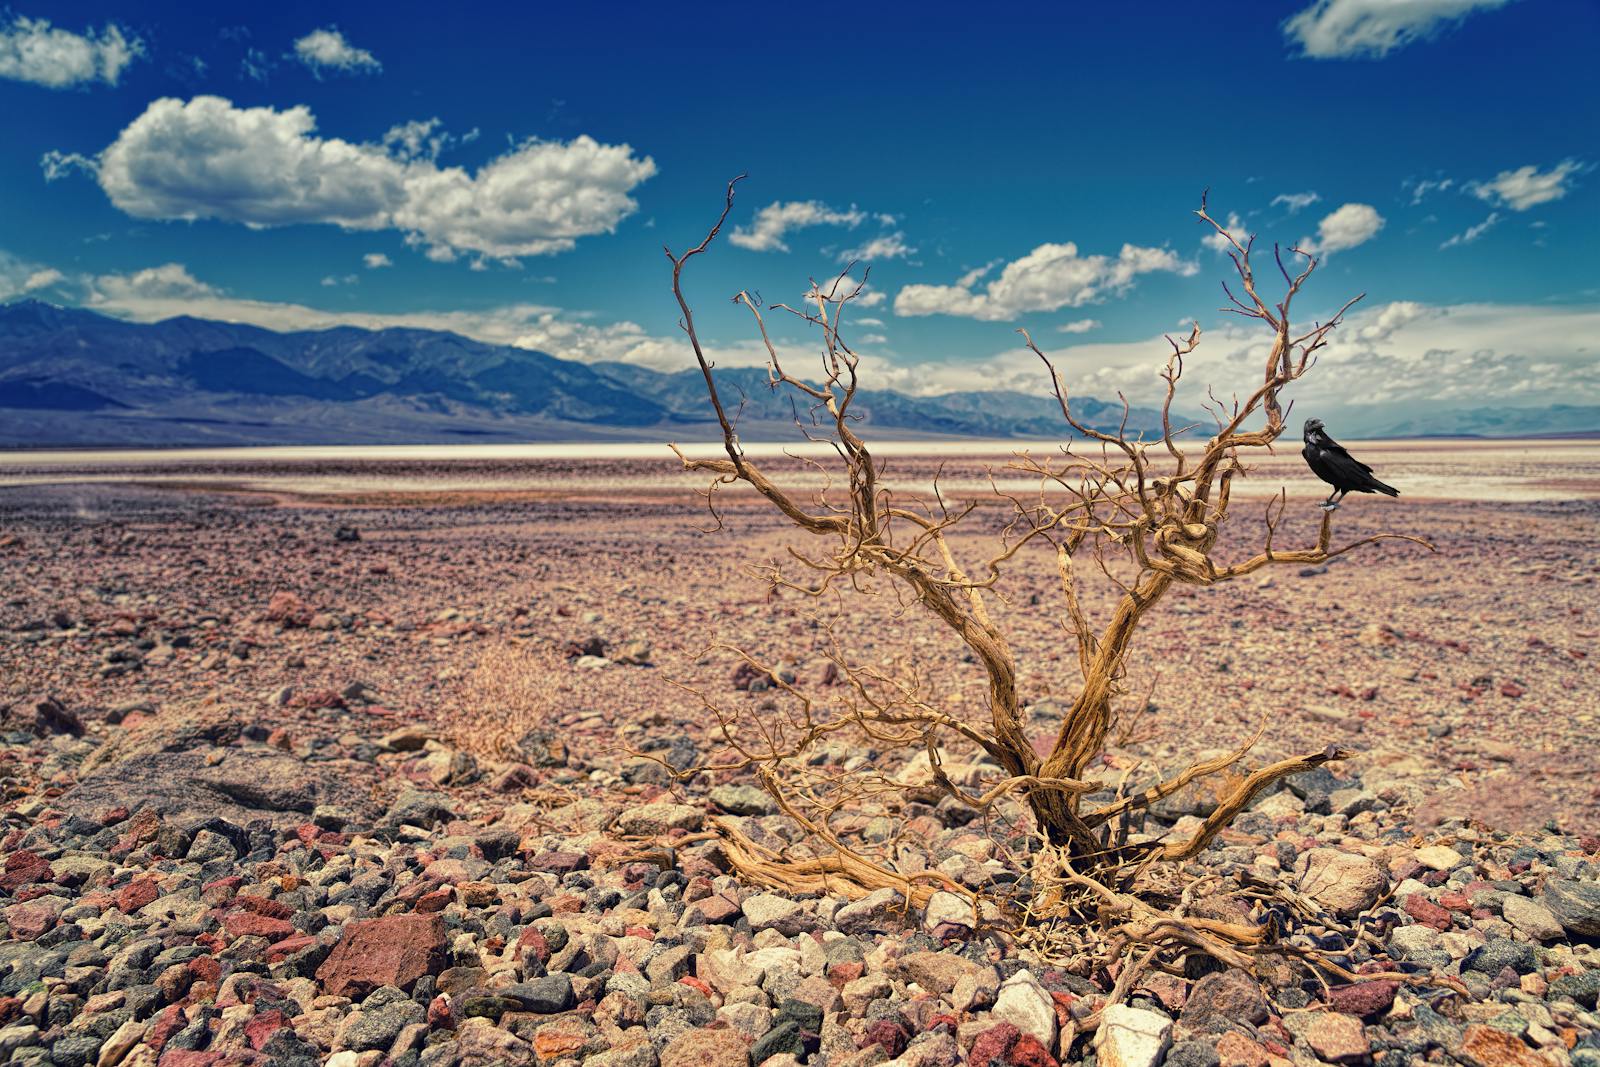
From Montana to Texas to New Jersey, The Counties With The Worst Drought Right Now
 https://climate-crisis-247-bucket.nyc3.cdn.digitaloceanspaces.com/wp-content/uploads/2024/12/07233312/2496572-150x150.jpeg
This year has been one of the driest in U.S. history. Drought conditions peaked in mid-November, when a record 87.8% of the U.S. was abnormally dry, the largest share since the U.S. Drought Monitor began tracking national drought conditions in 1999.
Whence the next pandemic? Cities Where the Next Pandemic Is Most Likely to Break Out
New border crisis? Climate Change Pushing Vampire Bats North Into Texas
While December has brought considerable precipitation to many drought-afflicted regions, dry conditions persist throughout the country, with some climate divisions requiring more than five times their normal monthly amount of rain to ameliorate the current drought. A closer look at USDM data reveals the counties with the worst drought right now.
To determine the counties with the worst drought right now, Climate Crisis 247 reviewed data on drought conditions from the U.S. Drought Monitor. Counties with at least 5,000 residents were ranked based on the percentage of land in extreme to exceptional drought as of December 16, 2024. Supplemental data on observed precipitation for January 2024 through November 2024 and normal average annual precipitation for the years 1900 through 2000 are from the NOAA.
25. Marshall County, TN

- Area in extreme to exceptional drought: 82.8%
- Year-to-date precipitation, 2024: 44.8 inches
- Normal average annual precipitation, 1900-2000: 47.7 inches
- County seat: Lewisburg
24. Hays County, TX

- Area in extreme to exceptional drought: 83.5%
- Year-to-date precipitation, 2024: 28.6 inches
- Normal average annual precipitation, 1900-2000: 30.8 inches
- County seat: San Marcos
23. McKenzie County, ND

- Area in extreme to exceptional drought: 88.6%
- Year-to-date precipitation, 2024: 11.9 inches
- Normal average annual precipitation, 1900-2000: 14.8 inches
- County seat: Watford City
22. Powell County, MT
- Area in extreme to exceptional drought: 90.3%
- Year-to-date precipitation, 2024: 17.4 inches
- Normal average annual precipitation, 1900-2000: 23.8 inches
- County seat: Deer Lodge
21. Bexar County, TX

- Area in extreme to exceptional drought: 90.7%
- Year-to-date precipitation, 2024: 23.2 inches
- Normal average annual precipitation, 1900-2000: 27.9 inches
- County seat: San Antonio
20. Giles County, TN

- Area in extreme to exceptional drought: 91.2%
- Year-to-date precipitation, 2024: 45.3 inches
- Normal average annual precipitation, 1900-2000: 48.6 inches
- County seat: Pulaski
19. Kendall County, TX

- Area in extreme to exceptional drought: 94.2%
- Year-to-date precipitation, 2024: 25.2 inches
- Normal average annual precipitation, 1900-2000: 29.3 inches
- County seat: Boerne
18. Medina County, TX

- Area in extreme to exceptional drought: 95.2%
- Year-to-date precipitation, 2024: 16.7 inches
- Normal average annual precipitation, 1900-2000: 25.9 inches
- County seat: Hondo
17. Gloucester County, NJ

- Area in extreme to exceptional drought: 96.6%
- Year-to-date precipitation, 2024: 35.2 inches
- Normal average annual precipitation, 1900-2000: 39.9 inches
- County seat: Woodbury
16. Burlington County, NJ

- Area in extreme to exceptional drought: 97.9%
- Year-to-date precipitation, 2024: 36.9 inches
- Normal average annual precipitation, 1900-2000: 40.4 inches
- County seat: Mount Holly
15. Comal County, TX
- Area in extreme to exceptional drought: 98.1%
- Year-to-date precipitation, 2024: 26.3 inches
- Normal average annual precipitation, 1900-2000: 30.5 inches
- County seat: New Braunfels
14. Goshen County, WY

- Area in extreme to exceptional drought: 99.6%
- Year-to-date precipitation, 2024: 9.2 inches
- Normal average annual precipitation, 1900-2000: 14.3 inches
- County seat: Torrington
13. La Paz County, AZ
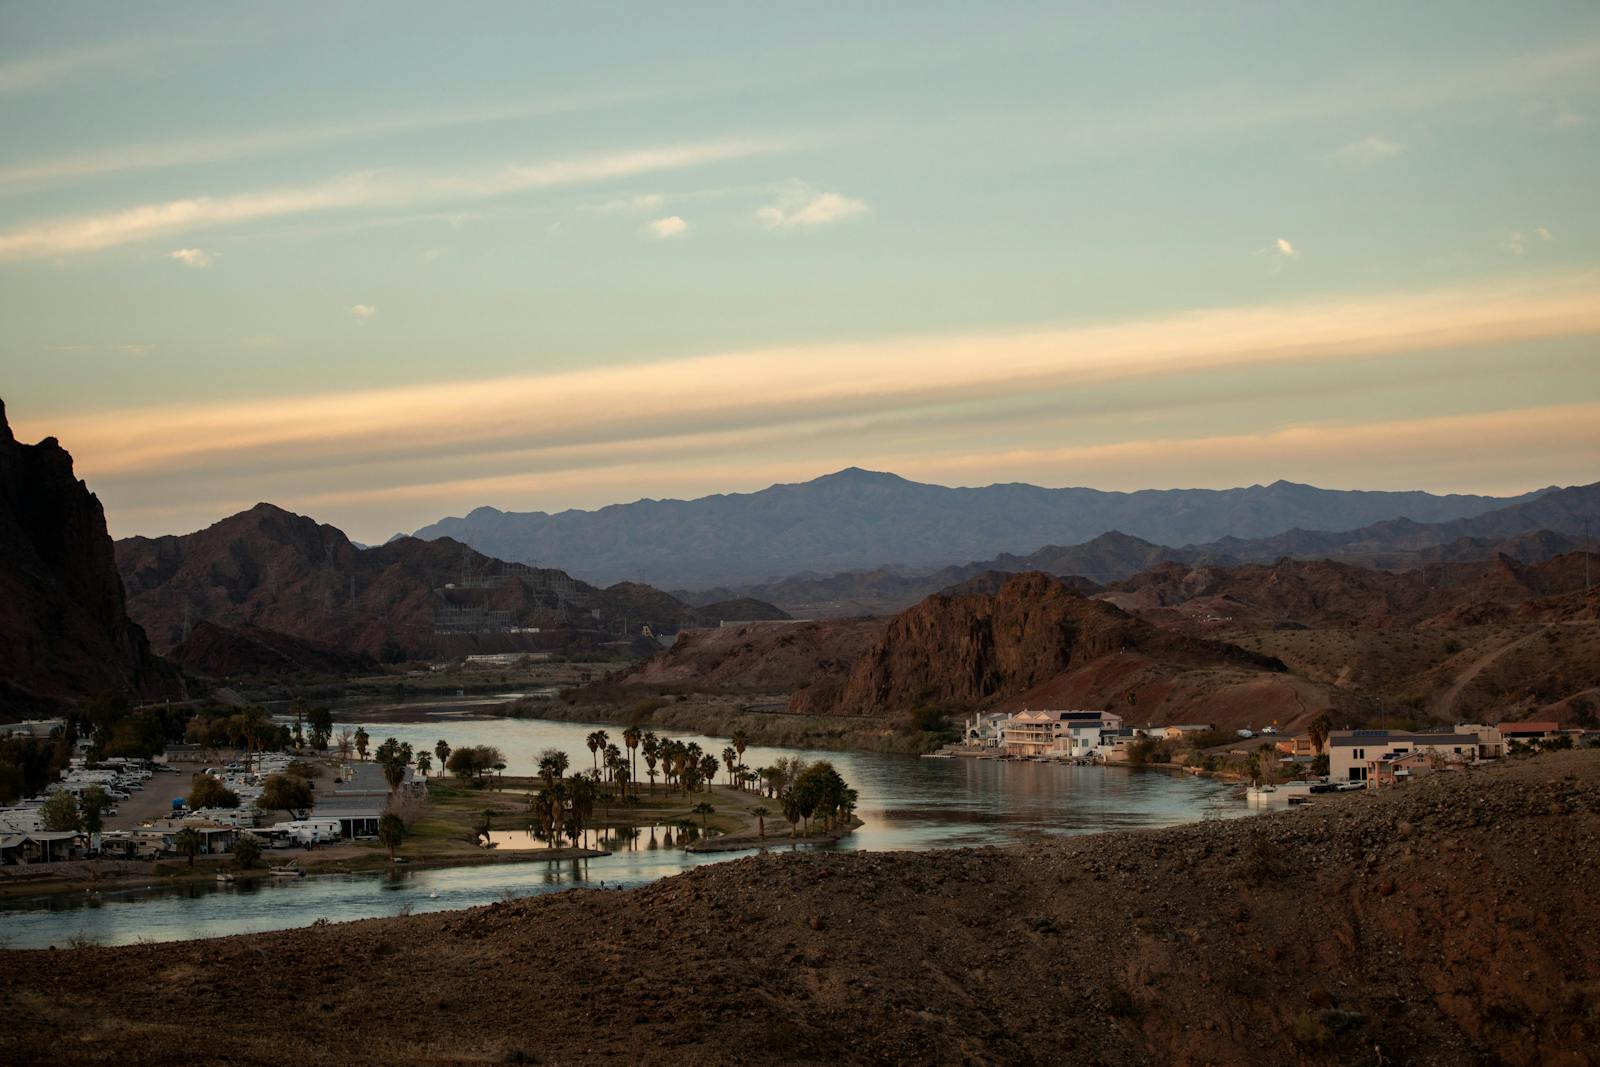
- Area in extreme to exceptional drought: 100.0%
- Year-to-date precipitation, 2024: 3.3 inches
- Normal average annual precipitation, 1900-2000: 5.2 inches
- County seat: Parker
12. Platte County, WY

- Area in extreme to exceptional drought: 100.0%
- Year-to-date precipitation, 2024: 9.5 inches
- Normal average annual precipitation, 1900-2000: 13.7 inches
- County seat: Wheatland
11. Philadelphia County, PA

- Area in extreme to exceptional drought: 100.0%
- Year-to-date precipitation, 2024: 36.9 inches
- Normal average annual precipitation, 1900-2000: 40.6 inches
- County seat: Philadelphia
10. Ocean County, NJ

- Area in extreme to exceptional drought: 100.0%
- Year-to-date precipitation, 2024: 39.9 inches
- Normal average annual precipitation, 1900-2000: 40.7 inches
- County seat: Toms River
9. Cumberland County, NJ

- Area in extreme to exceptional drought: 100.0%
- Year-to-date precipitation, 2024: 33.0 inches
- Normal average annual precipitation, 1900-2000: 39.2 inches
- County seat: Bridgeton
8. Cape May County, NJ

- Area in extreme to exceptional drought: 100.0%
- Year-to-date precipitation, 2024: 35.4 inches
- Normal average annual precipitation, 1900-2000: 39.1 inches
- County seat: Cape May
7. Camden County, NJ

- Area in extreme to exceptional drought: 100.0%
- Year-to-date precipitation, 2024: 36.3 inches
- Normal average annual precipitation, 1900-2000: 40.1 inches
- County seat: Camden
6. Atlantic County, NJ

- Area in extreme to exceptional drought: 100.0%
- Year-to-date precipitation, 2024: 35.9 inches
- Normal average annual precipitation, 1900-2000: 40.0 inches
- County seat: Mays Landing
5. Dawes County, NE

- Area in extreme to exceptional drought: 100.0%
- Year-to-date precipitation, 2024: 11.7 inches
- Normal average annual precipitation, 1900-2000: 17.4 inches
- County seat: Chadron
4. Suffolk County, MA

- Area in extreme to exceptional drought: 100.0%
- Year-to-date precipitation, 2024: 42.7 inches
- Normal average annual precipitation, 1900-2000: 40.3 inches
- County seat: Boston
3. Reeves County, TX
- Area in extreme to exceptional drought: 100.0%
- Year-to-date precipitation, 2024: 5.4 inches
- Normal average annual precipitation, 1900-2000: 11.0 inches
- County seat: Pecos
2. Brewster County, TX

- Area in extreme to exceptional drought: 100.0%
- Year-to-date precipitation, 2024: 6.3 inches
- Normal average annual precipitation, 1900-2000: 12.7 inches
- County seat: Alpine
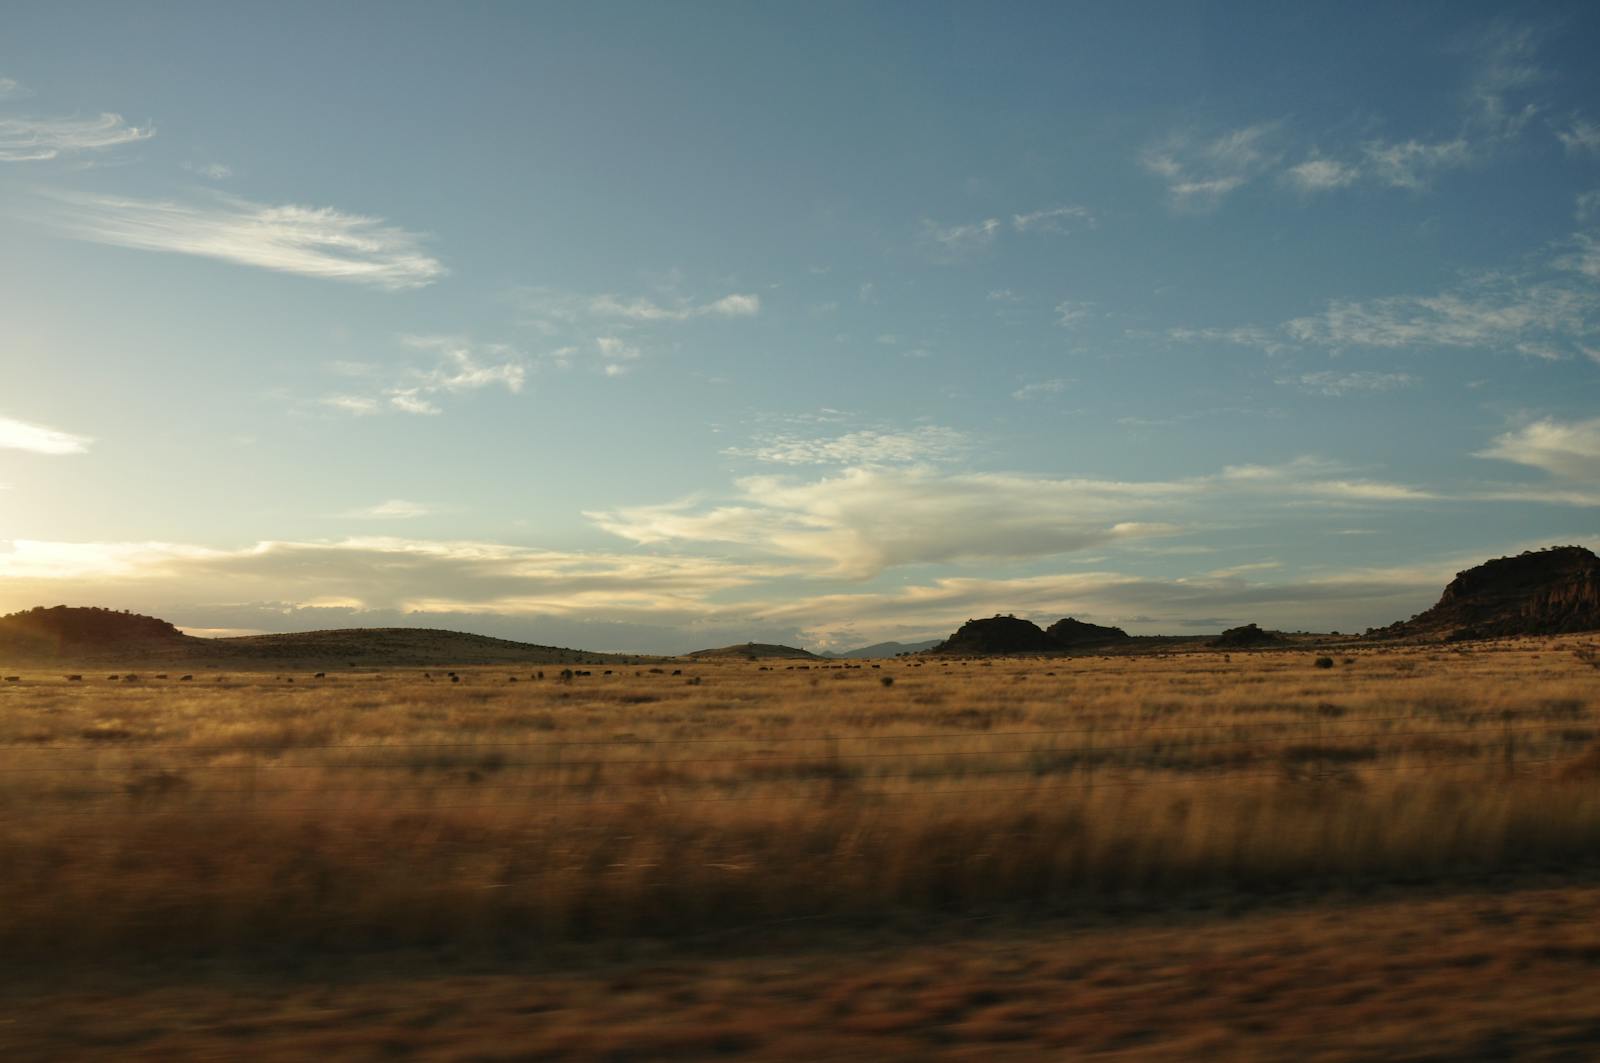
1. Presidio County, TX
- Area in extreme to exceptional drought: 100.0%
- Year-to-date precipitation, 2024: 5.7 inches
- Normal average annual precipitation, 1900-2000: 12.9 inches
- County seat: Marfa
Sponsor
Find a Vetted Financial Advisor
- Finding a fiduciary financial advisor doesn't have to be hard. SmartAsset's free tool matches you with up to 3 financial advisors that serve your area in 5 minutes.
- Each advisor has been vetted by SmartAsset and is held to a fiduciary standard to act in your best interests. Get on the path toward achieving your financial goals!