A Pacific Northwest Rainstorm Killed Three People: These Cities Got The Most Rain
 https://climatecrisis247.com/wp-content/uploads/2024/11/10963723-150x150.jpeg
Last week, an atmospheric river from the Pacific Ocean dumped once-in-millennium amounts of rain throughout the Northwest. The rain storm brought more than a foot of rain in some towns, killing at least three people and leaving hundreds of thousands without power.
Whence the next pandemic? Cities Where the Next Pandemic Is Most Likely to Break Out
Hiking plans? Lyme Disease Is Exploding in These Areas Due To Climate Change
In northern Bay Area cities like Santa Rosa, rainfall totals were nearly triple the amount of precipitation the city would normally receive for the entire month of November. A look at data from NOAA’s National Water Prediction Service reveals the cities that got the most rainfall last week.
To determine the cities that got the most rainfall last week, Climate Crisis 247 reviewed data on quantitative precipitation observations from NOAA’s National Water Prediction Service. Cities with at least 25,000 residents were ranked based on total rainfall accumulation over the period November 18 to November 25, 2024. Supplemental data on historical monthly normals for November precipitation for the years 1901 through 2000 are from NOAA’s National Centers for Environmental Information and are at the county level.
25. Citrus Heights, CA

- Total rainfall, November 18 to 25: 4.22 inches
- Historical November monthly rainfall, 1901-2000: 2.11 inches
- Total population: 87,127
24. Lincoln, CA

- Total rainfall, November 18 to 25: 4.29 inches
- Historical November monthly rainfall, 1901-2000: 5.35 inches
- Total population: 50,131
23. Palo Alto, CA
- Total rainfall, November 18 to 25: 4.34 inches
- Historical November monthly rainfall, 1901-2000: 2.46 inches
- Total population: 67,901
22. El Dorado Hills, CA

- Total rainfall, November 18 to 25: 4.35 inches
- Historical November monthly rainfall, 1901-2000: 5.03 inches
- Total population: 49,082
21. San Pablo, CA
- Total rainfall, November 18 to 25: 4.41 inches
- Historical November monthly rainfall, 1901-2000: 2.06 inches
- Total population: 31,907
20. El Cerrito, CA

- Total rainfall, November 18 to 25: 4.42 inches
- Historical November monthly rainfall, 1901-2000: 2.06 inches
- Total population: 25,869
19. Richmond, CA

- Total rainfall, November 18 to 25: 4.63 inches
- Historical November monthly rainfall, 1901-2000: 2.06 inches
- Total population: 115,619
18. Rocklin, CA
- Total rainfall, November 18 to 25: 4.63 inches
- Historical November monthly rainfall, 1901-2000: 5.35 inches
- Total population: 71,676
17. San Francisco, CA
- Total rainfall, November 18 to 25: 4.75 inches
- Historical November monthly rainfall, 1901-2000: 2.89 inches
- Total population: 851,036
16. Roseville, CA
- Total rainfall, November 18 to 25: 5.09 inches
- Historical November monthly rainfall, 1901-2000: 5.35 inches
- Total population: 148,879
15. Vacaville, CA

- Total rainfall, November 18 to 25: 5.11 inches
- Historical November monthly rainfall, 1901-2000: 2.22 inches
- Total population: 101,631
14. Fairfield, CA

- Total rainfall, November 18 to 25: 5.19 inches
- Historical November monthly rainfall, 1901-2000: 2.22 inches
- Total population: 119,420
13. Pacifica, CA
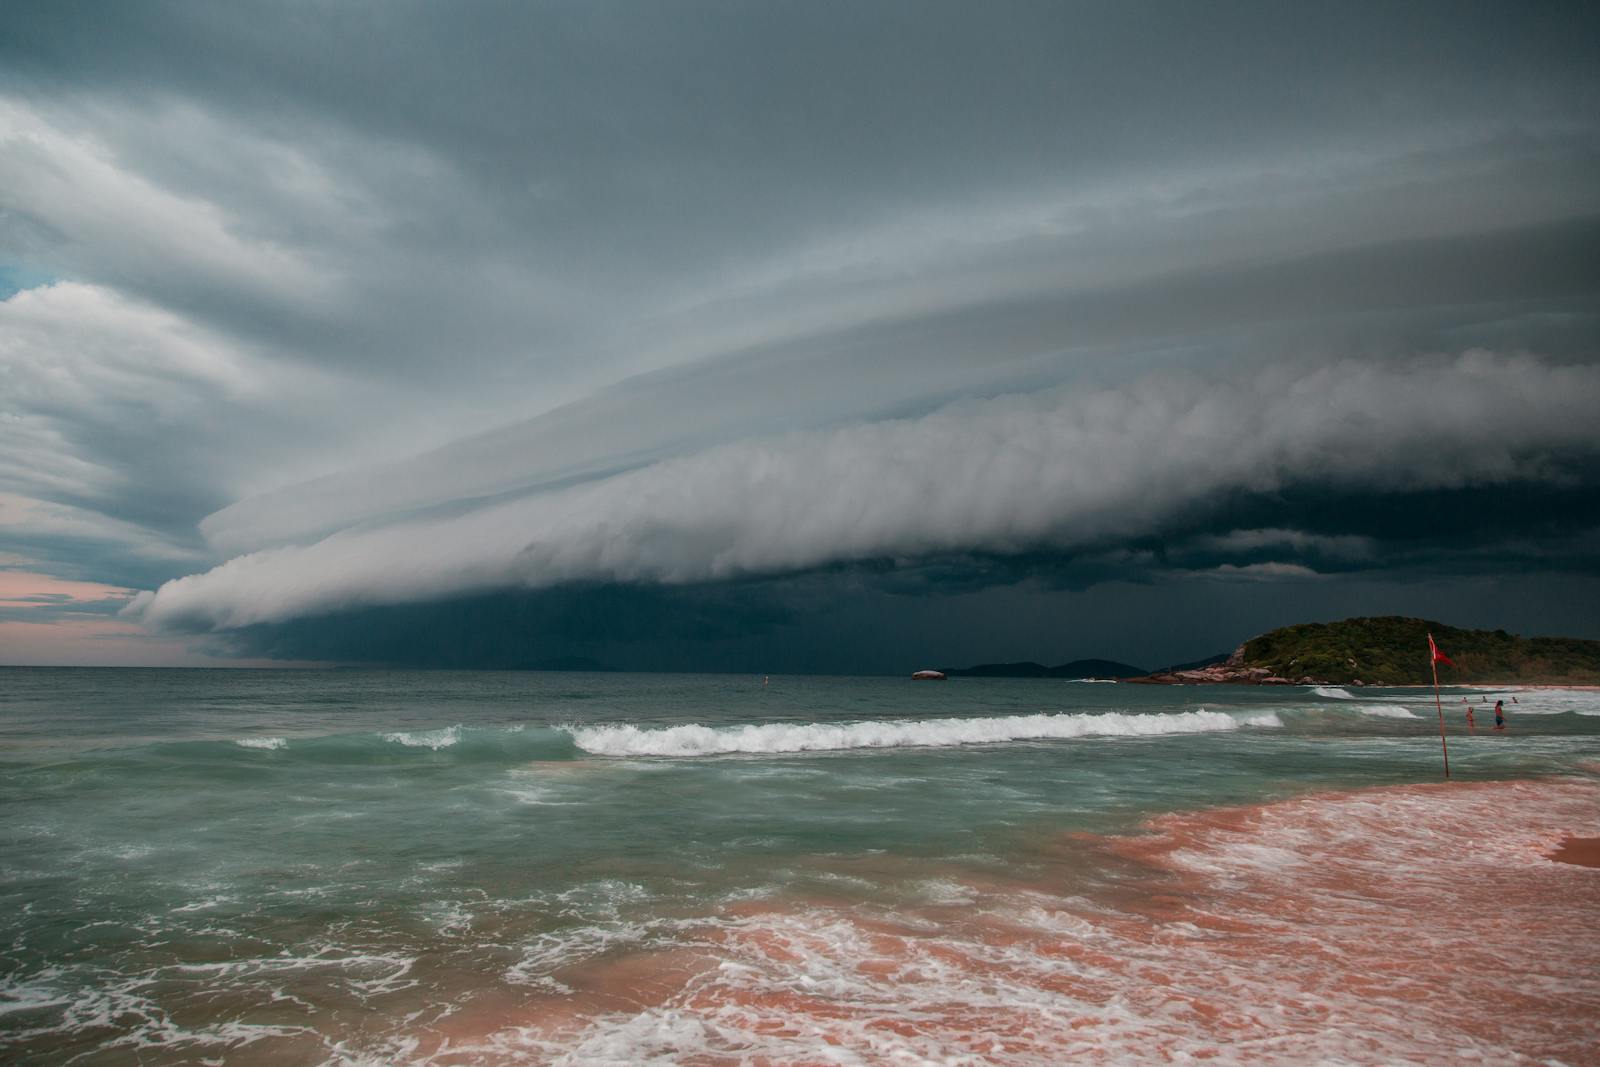
- Total rainfall, November 18 to 25: 5.23 inches
- Historical November monthly rainfall, 1901-2000: 3.16 inches
- Total population: 38,048
12. Yuba City, CA

- Total rainfall, November 18 to 25: 5.40 inches
- Historical November monthly rainfall, 1901-2000: 2.24 inches
- Total population: 69,535
11. Grants Pass, OR
- Total rainfall, November 18 to 25: 6.13 inches
- Historical November monthly rainfall, 1901-2000: 8.23 inches
- Total population: 39,131
10. Eureka, CA

- Total rainfall, November 18 to 25: 6.22 inches
- Historical November monthly rainfall, 1901-2000: 9.12 inches
- Total population: 26,519
9. San Rafael, CA
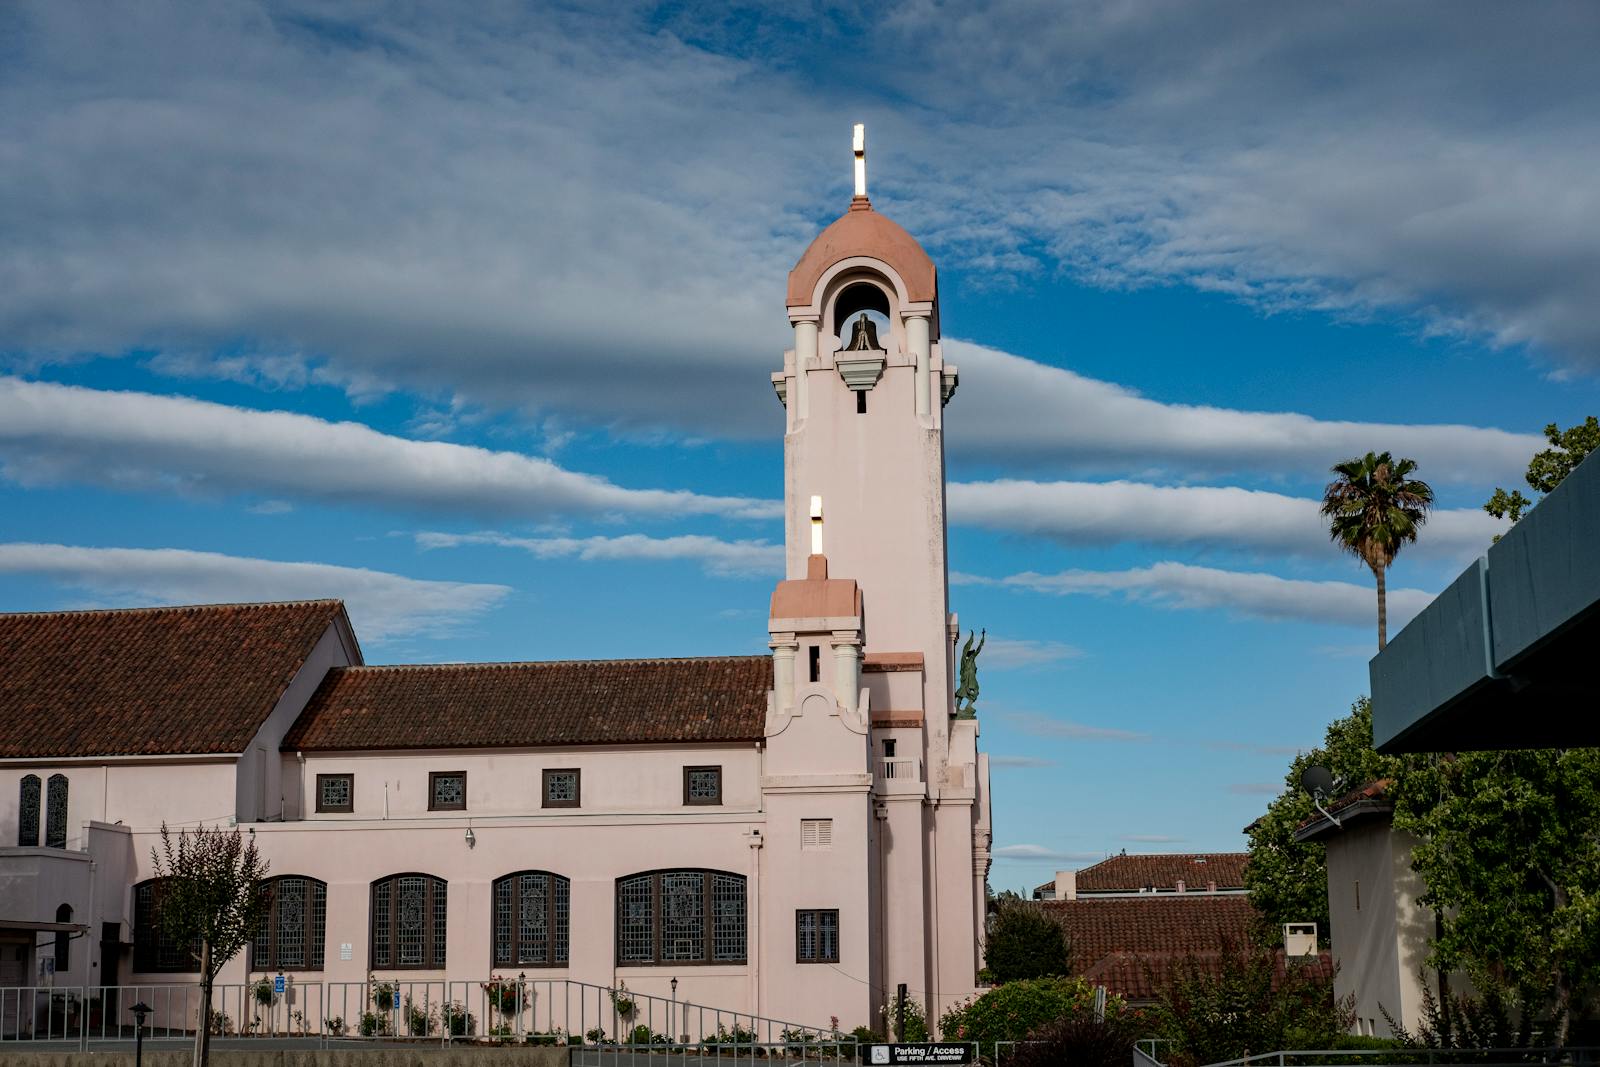
- Total rainfall, November 18 to 25: 7.49 inches
- Historical November monthly rainfall, 1901-2000: 4.39 inches
- Total population: 60,891
8. Napa, CA

- Total rainfall, November 18 to 25: 7.89 inches
- Historical November monthly rainfall, 1901-2000: 3.54 inches
- Total population: 79,233
7. Novato, CA
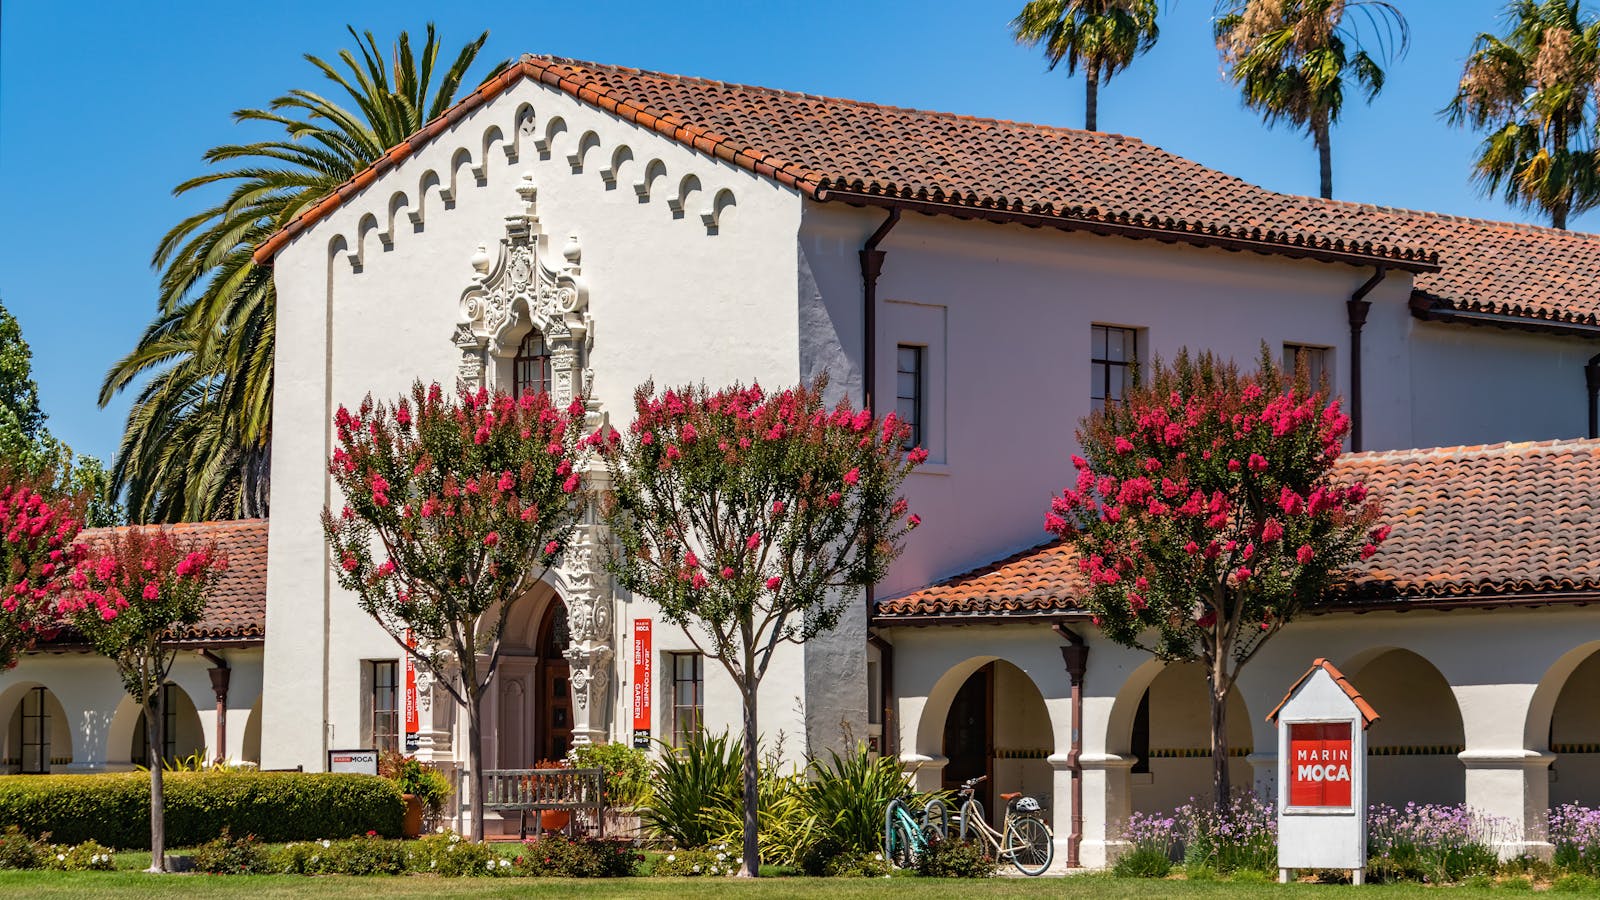
- Total rainfall, November 18 to 25: 8.31 inches
- Historical November monthly rainfall, 1901-2000: 4.39 inches
- Total population: 53,055
6. Petaluma, CA
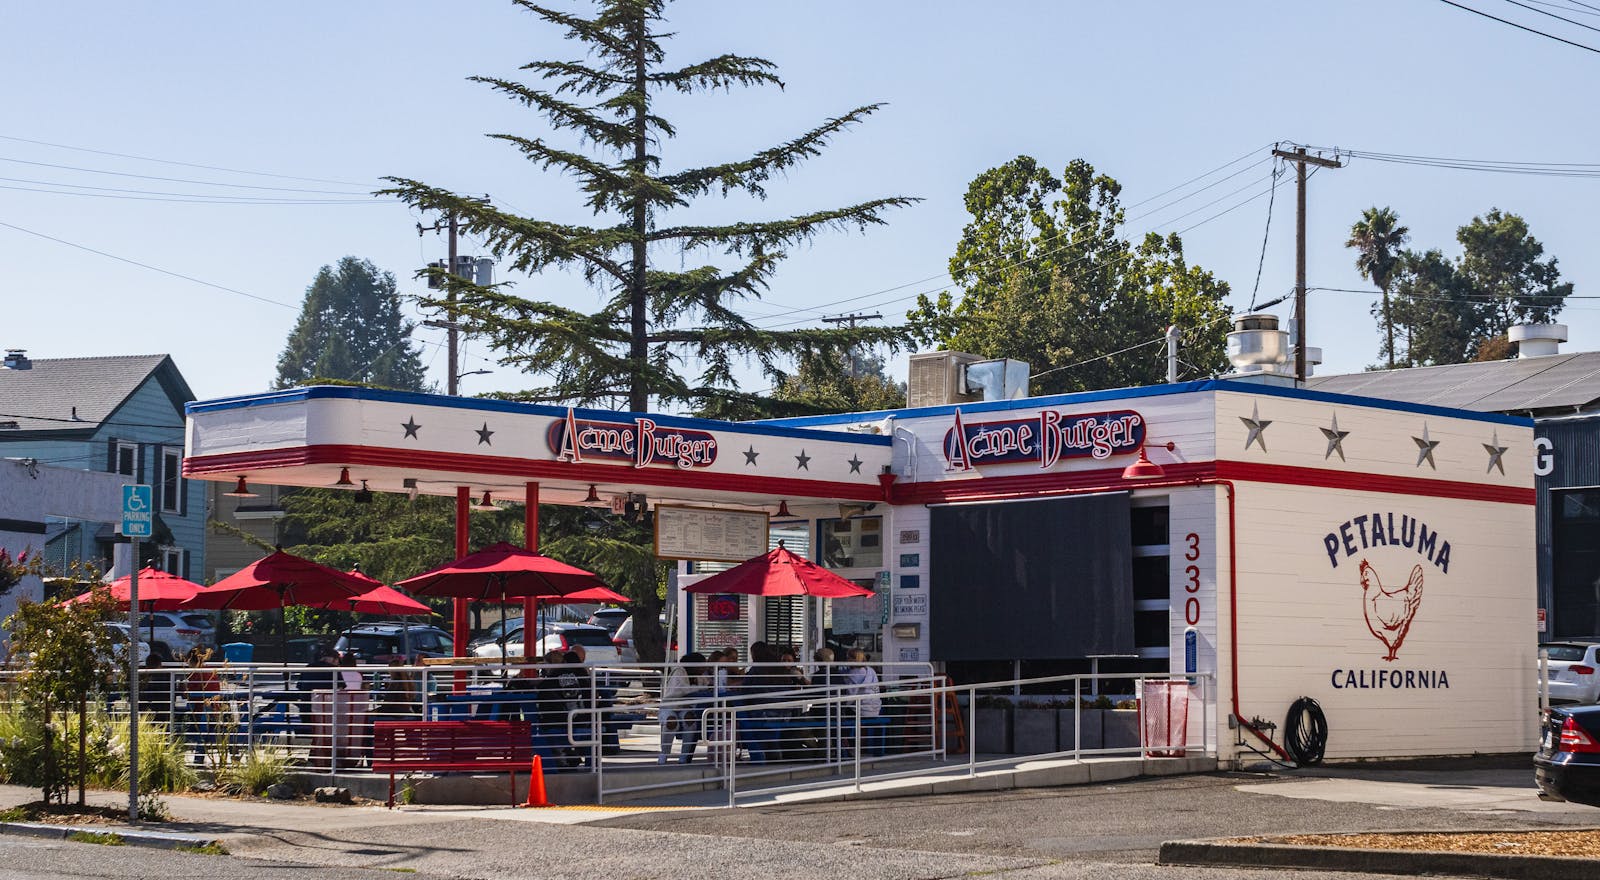
- Total rainfall, November 18 to 25: 9.65 inches
- Historical November monthly rainfall, 1901-2000: 5.21 inches
- Total population: 59,682
5. Rohnert Park, CA

- Total rainfall, November 18 to 25: 10.00 inches
- Historical November monthly rainfall, 1901-2000: 5.21 inches
- Total population: 44,461
4. Redding, CA
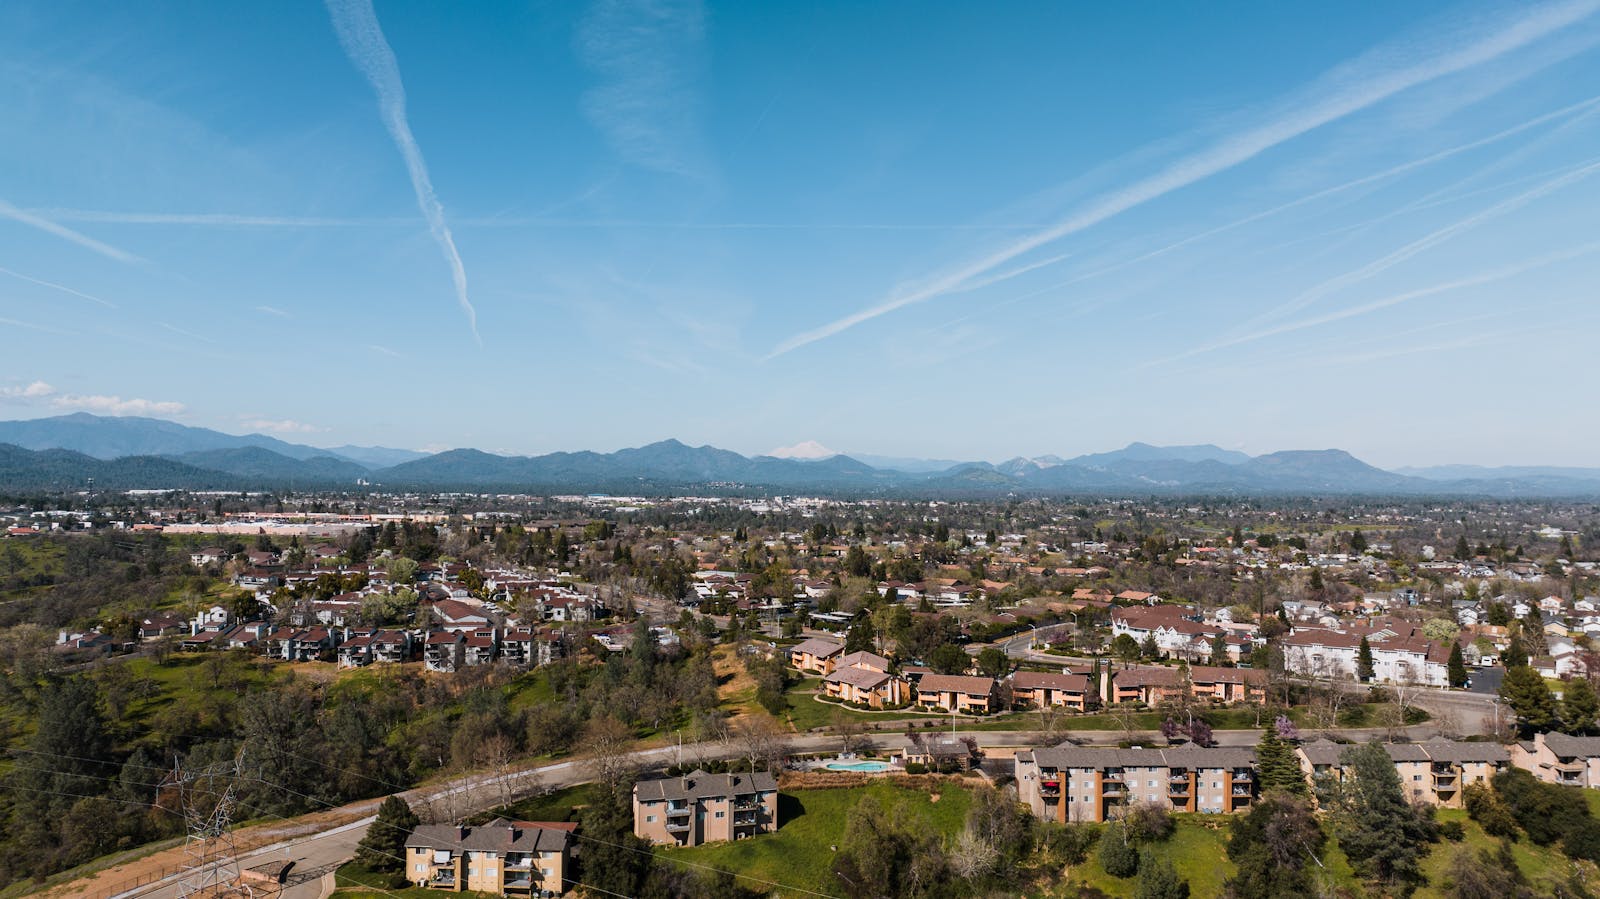
- Total rainfall, November 18 to 25: 12.56 inches
- Historical November monthly rainfall, 1901-2000: 5.36 inches
- Total population: 93,327
3. Chico, CA
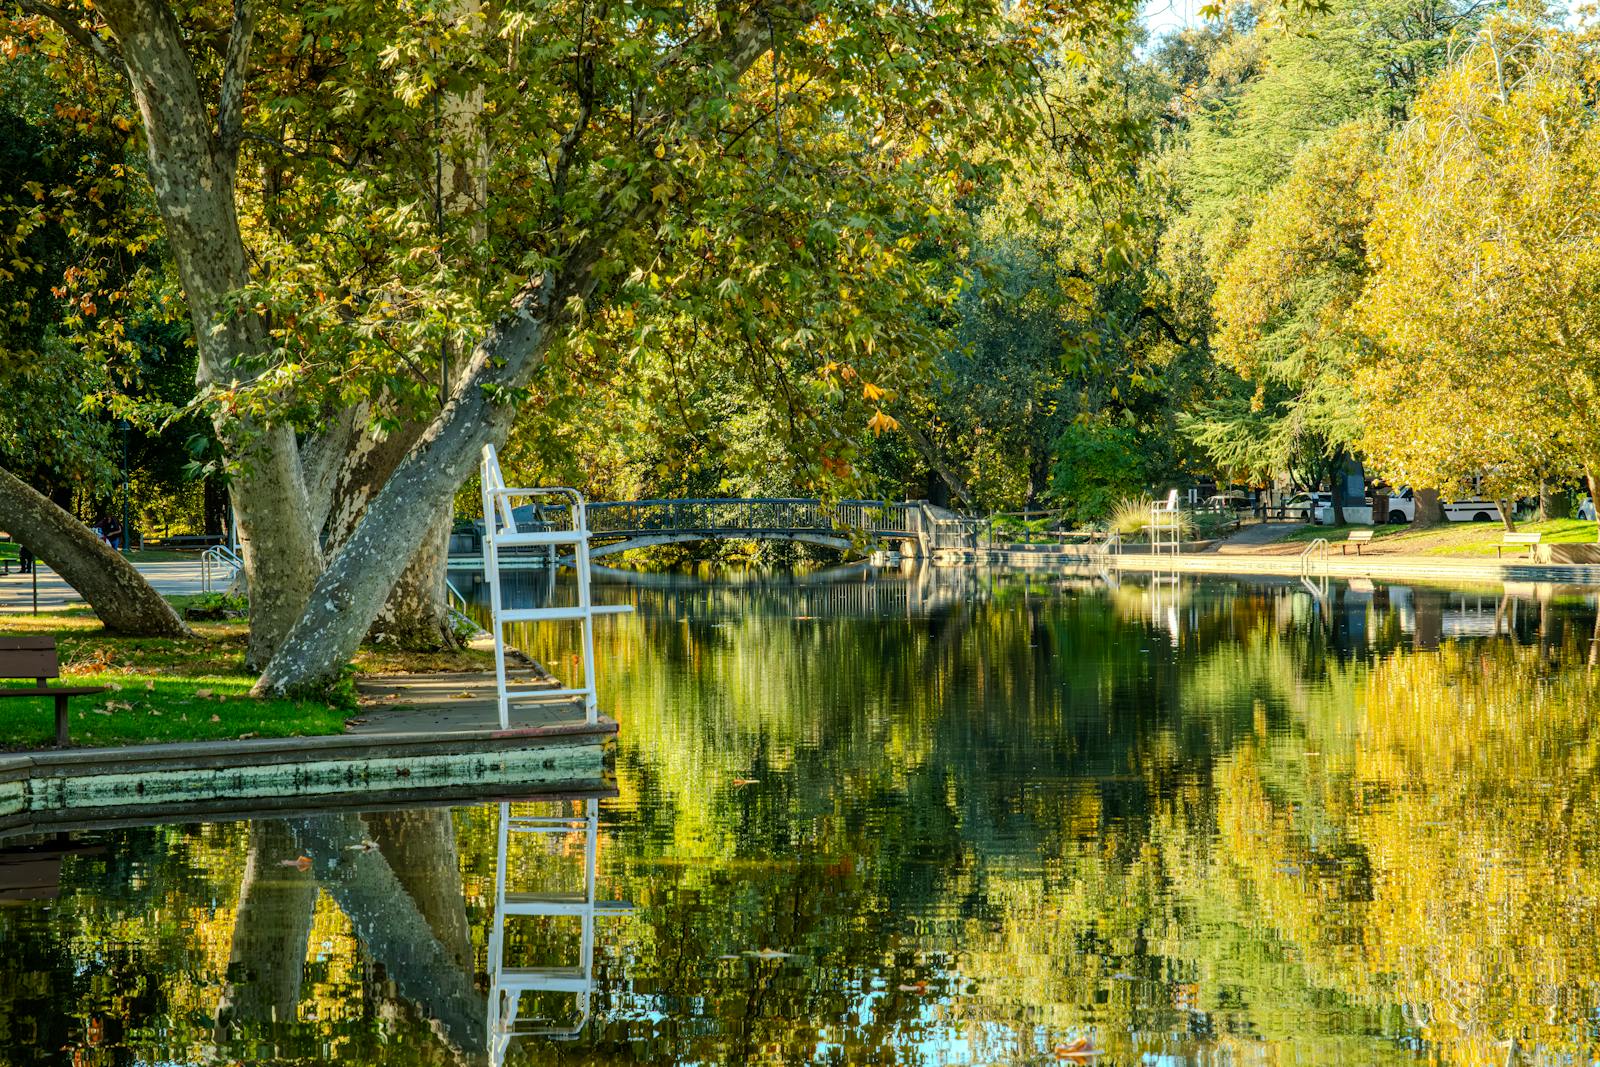
- Total rainfall, November 18 to 25: 12.56 inches
- Historical November monthly rainfall, 1901-2000: 5.35 inches
- Total population: 102,790
2. Santa Rosa, CA
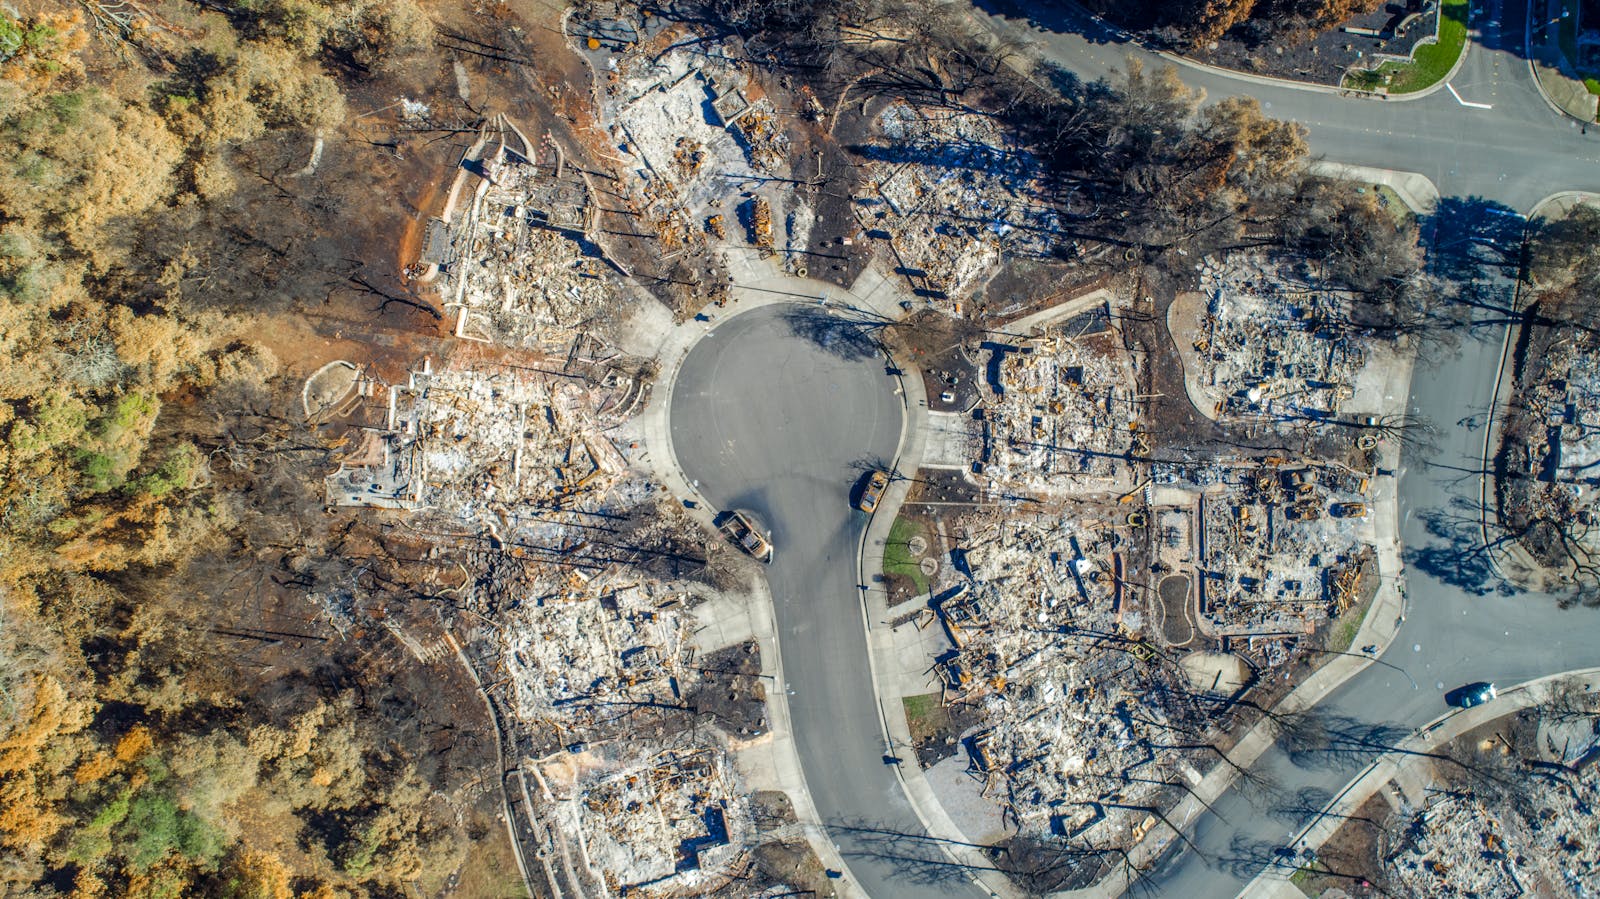
- Total rainfall, November 18 to 25: 13.59 inches
- Historical November monthly rainfall, 1901-2000: 5.21 inches
- Total population: 178,221
1. Windsor, CA

- Total rainfall, November 18 to 25: 14.24 inches
- Historical November monthly rainfall, 1901-2000: 5.21 inches
- Total population: 26,320
More from ClimateCrisis 247
- States Where the Government is Underestimating Flood Risk
- American Cities Where Summer Temperatures Are Projected to Surge
- The Cities Where Heat Risk Will Be Highest This Week
- River Gauges Monitor Flooding To Help Warn Residents: These High-Risk Rivers Need More
