American Cities Where Temperatures Soared in 2025
 https://climate-crisis-247-bucket.nyc3.cdn.digitaloceanspaces.com/wp-content/uploads/2025/09/07201913/2994353-150x150.jpeg
Heat is the leading cause of weather-related fatalities in the United States. According to the National Weather Service, an average of 238 Americans are killed by high temperatures annually. In the coming years, the public health risk posed by heat is only expected to grow, as in much of the country, summer heat is not only intensifying, but also lasting later into the year.
A recent report from the non-profit research group Climate Central indicates that hotter summer temperatures are largely a product of pollution-driven climate change. According to the study, over 21 million Americans experienced at least 30 days of temperatures at or above their local 90th percentile norm in summer 2025 because of human-caused climate change.
Using data from Climate Central, Climate Crisis 247 identified the American cities where summer temperatures soared in 2025. Cities are ranked on the difference between average temperatures in summer 2025 and average summer temperatures from 1991 to 2020. Only cities where temperature anomalies in summer 2025 exceeded 2°F are listed. All supplemental data, including population, historical temperature norms, and the number of days this summer where temperatures exceeded 90th percentile heat, as well as the number of those days in which excessive heat was linked to climate change, are also from Climate Central.
The 19 cities on this list span 13 states and are home to more than 10 million Americans.
19. Burlington, Vermont

- Avg. temperature in summer 2025 relative to baseline avg.: 2.1°F warmer
- Days in summer 2025 temperatures exceeded 90th percentile norm: 42 days (11 days attributable to climate change)
- 90th percentile summer temperature: 71.2°F
- Est. population: 123,307
18. Knoxville, Tennessee

- Avg. temperature in summer 2025 relative to baseline avg.: 2.1°F warmer
- Days in summer 2025 temperatures exceeded 90th percentile norm: 54 days (18 days attributable to climate change)
- 90th percentile summer temperature: 78.4°F
- Est. population: 615,829
17. Charleston, West Virginia

- Avg. temperature in summer 2025 relative to baseline avg.: 2.1°F warmer
- Days in summer 2025 temperatures exceeded 90th percentile norm: 56 days (21 days attributable to climate change)
- 90th percentile summer temperature: 76.3°F
- Est. population: 129,754
16. Bend, Oregon

- Avg. temperature in summer 2025 relative to baseline avg.: 2.2°F warmer
- Days in summer 2025 temperatures exceeded 90th percentile norm: 37 days (18 days attributable to climate change)
- 90th percentile summer temperature: 68.6°F
- Est. population: 111,774
15. Eugene, Oregon

- Avg. temperature in summer 2025 relative to baseline avg.: 2.2°F warmer
- Days in summer 2025 temperatures exceeded 90th percentile norm: 42 days (19 days attributable to climate change)
- 90th percentile summer temperature: 68.8°F
- Est. population: 270,990
14. Rockford, Illinois

- Avg. temperature in summer 2025 relative to baseline avg.: 2.2°F warmer
- Days in summer 2025 temperatures exceeded 90th percentile norm: 49 days (19 days attributable to climate change)
- 90th percentile summer temperature: 74.9°F
- Est. population: 273,237
13. Flagstaff, Arizona

- Avg. temperature in summer 2025 relative to baseline avg.: 2.2°F warmer
- Days in summer 2025 temperatures exceeded 90th percentile norm: 50 days (30 days attributable to climate change)
- 90th percentile summer temperature: 68.8°F
- Est. population: 80,167
12. Portland, Oregon

- Avg. temperature in summer 2025 relative to baseline avg.: 2.3°F warmer
- Days in summer 2025 temperatures exceeded 90th percentile norm: 41 days (17 days attributable to climate change)
- 90th percentile summer temperature: 70.1°F
- Est. population: 2,095,808
11. Denver, Colorado

- Avg. temperature in summer 2025 relative to baseline avg.: 2.4°F warmer
- Days in summer 2025 temperatures exceeded 90th percentile norm: 52 days (21 days attributable to climate change)
- 90th percentile summer temperature: 75.3°F
- Est. population: 2,687,458
10. Hazard, Kentucky

- Avg. temperature in summer 2025 relative to baseline avg.: 2.4°F warmer
- Days in summer 2025 temperatures exceeded 90th percentile norm: 56 days (21 days attributable to climate change)
- 90th percentile summer temperature: 77.5°F
- Est. population: 5,194
9. Tucson, Arizona

- Avg. temperature in summer 2025 relative to baseline avg.: 2.4°F warmer
- Days in summer 2025 temperatures exceeded 90th percentile norm: 54 days (30 days attributable to climate change)
- 90th percentile summer temperature: 88.2°F
- Est. population: 878,320
8. Bristol, Tennessee

- Avg. temperature in summer 2025 relative to baseline avg.: 2.5°F warmer
- Days in summer 2025 temperatures exceeded 90th percentile norm: 56 days (15 days attributable to climate change)
- 90th percentile summer temperature: 75.2°F
- Est. population: 68,083
7. Grand Junction, Colorado

- Avg. temperature in summer 2025 relative to baseline avg.: 2.6°F warmer
- Days in summer 2025 temperatures exceeded 90th percentile norm: 62 days (44 days attributable to climate change)
- 90th percentile summer temperature: 75.8°F
- Est. population: 138,416
6. Salt Lake City, Utah
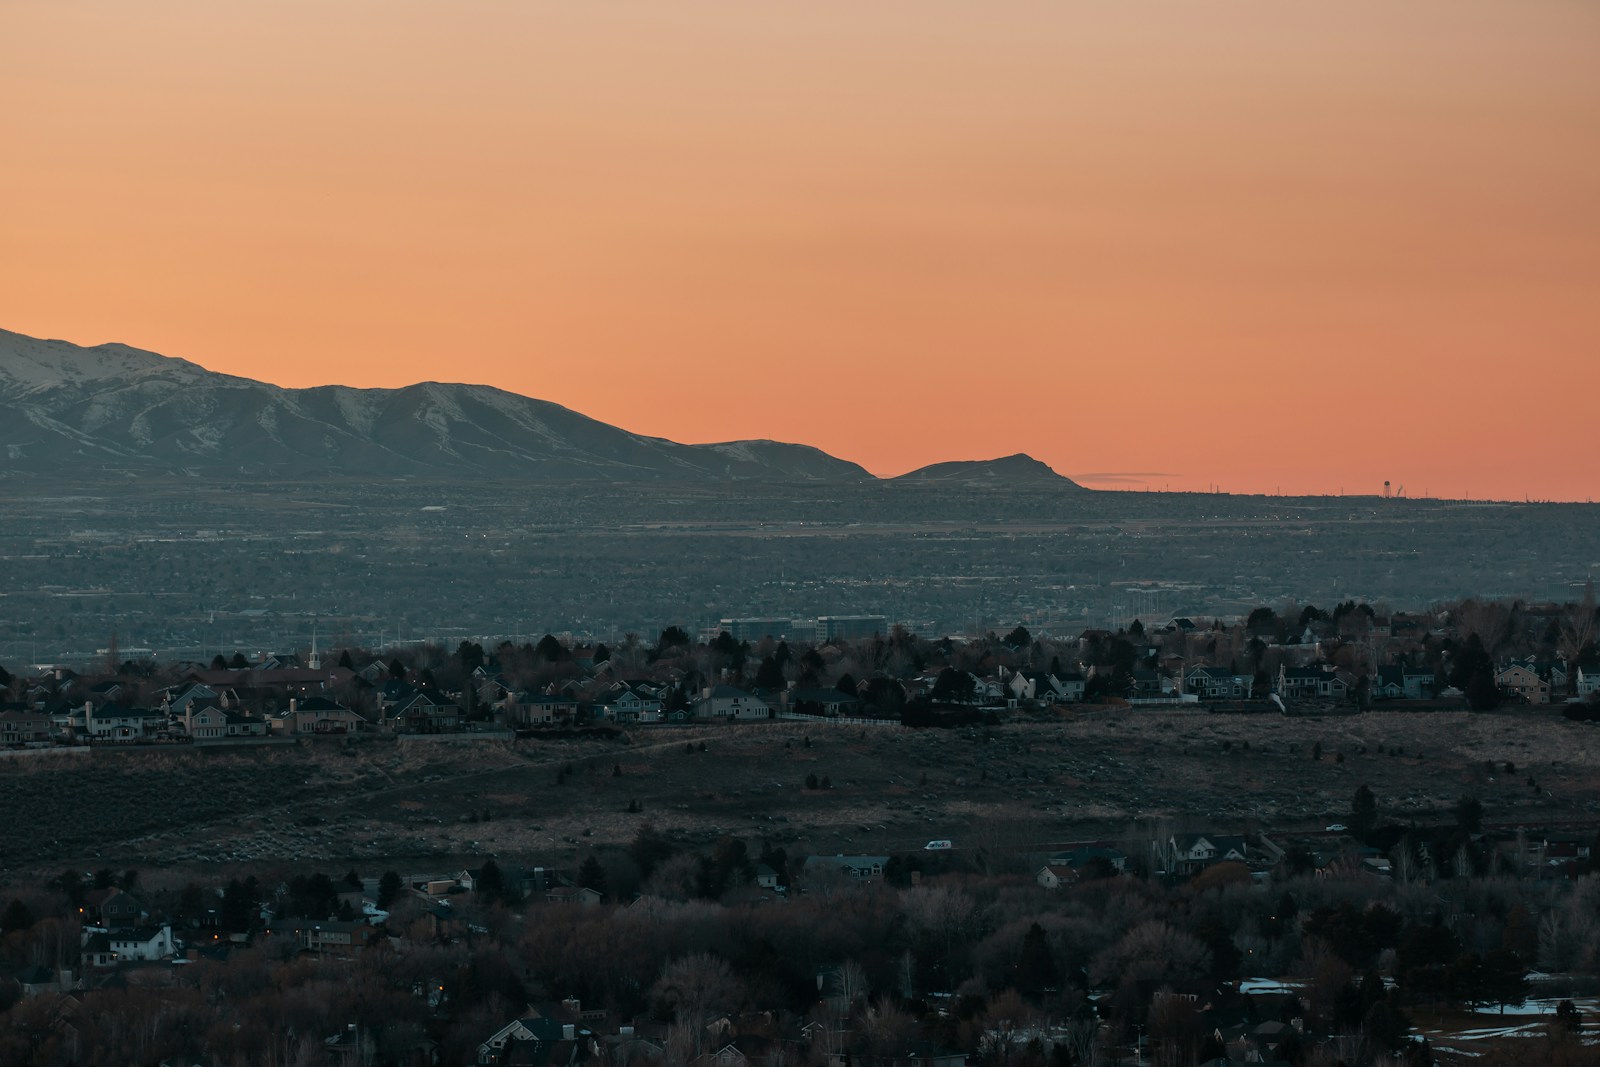
- Avg. temperature in summer 2025 relative to baseline avg.: 2.6°F warmer
- Days in summer 2025 temperatures exceeded 90th percentile norm: 56 days (44 days attributable to climate change)
- 90th percentile summer temperature: 77.4°F
- Est. population: 1,173,879
5. Yakima, Washington
- Avg. temperature in summer 2025 relative to baseline avg.: 2.7°F warmer
- Days in summer 2025 temperatures exceeded 90th percentile norm: 45 days (24 days attributable to climate change)
- 90th percentile summer temperature: 73.7°F
- Est. population: 132,354
4. Fresno, California

- Avg. temperature in summer 2025 relative to baseline avg.: 3°F warmer
- Days in summer 2025 temperatures exceeded 90th percentile norm: 55 days (39 days attributable to climate change)
- 90th percentile summer temperature: 83.7°F
- Est. population: 725,276
3. Missoula, Montana

- Avg. temperature in summer 2025 relative to baseline avg.: 3.3°F warmer
- Days in summer 2025 temperatures exceeded 90th percentile norm: 46 days (21 days attributable to climate change)
- 90th percentile summer temperature: 66.6°F
- Est. population: 88,780
2. Lewiston, Idaho

- Avg. temperature in summer 2025 relative to baseline avg.: 3.4°F warmer
- Days in summer 2025 temperatures exceeded 90th percentile norm: 45 days (16 days attributable to climate change)
-
90th percentile summer temperature: 72.8°F
-
Est. population: 34,270
1. Spokane, Washington

- Avg. temperature in summer 2025 relative to baseline avg.: 3.4°F warmer
- Days in summer 2025 temperatures exceeded 90th percentile norm: 47 days (19 days attributable to climate change)
- 90th percentile summer temperature: 72.9°F
- Est. population: 456,219