
As Temperatures Hit 112°F in Phoenix, These Cities Have the Worst ‘Urban Heat Islands’
 https://climate-crisis-247-bucket.nyc3.cdn.digitaloceanspaces.com/wp-content/uploads/2025/06/07215323/qcoffqngjww-1-150x150.jpg
Just like last summer, and the summer before that, this summer is forecast to be one of the hottest on record. Major metro areas like Phoenix and Dallas have already experienced weeks of 100°F days, while hundreds of cities across the country have broken daily heat records by several degrees.
Not in Kansas anymore? Tornado Alley Is Expanding South Into These Cities
Dying for air? Climate Activism Is Turning Deadly In These Cities
As climate change amplifies summer heat, rising temperatures can pose significant threats to health and quality of life in major cities. In many dense urban areas, lack of tree cover and previous surfaces can amplify surface temperature, creating urban heat islands with temperatures 10 to 15 degrees higher than the surrounding suburbs. Many urban heat islands are disproportionately populated by low-income households and communities of color. Our new nationwide analysis reveals the cities where an increase in population density has the greatest effect on surface temperature, revealing the cities with the worst urban heat islands.
To determine the worst urban heat islands, Climate Crisis 247 reviewed tract-level data on land surface temperature from the USGS Landsat program and the U.S. Census Bureau’s 2023 American Community Survey. Cities were ranked based on the regression coefficient of population density and average land surface temperature in July and August at the census tract level. Census tract data were aggregated to the Census place level using spatial boundary definitions from the U.S. Census Bureau. Only cities with at least 25,000 residents were considered.
20. Omaha, NE
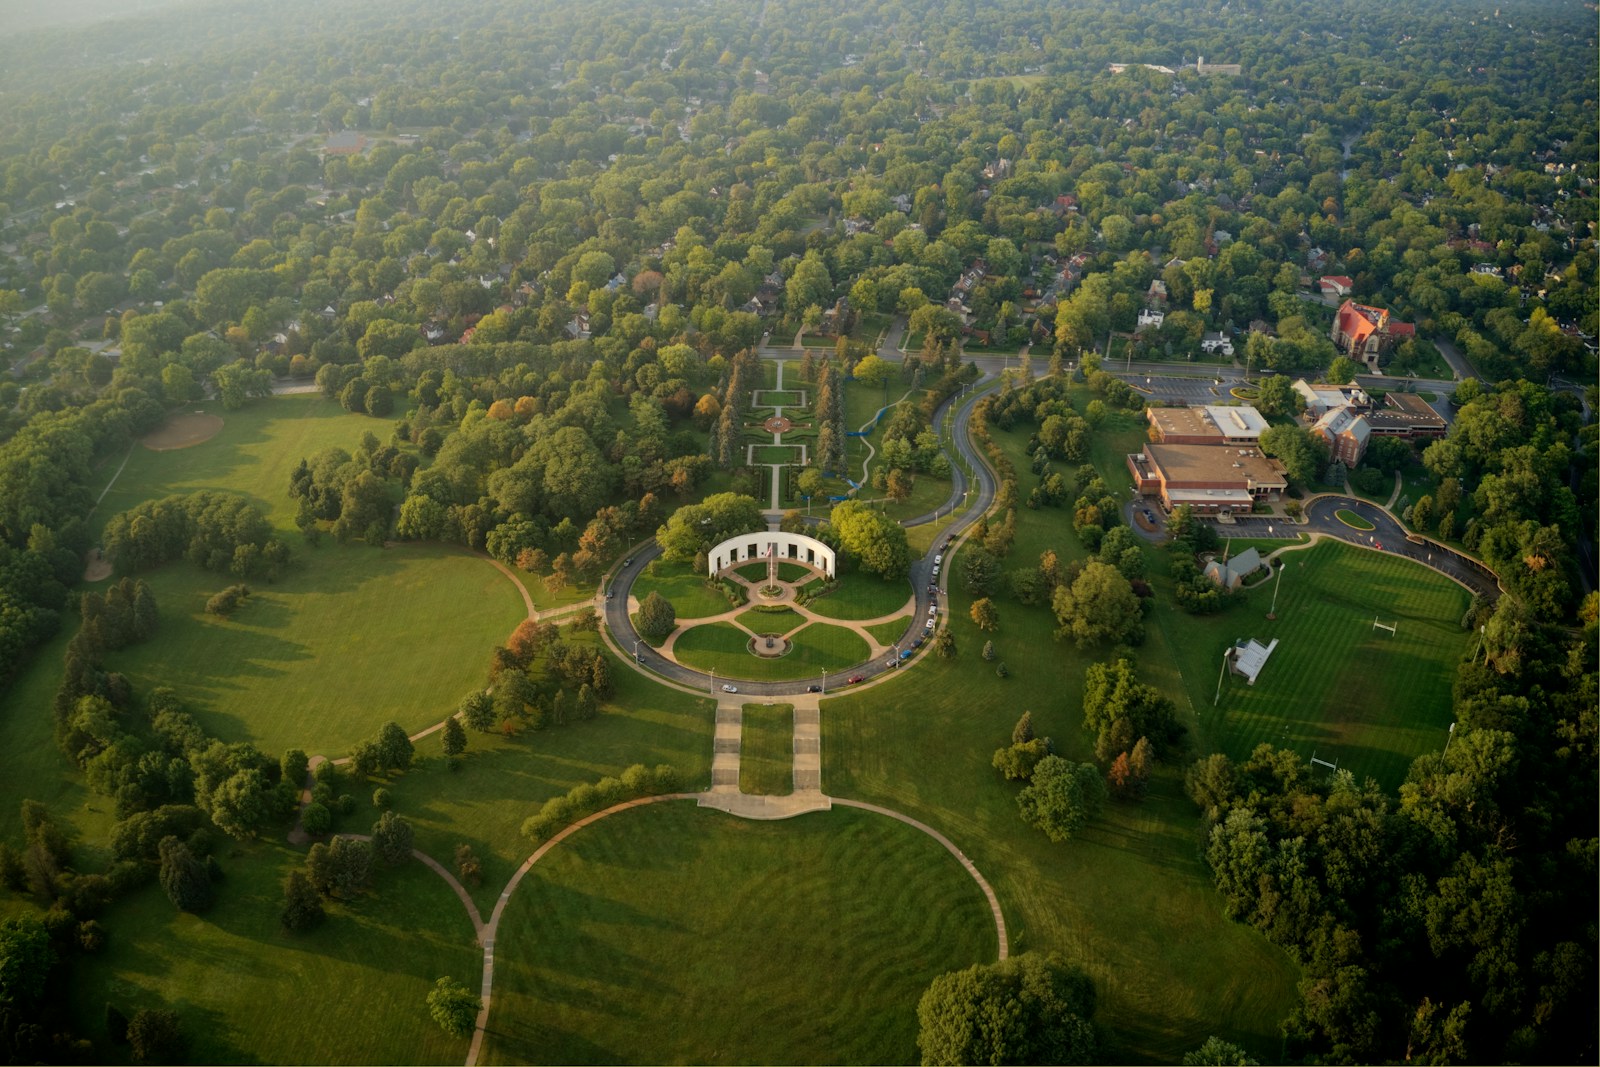
- Temperature effect of density increase of +500 people per square mile: +1.1°F
- Temperature difference between 10 hottest and coolest tracts: +14.9°F
- Average citywide summer land surface temperature: 96.1°F
- Total population: 489,201
19. Washington, DC

- Temperature effect of density increase of +500 people per square mile: +1.1°F
- Temperature difference between 10 hottest and coolest tracts: +14.6°F
- Average citywide summer land surface temperature: 96.5°F
- Total population: 670,587
18. Portland, OR
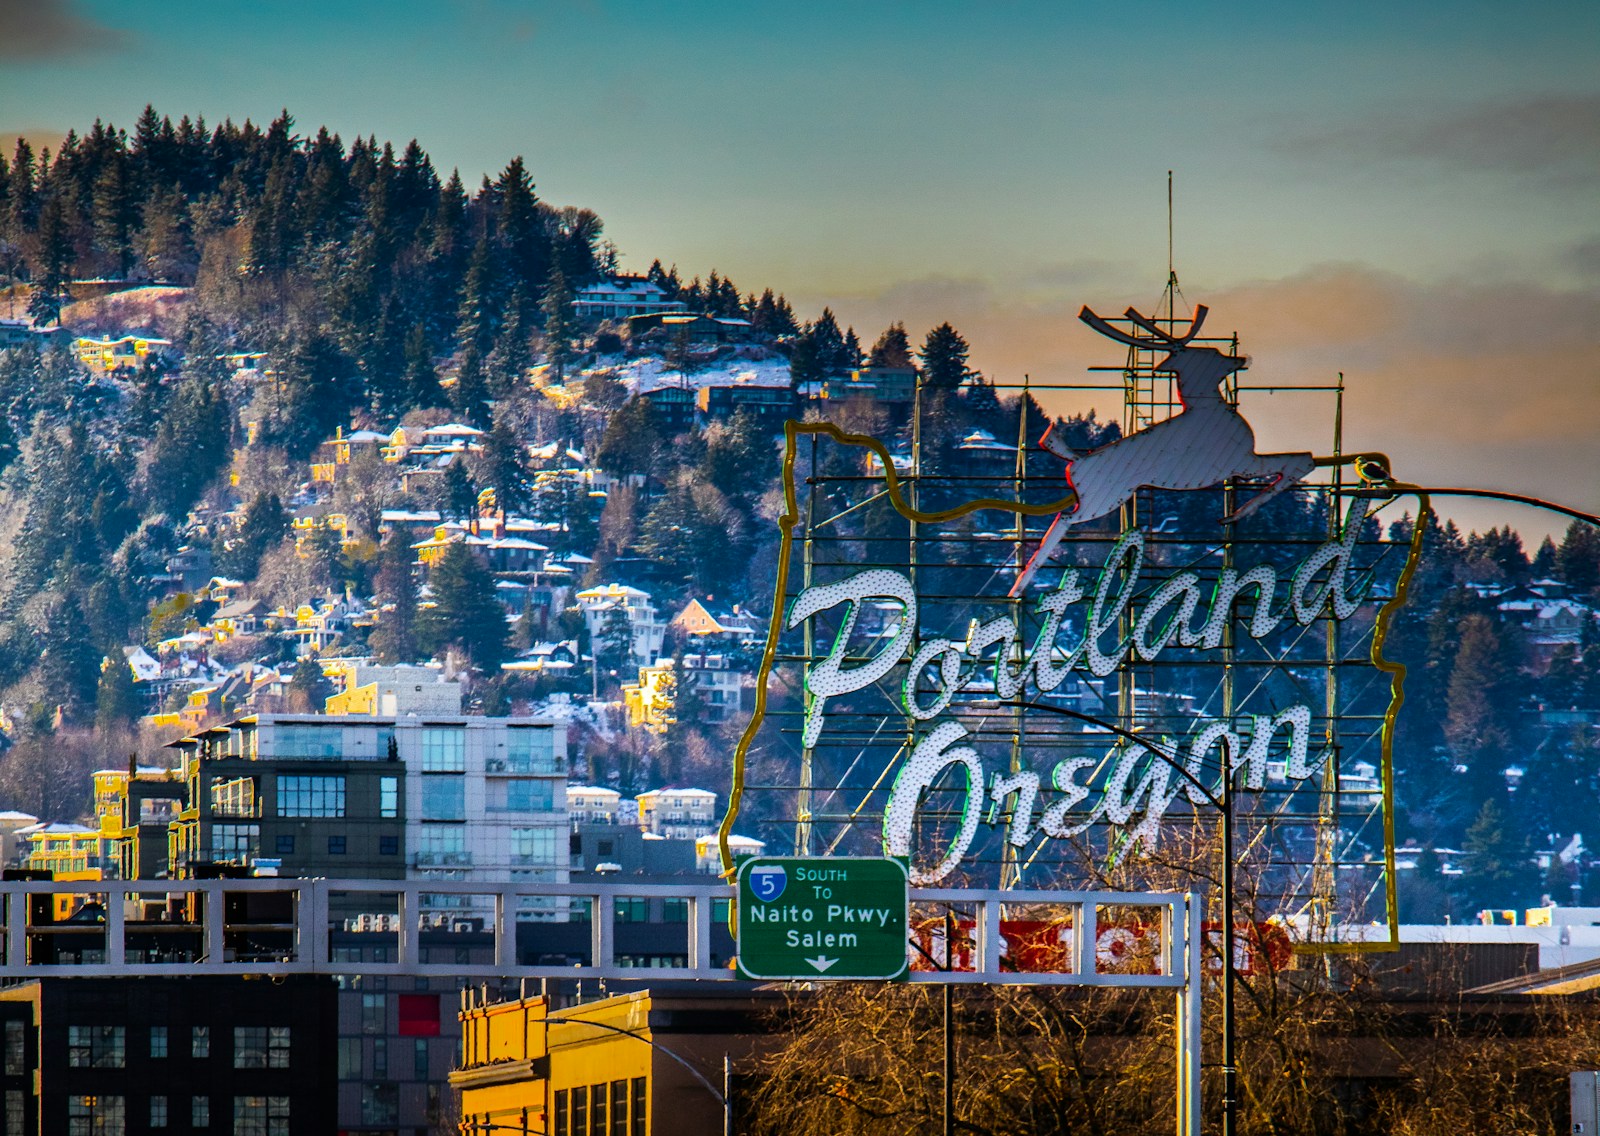
- Temperature effect of density increase of +500 people per square mile: +1.2°F
- Temperature difference between 10 hottest and coolest tracts: +19.1°F
- Average citywide summer land surface temperature: 97.3°F
- Total population: 646,101
17. Raleigh, NC
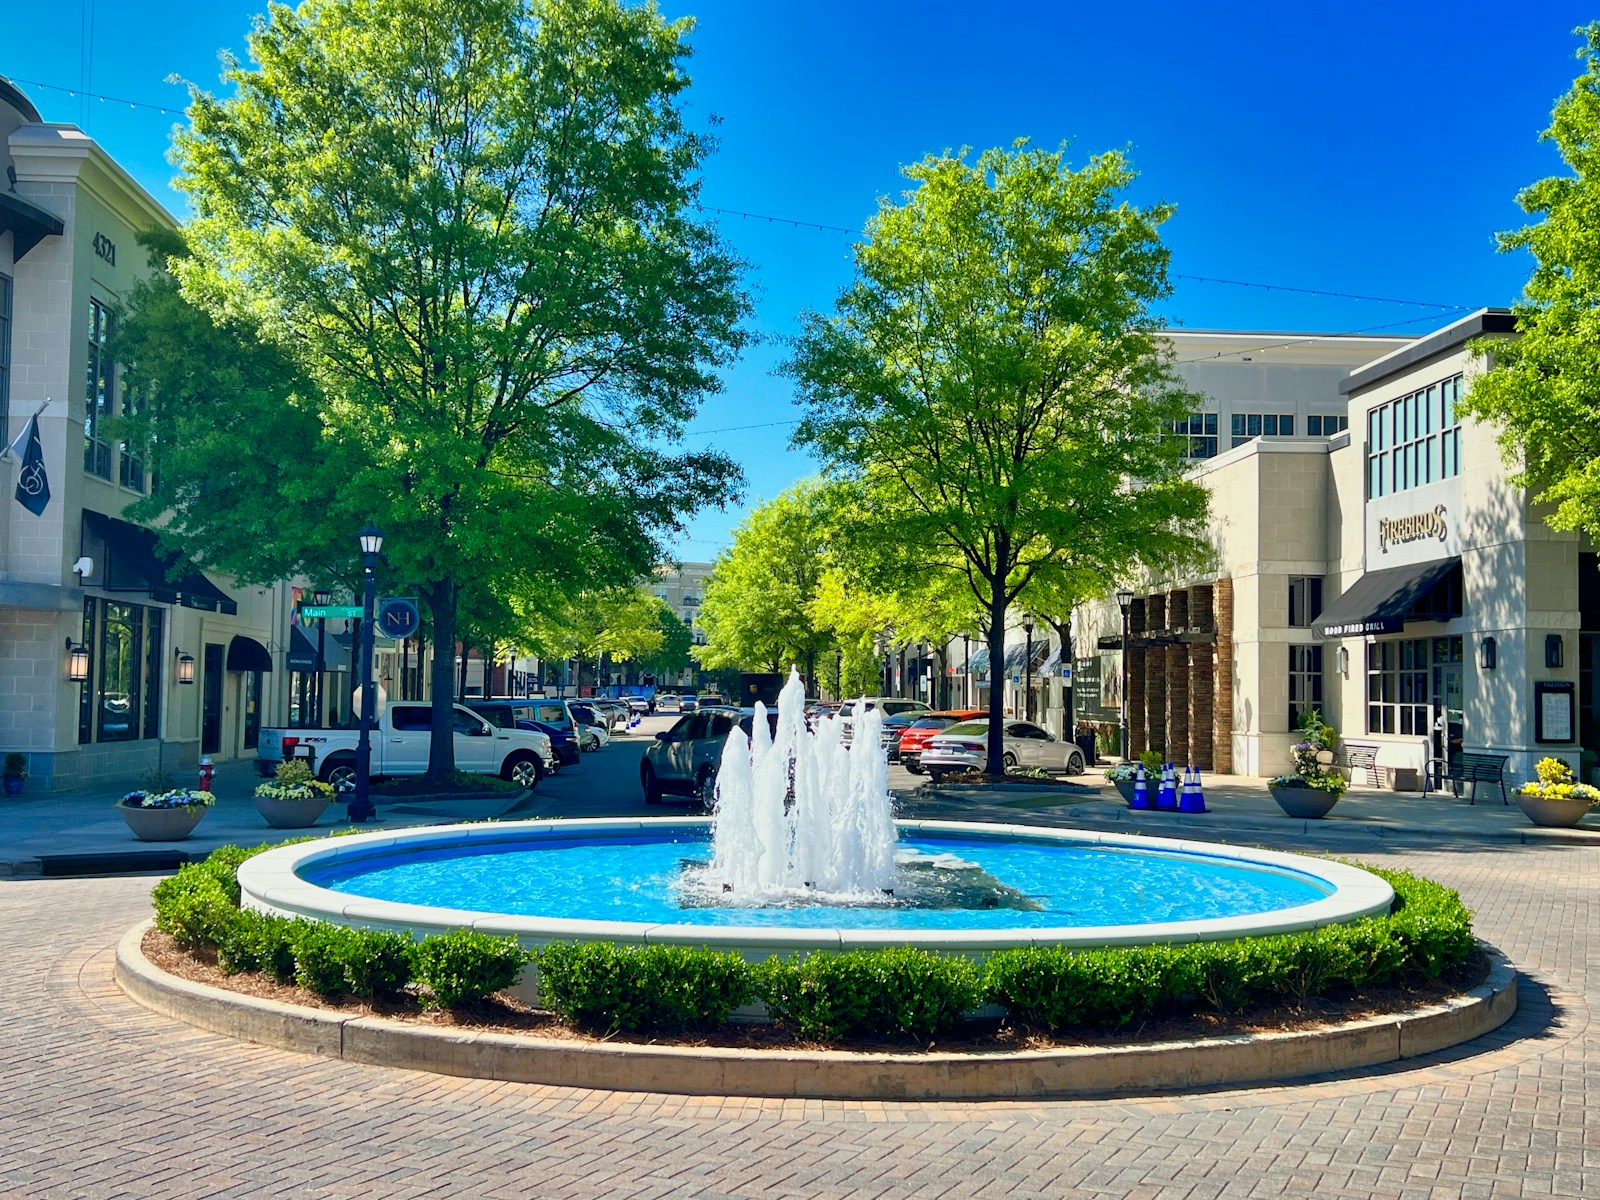
- Temperature effect of density increase of +500 people per square mile: +1.2°F
- Temperature difference between 10 hottest and coolest tracts: +14.8°F
- Average citywide summer land surface temperature: 93.5°F
- Total population: 465,517
16. St. Paul, MN

- Temperature effect of density increase of +500 people per square mile: +1.2°F
- Temperature difference between 10 hottest and coolest tracts: +11.6°F
- Average citywide summer land surface temperature: 92.4°F
- Total population: 308,806
15. Chandler, AZ

- Temperature effect of density increase of +500 people per square mile: +1.2°F
- Temperature difference between 10 hottest and coolest tracts: +5.9°F
- Average citywide summer land surface temperature: 124.4°F
- Total population: 275,618
14. Charlotte, NC
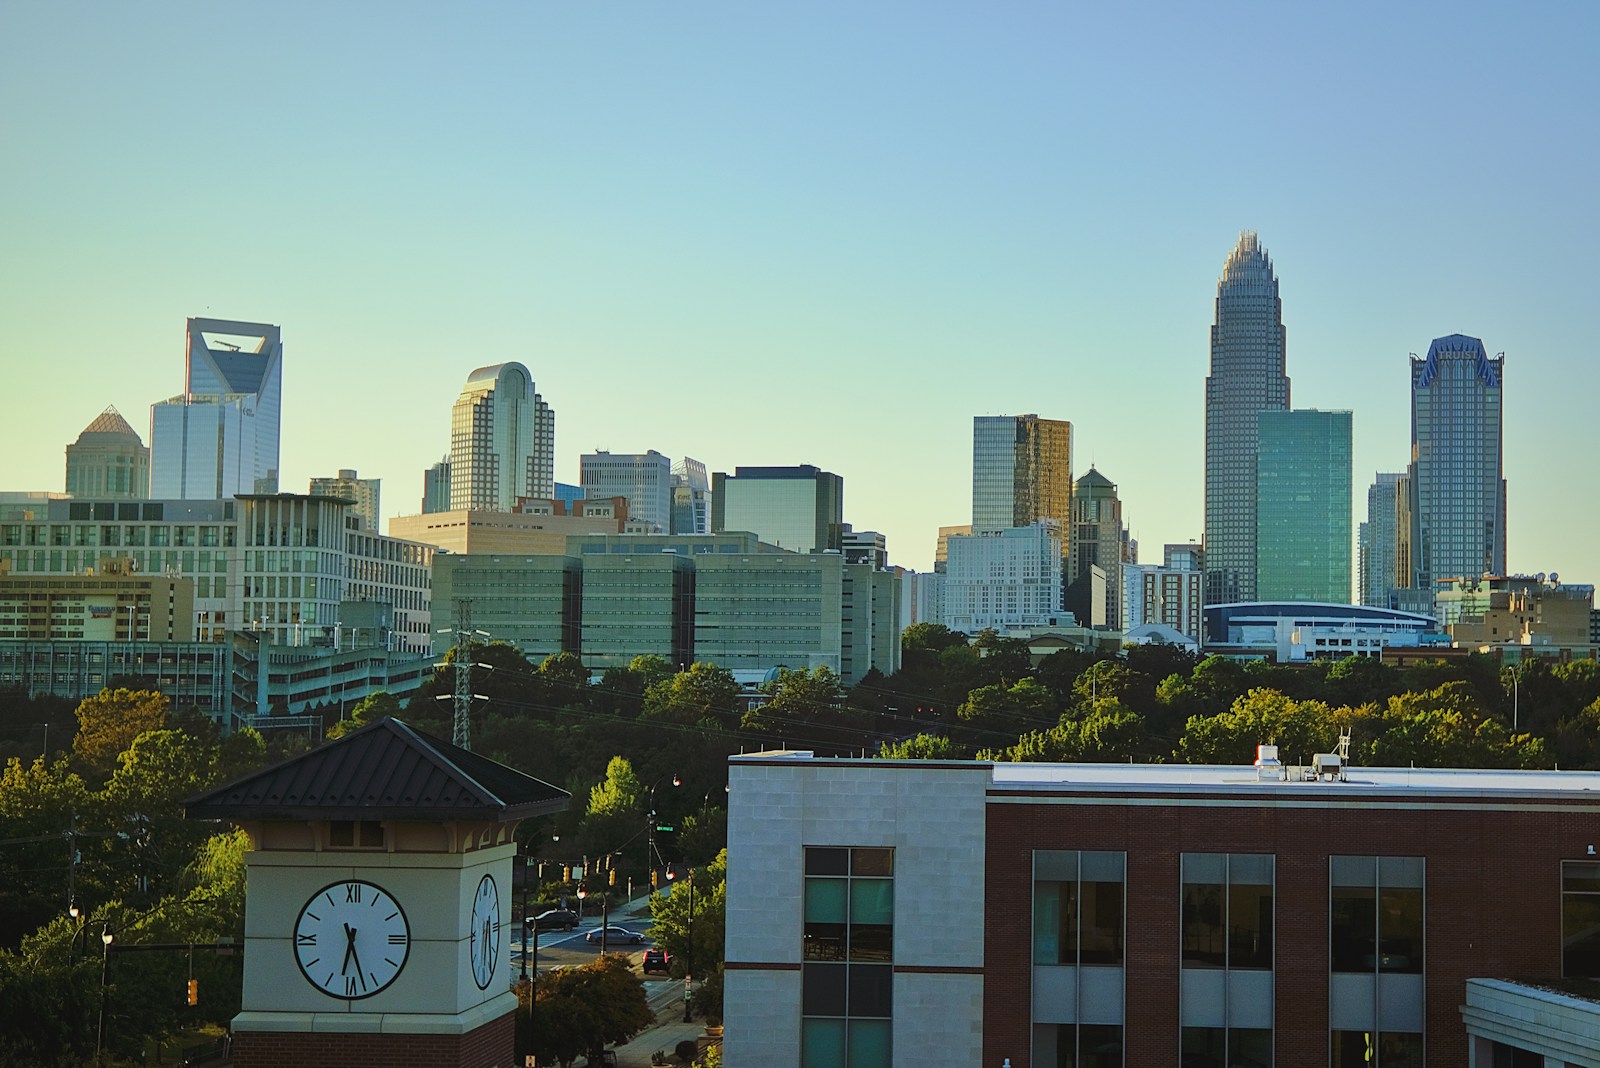
- Temperature effect of density increase of +500 people per square mile: +1.4°F
- Temperature difference between 10 hottest and coolest tracts: +15.5°F
- Average citywide summer land surface temperature: 95.6°F
- Total population: 875,045
13. Durham, NC

- Temperature effect of density increase of +500 people per square mile: +1.4°F
- Temperature difference between 10 hottest and coolest tracts: +14.3°F
- Average citywide summer land surface temperature: 92.1°F
- Total population: 284,094
12. St. Louis, MO

- Temperature effect of density increase of +500 people per square mile: +1.4°F
- Temperature difference between 10 hottest and coolest tracts: +10.1°F
- Average citywide summer land surface temperature: 101.8°F
- Total population: 298,018
11. Reno, NV

- Temperature effect of density increase of +500 people per square mile: +1.5°F
- Temperature difference between 10 hottest and coolest tracts: +8.7°F
- Average citywide summer land surface temperature: 117.5°F
- Total population: 265,196
10. Phoenix, AZ

- Temperature effect of density increase of +500 people per square mile: +1.5°F
- Temperature difference between 10 hottest and coolest tracts: +10.0°F
- Average citywide summer land surface temperature: 126.6°F
- Total population: 1,609,456
9. Mesa, AZ

- Temperature effect of density increase of +500 people per square mile: +1.6°F
- Temperature difference between 10 hottest and coolest tracts: +6.8°F
- Average citywide summer land surface temperature: 126.1°F
- Total population: 503,390
8. Jersey City, NJ
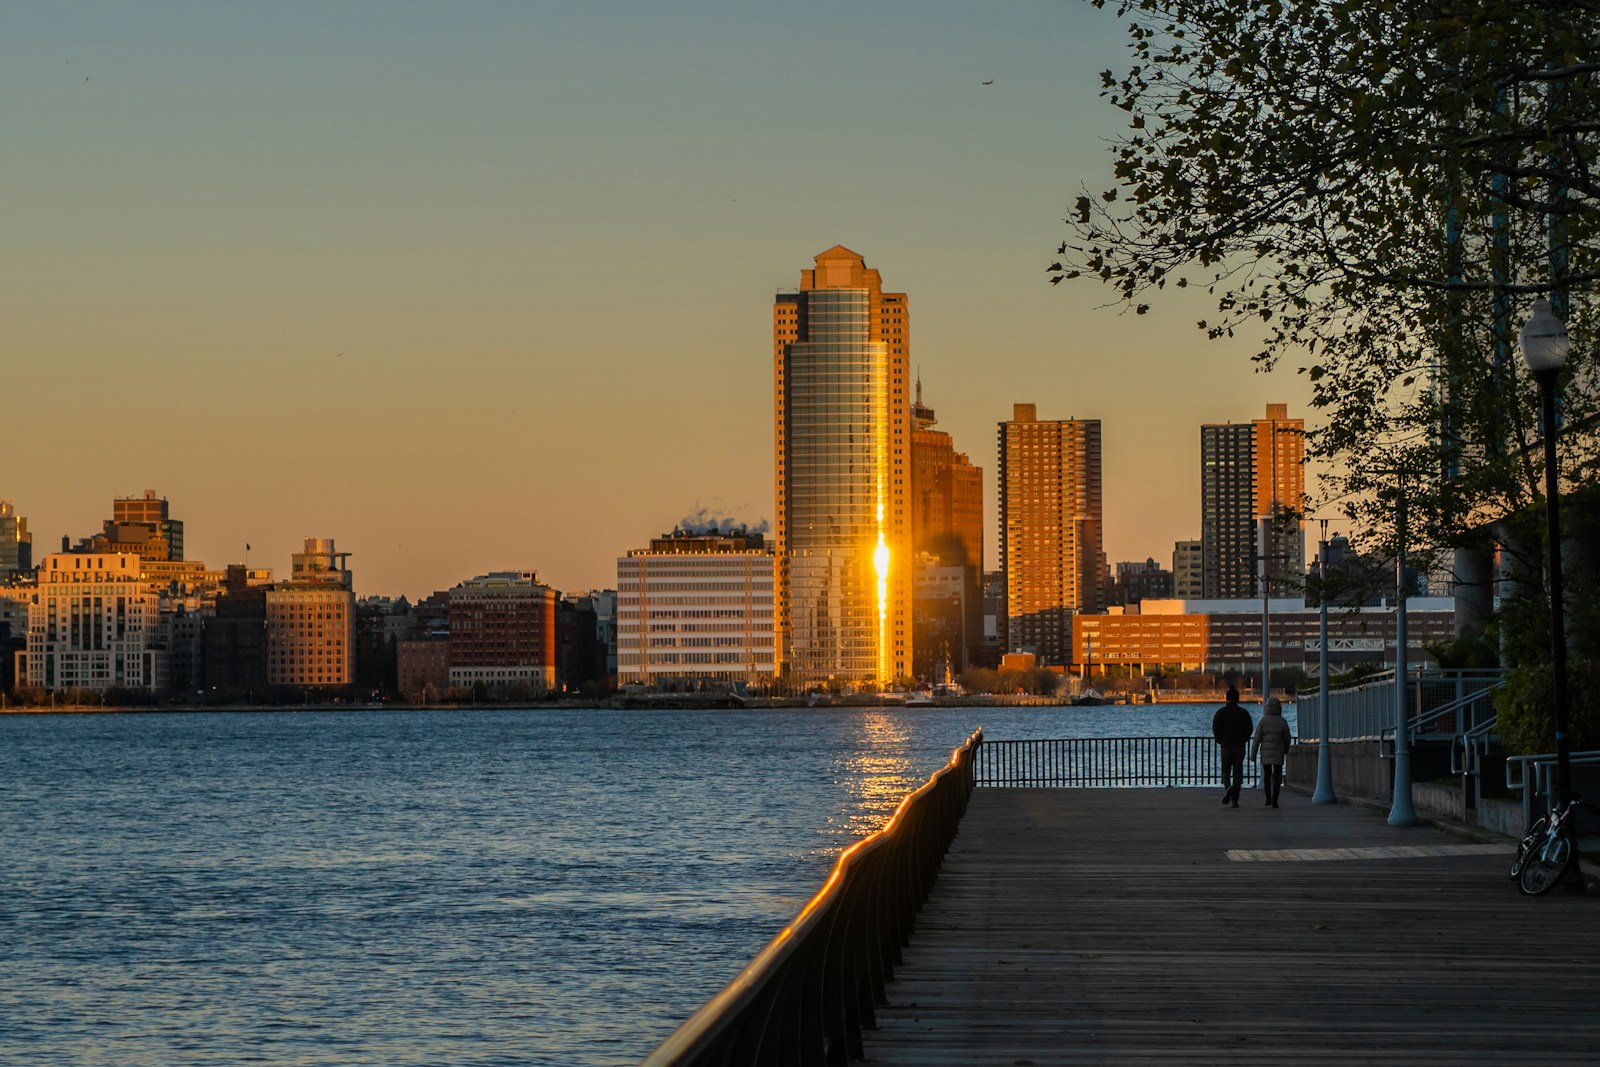
- Temperature effect of density increase of +500 people per square mile: +1.6°F
- Temperature difference between 10 hottest and coolest tracts: +5.0°F
- Average citywide summer land surface temperature: 97.7°F
- Total population: 287,899
7. Milwaukee, WI
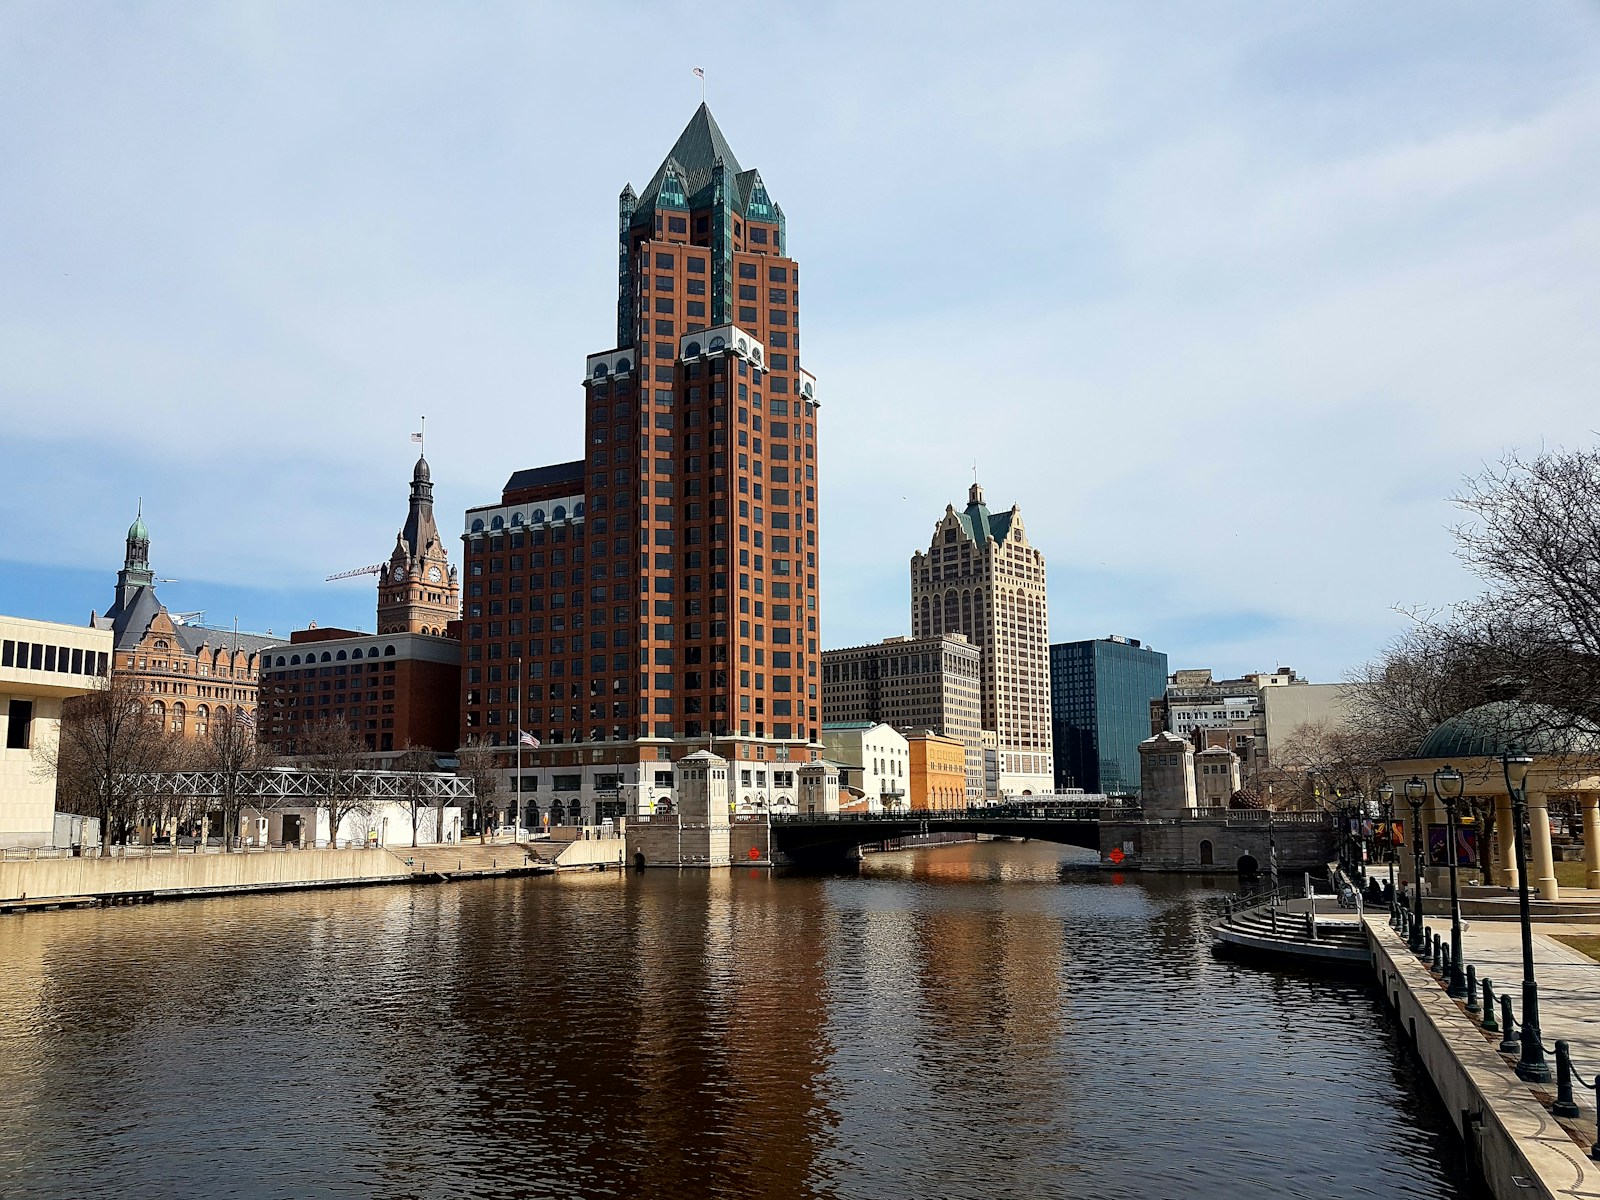
- Temperature effect of density increase of +500 people per square mile: +1.8°F
- Temperature difference between 10 hottest and coolest tracts: +14.5°F
- Average citywide summer land surface temperature: 93.1°F
- Total population: 573,299
6. Kansas City, MO
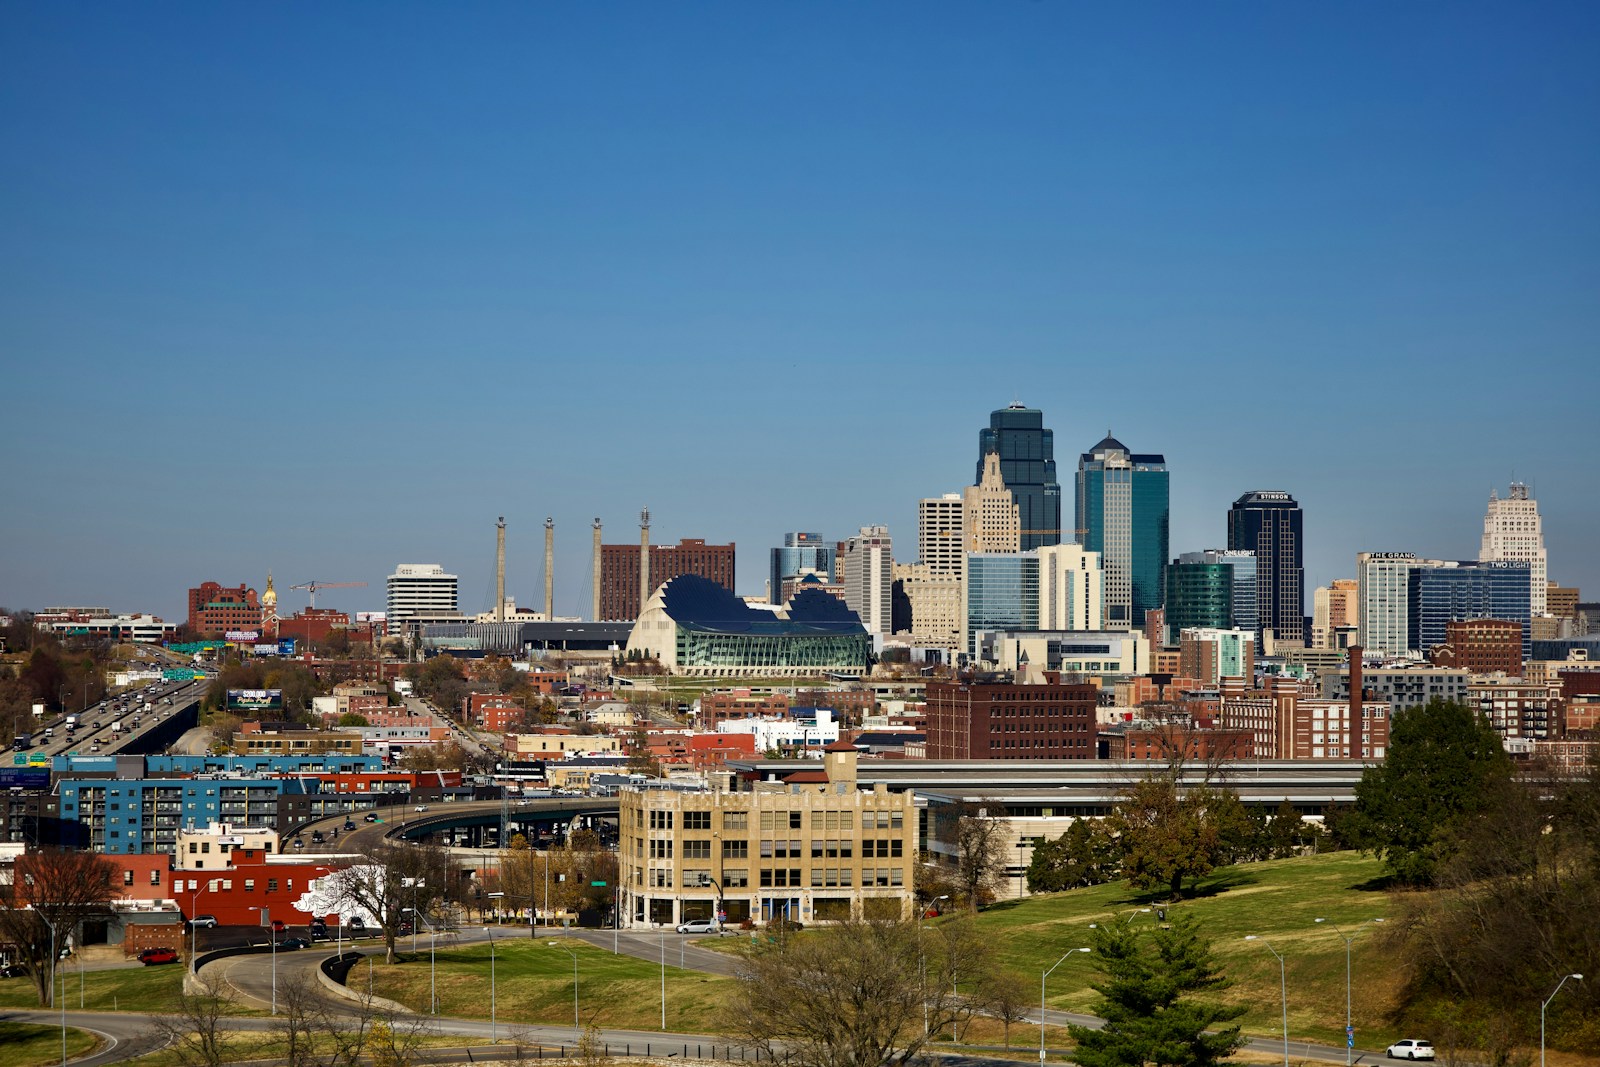
- Temperature effect of density increase of +500 people per square mile: +1.9°F
- Temperature difference between 10 hottest and coolest tracts: +14.9°F
- Average citywide summer land surface temperature: 93.6°F
- Total population: 505,958
5. Gilbert, AZ
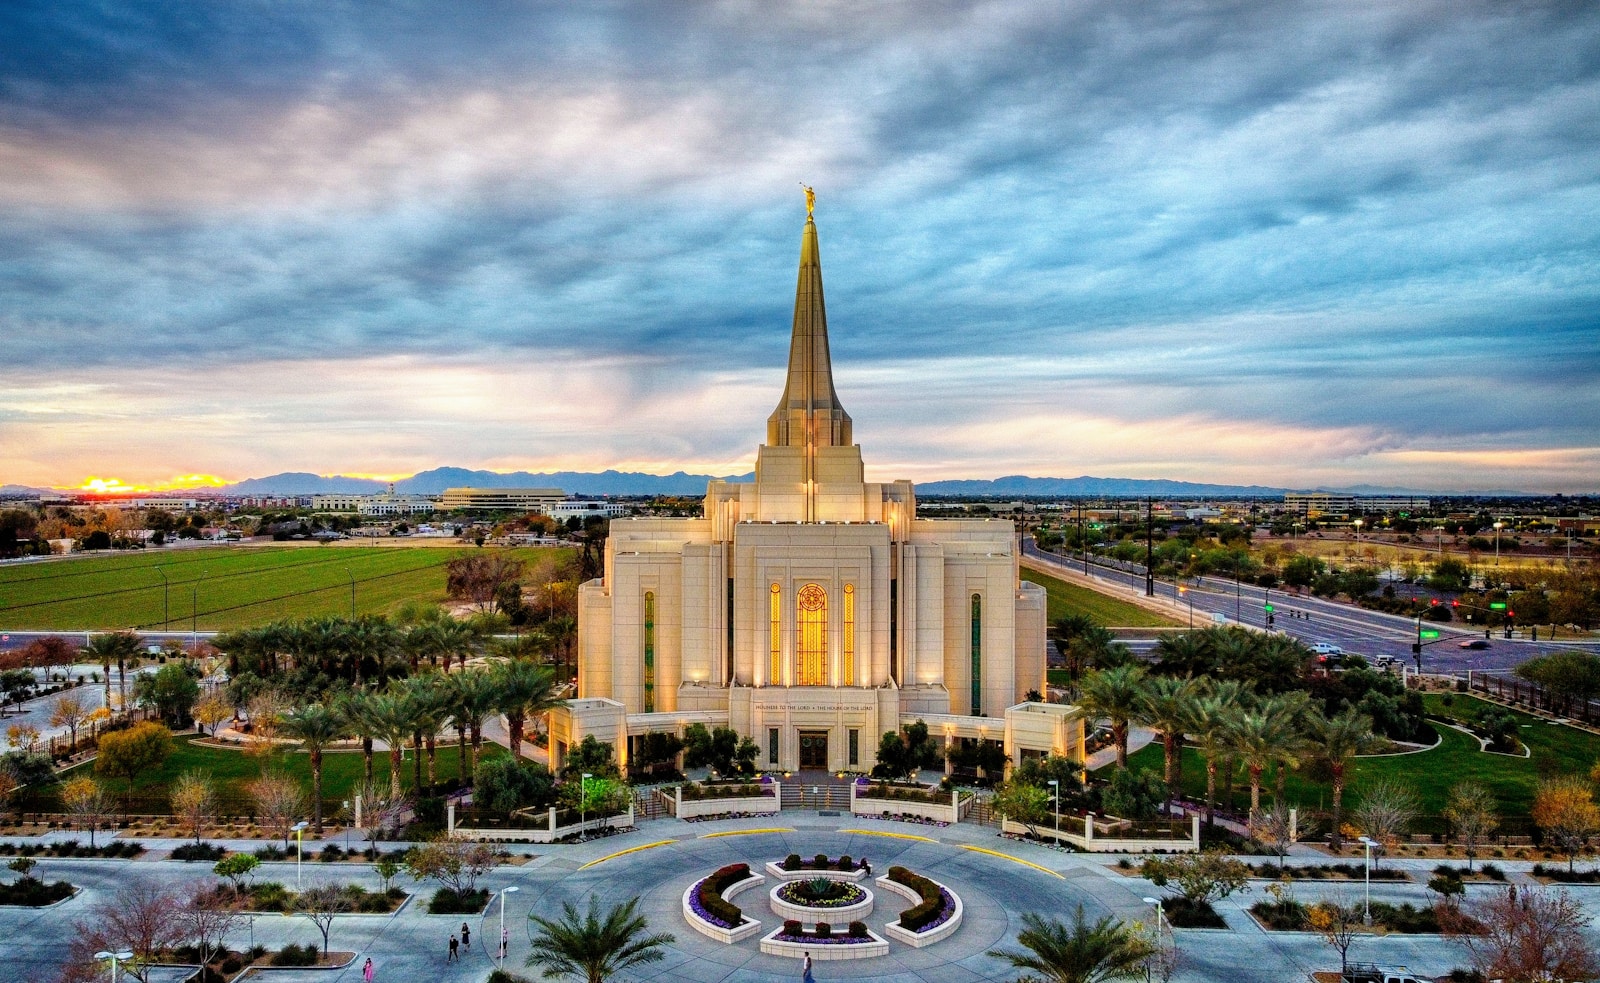
- Temperature effect of density increase of +500 people per square mile: +1.9°F
- Temperature difference between 10 hottest and coolest tracts: +5.0°F
- Average citywide summer land surface temperature: 123.1°F
- Total population: 267,267
4. Indianapolis, IN

- Temperature effect of density increase of +500 people per square mile: +2.0°F
- Temperature difference between 10 hottest and coolest tracts: +16.5°F
- Average citywide summer land surface temperature: 93.3°F
- Total population: 882,006
3. Madison, WI

- Temperature effect of density increase of +500 people per square mile: +2.1°F
- Temperature difference between 10 hottest and coolest tracts: +11.1°F
- Average citywide summer land surface temperature: 86.9°F
- Total population: 268,516
2. Denver, CO

- Temperature effect of density increase of +500 people per square mile: +2.3°F
- Temperature difference between 10 hottest and coolest tracts: +12.2°F
- Average citywide summer land surface temperature: 110.2°F
- Total population: 710,800
1. Seattle, WA
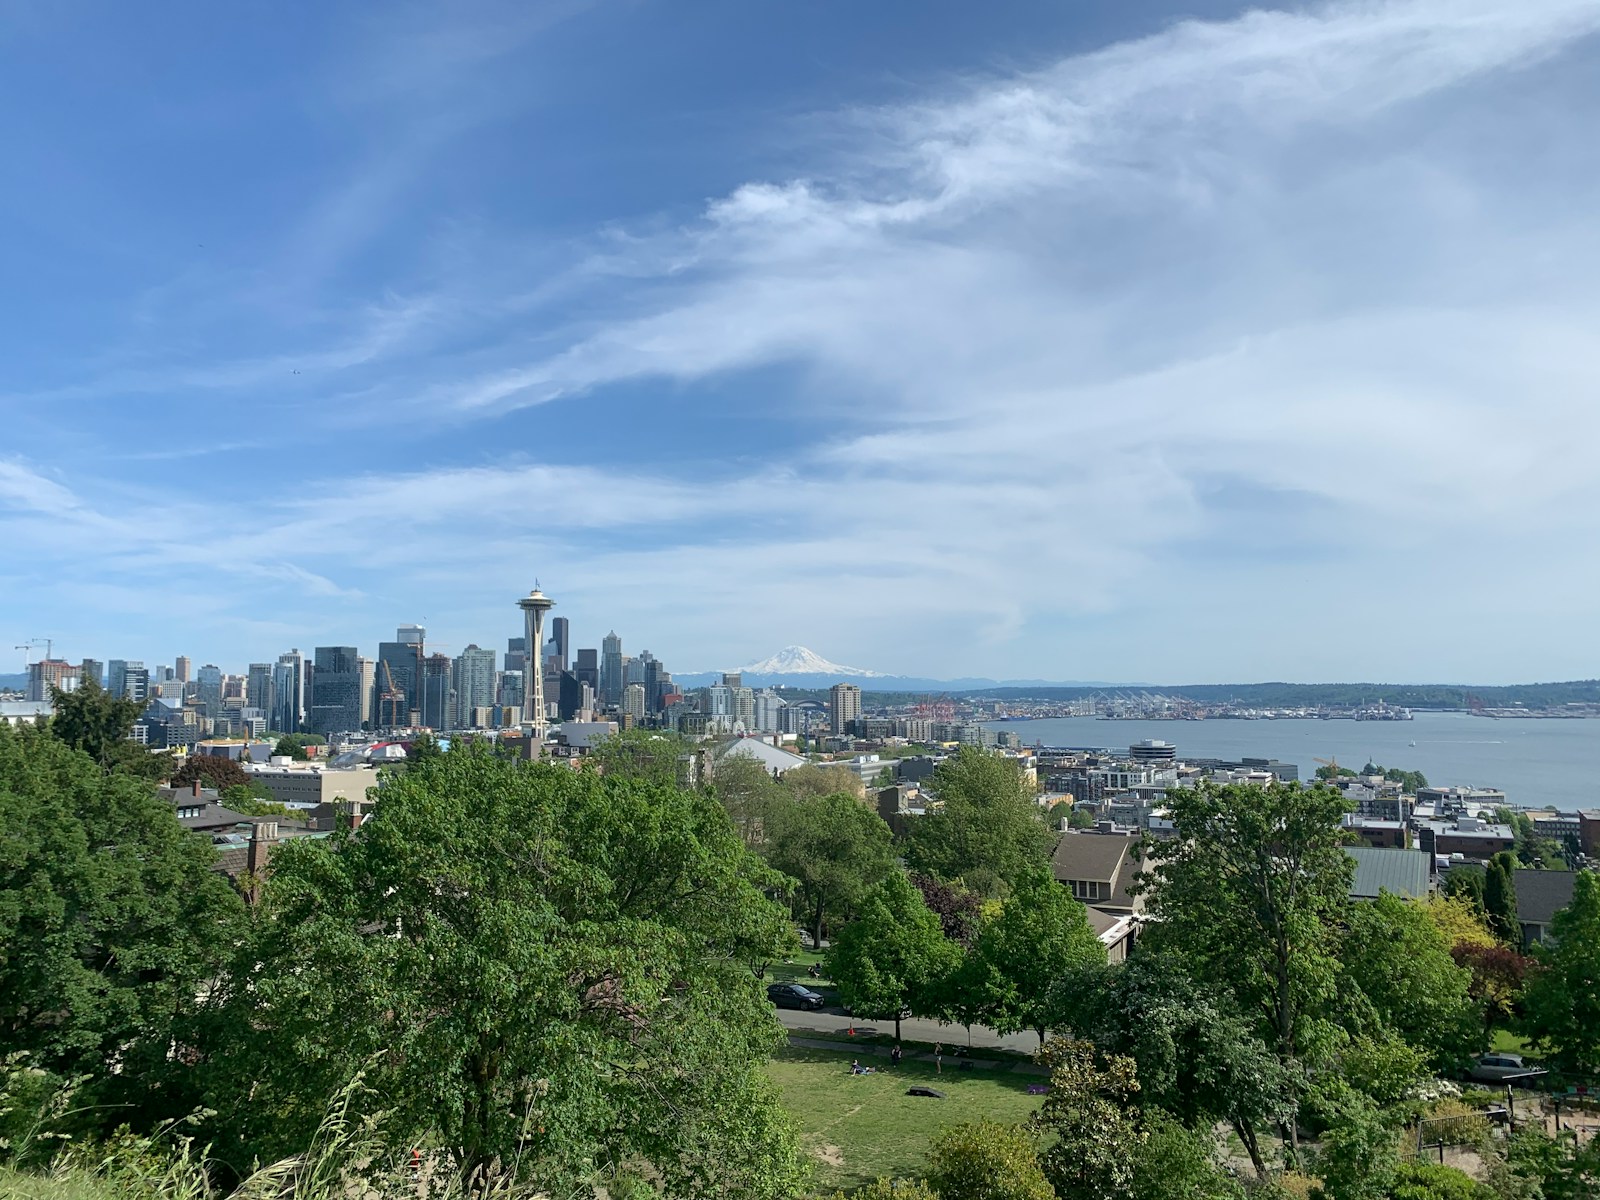
- Temperature effect of density increase of +500 people per square mile: +3.2°F
- Temperature difference between 10 hottest and coolest tracts: +15.3°F
- Average citywide summer land surface temperature: 91.2°F
- Total population: 734,603