Awful Outage Histories: These Are The U.S. Counties That Go Dark Most Often
 https://climate-crisis-247-bucket.nyc3.cdn.digitaloceanspaces.com/wp-content/uploads/2024/10/08003631/1871130-150x150.jpg
While the total costs of Hurricane Helene are still being tallied, the Category 4 storm brought widespread destruction to the Southeast last week, killing at least 160 people and leaving thousands stranded without power.
Worried about car theft? EVs Don’t Get Stolen
High electric bill? The 25 Cities That Pay The Most for Electricity
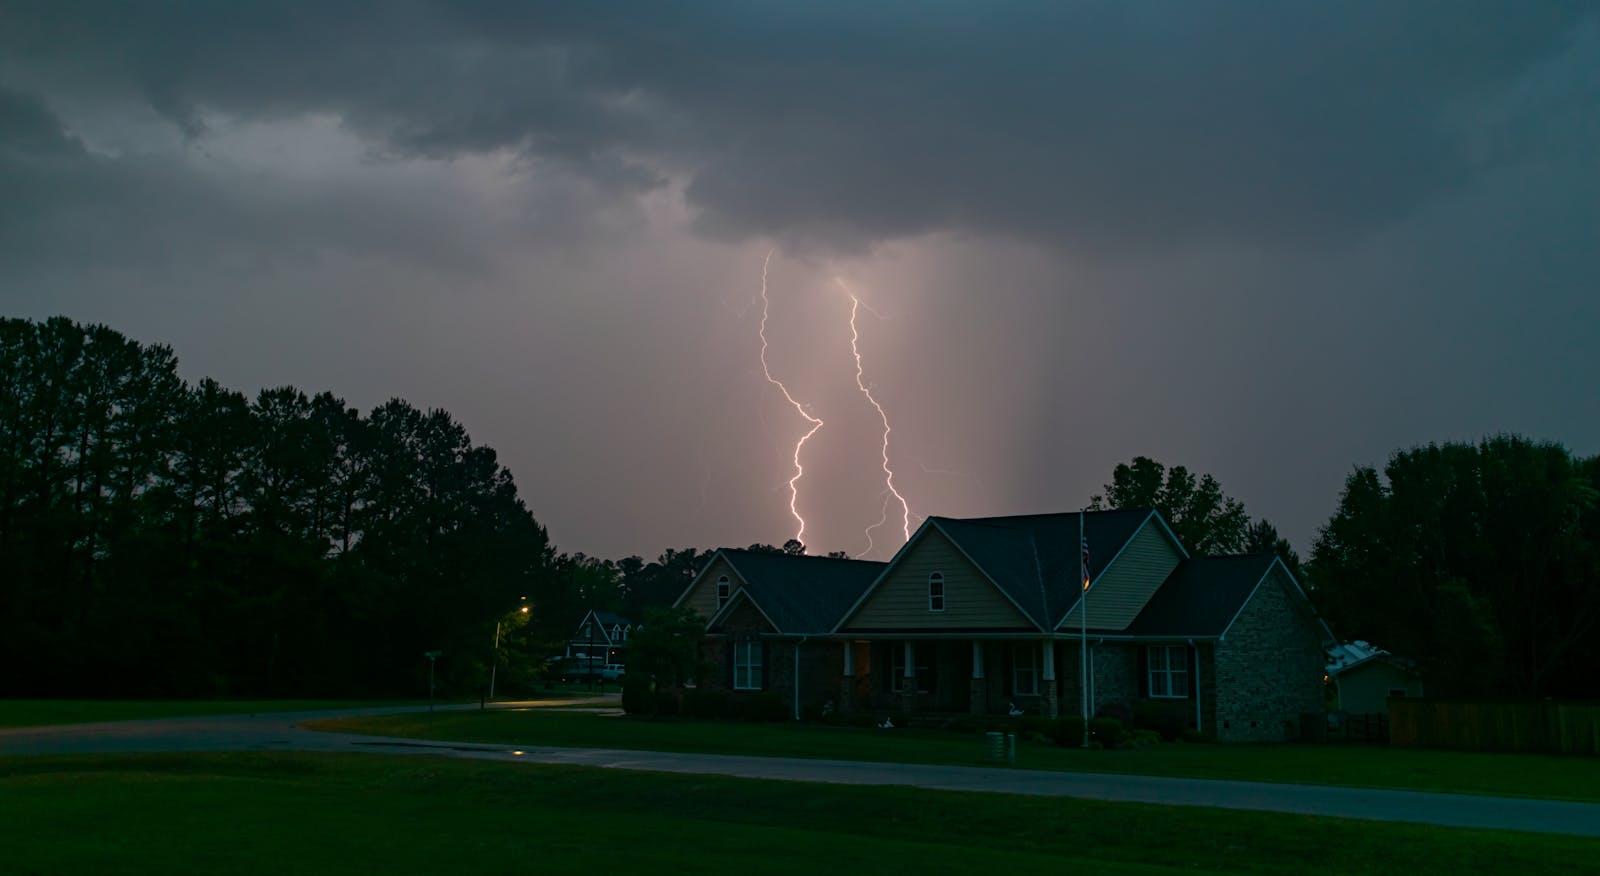
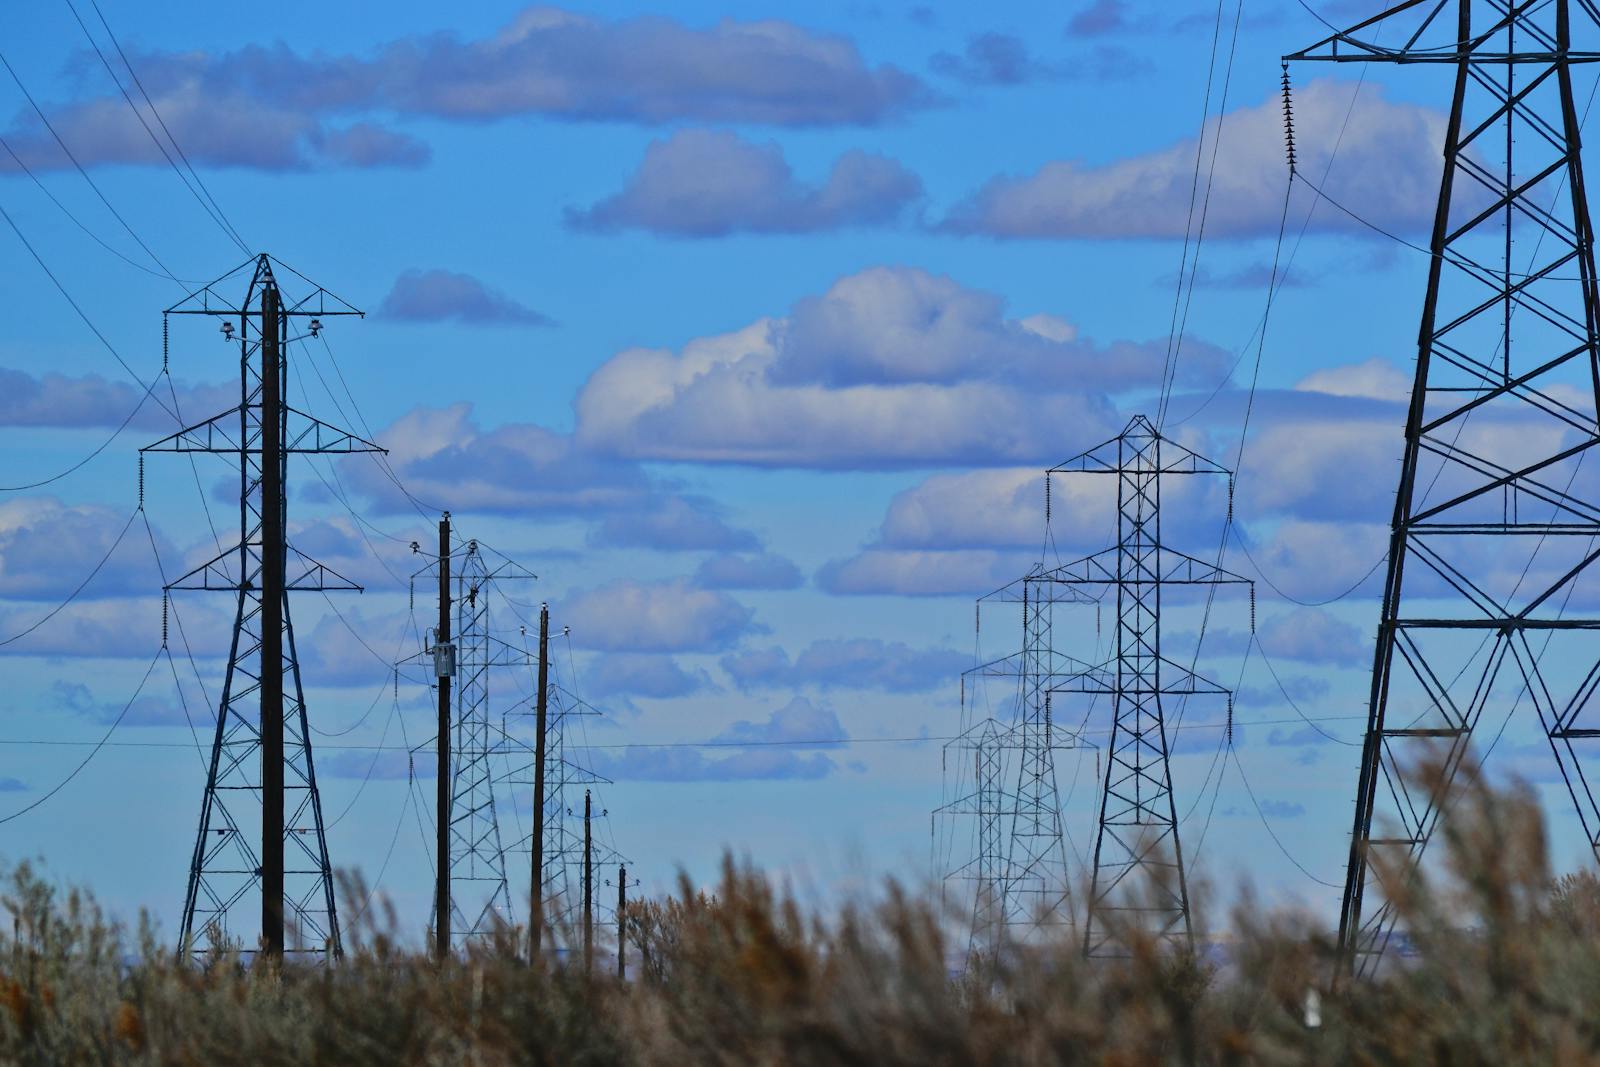
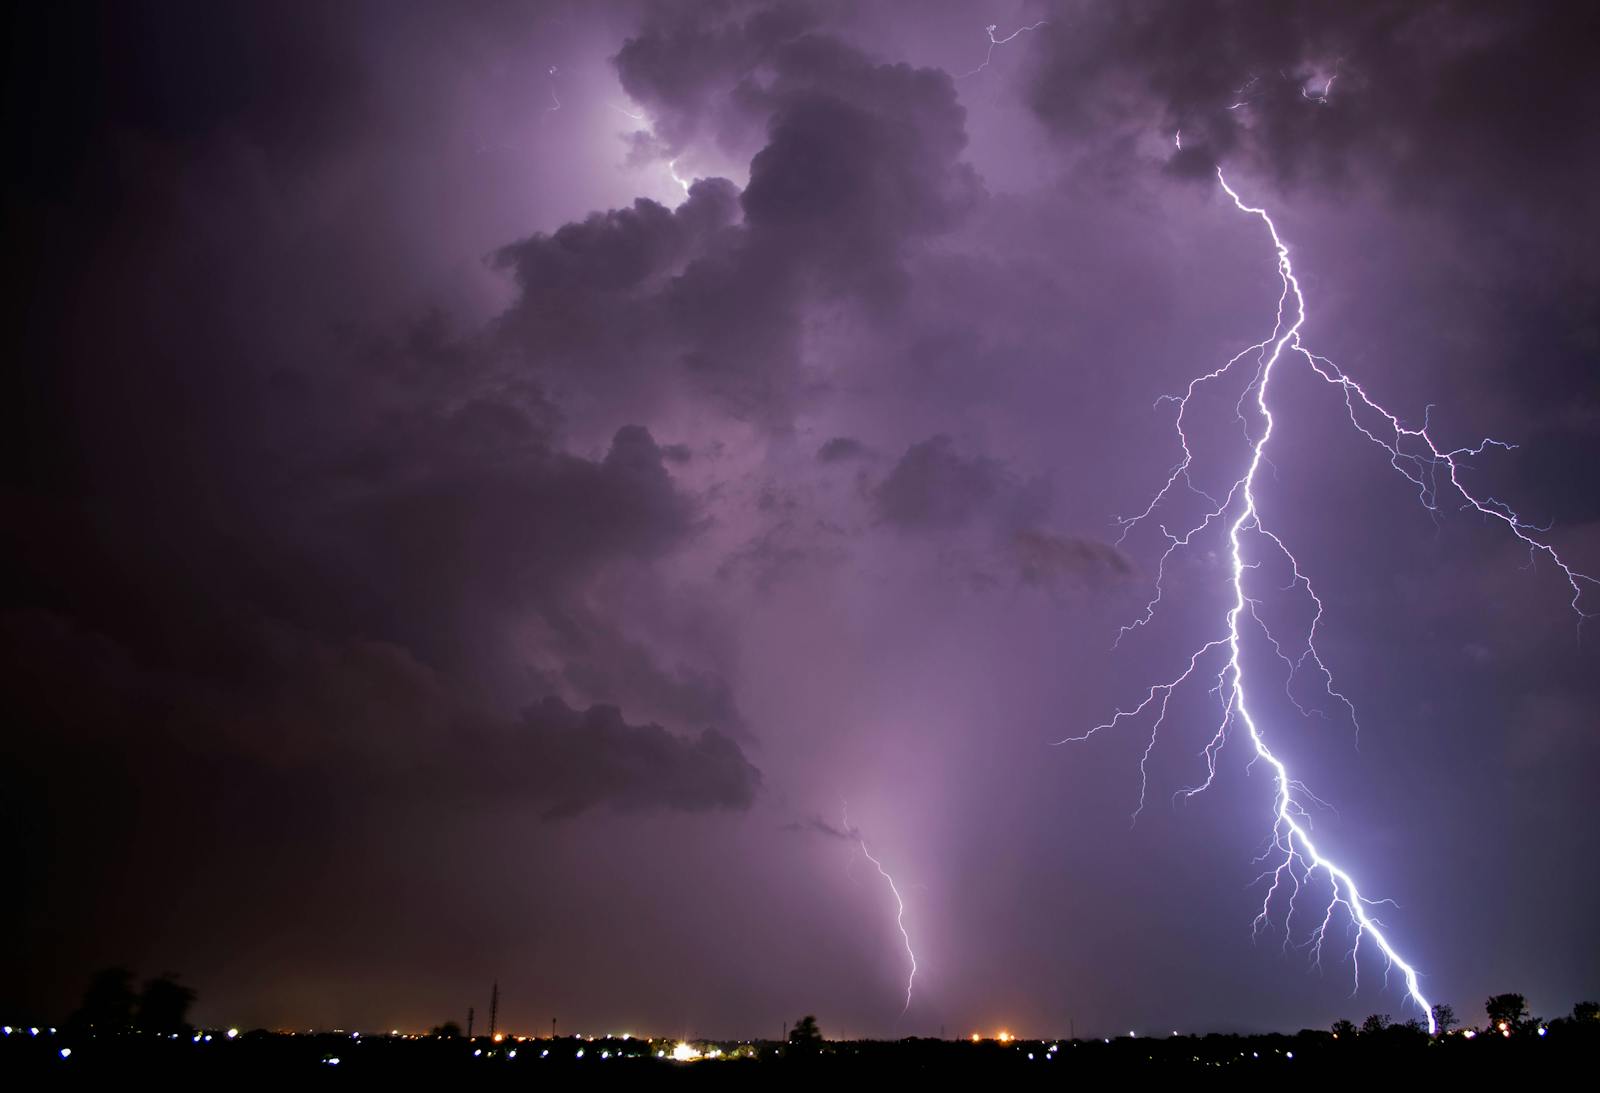
Severe weather is the leading cause of disruption to the U.S. power grid. Data from the Department of Energy shows that electricity disruptions due to severe weather increased sharply over the last decade, rising at an annual average rate of 11.9% from 2013 to 2023. And while electricity outages are difficult to track at the national level, researchers recently published a new, harmonized dataset of U.S. electricity outages at the county level. A detailed look at the data reveals a handful of counties throughout California, the Gulf Coast, and other regions that have historically dealt with power outage burdens dozens of times greater than the national average.
To determine the counties with the most power outages, Climate Crisis 247 reviewed data on power outages in 15-minute intervals from the Department of Energy’s Oak Ridge National Laboratory. Counties were ranked based on the number of average annual customer-hours of power outage per resident in the years 2021 to 2023. Supplemental data on historic hurricane loss ratings are from the FEMA National Risk Index and are based on hurricane damage from 1996 to 2019.
25. Alpine County, CA

- Average annual customer-hours of power outage: 40.4 per resident
- Average scale of power outage: 4.6% of population affected
- Historic hurricane loss rating: Not Applicable
- County seat: Markleeville
24. Marion County, TX
- Average annual customer-hours of power outage: 40.8 per resident
- Average scale of power outage: 2.7% of population affected
- Historic hurricane loss rating: Relatively Moderate
- County seat: Jefferson
23. Lincoln County, WV
- Average annual customer-hours of power outage: 41.6 per resident
- Average scale of power outage: 0.9% of population affected
- Historic hurricane loss rating: Relatively Low
- County seat: Hamlin
22. Wilkinson County, MS

- Average annual customer-hours of power outage: 45.0 per resident
- Average scale of power outage: 1.0% of population affected
- Historic hurricane loss rating: Relatively High
- County seat: Woodville
21. Irion County, TX
- Average annual customer-hours of power outage: 46.3 per resident
- Average scale of power outage: 1.1% of population affected
- Historic hurricane loss rating: Relatively Low
- County seat: Mertzon
20. Mariposa County, CA

- Average annual customer-hours of power outage: 47.0 per resident
- Average scale of power outage: 1.5% of population affected
- Historic hurricane loss rating: Not Applicable
- County seat: Mariposa
19. Tangipahoa Parish, LA
- Average annual customer-hours of power outage: 47.1 per resident
- Average scale of power outage: 0.7% of population affected
- Historic hurricane loss rating: Very High
- County seat: Amite City
18. Alcona County, MI
- Average annual customer-hours of power outage: 47.3 per resident
- Average scale of power outage: 2.8% of population affected
- Historic hurricane loss rating: Relatively Low
- County seat: Harrisville
17. Plaquemines Parish, LA

- Average annual customer-hours of power outage: 47.3 per resident
- Average scale of power outage: 1.2% of population affected
- Historic hurricane loss rating: Relatively High
- County seat: Pointe à la Hache
16. Claiborne County, MS

- Average annual customer-hours of power outage: 49.2 per resident
- Average scale of power outage: 1.1% of population affected
- Historic hurricane loss rating: Relatively Moderate
- County seat: Port Gibson
15. Wayne County, WV
- Average annual customer-hours of power outage: 49.4 per resident
- Average scale of power outage: 1.0% of population affected
- Historic hurricane loss rating: Relatively Low
- County seat: Wayne
14. Franklin, VA

- Average annual customer-hours of power outage: 51.2 per resident
- Average scale of power outage: 1.3% of population affected
- Historic hurricane loss rating: Relatively High
- County seat: Franklin
13. St. James Parish, LA

- Average annual customer-hours of power outage: 55.1 per resident
- Average scale of power outage: 1.9% of population affected
- Historic hurricane loss rating: Very High
- County seat: Convent
12. St. Charles Parish, LA

- Average annual customer-hours of power outage: 58.7 per resident
- Average scale of power outage: 1.6% of population affected
- Historic hurricane loss rating: Relatively High
- County seat: Hahnville
11. Austin County, TX

- Average annual customer-hours of power outage: 60.4 per resident
- Average scale of power outage: 0.8% of population affected
- Historic hurricane loss rating: Relatively High
- County seat: Bellville
10. Glasscock County, TX

- Average annual customer-hours of power outage: 62.5 per resident
- Average scale of power outage: 3.1% of population affected
- Historic hurricane loss rating: Relatively High
- County seat: Garden City
9. St. John the Baptist Parish, LA
- Average annual customer-hours of power outage: 62.8 per resident
- Average scale of power outage: 1.6% of population affected
- Historic hurricane loss rating: Relatively High
- County seat: Edgard
8. Wharton County, TX

- Average annual customer-hours of power outage: 67.1 per resident
- Average scale of power outage: 0.9% of population affected
- Historic hurricane loss rating: Very High
- County seat: Wharton
7. Plumas County, CA

- Average annual customer-hours of power outage: 68.8 per resident
- Average scale of power outage: 2.4% of population affected
- Historic hurricane loss rating: Not Applicable
- County seat: Quincy
6. Lafourche Parish, LA
- Average annual customer-hours of power outage: 70.1 per resident
- Average scale of power outage: 1.5% of population affected
- Historic hurricane loss rating: Very High
- County seat: Thibodaux
5. Edwards County, TX

- Average annual customer-hours of power outage: 91.0 per resident
- Average scale of power outage: 9.2% of population affected
- Historic hurricane loss rating: Very High
- County seat: Rocksprings
4. St. Helena Parish, LA
- Average annual customer-hours of power outage: 91.4 per resident
- Average scale of power outage: 3.9% of population affected
- Historic hurricane loss rating: Relatively High
- County seat: Greensburg
3. Sierra County, CA
- Average annual customer-hours of power outage: 105.9 per resident
- Average scale of power outage: 7.1% of population affected
- Historic hurricane loss rating: Not Applicable
- County seat: Downieville
2. Kenedy County, TX
- Average annual customer-hours of power outage: 124.9 per resident
- Average scale of power outage: 18.9% of population affected
- Historic hurricane loss rating: Very High
- County seat: Sarita
1. Loving County, TX
- Average annual customer-hours of power outage: 125.5 per resident
- Average scale of power outage: 12.9% of population affected
- Historic hurricane loss rating: Relatively Moderate
- County seat: Mentone