Cities With The Worst Air Quality Right Now
 https://climatecrisis247.com/wp-content/uploads/2025/08/Surface-air-particulate-matter-concentration-August-8-2025-150x150.png
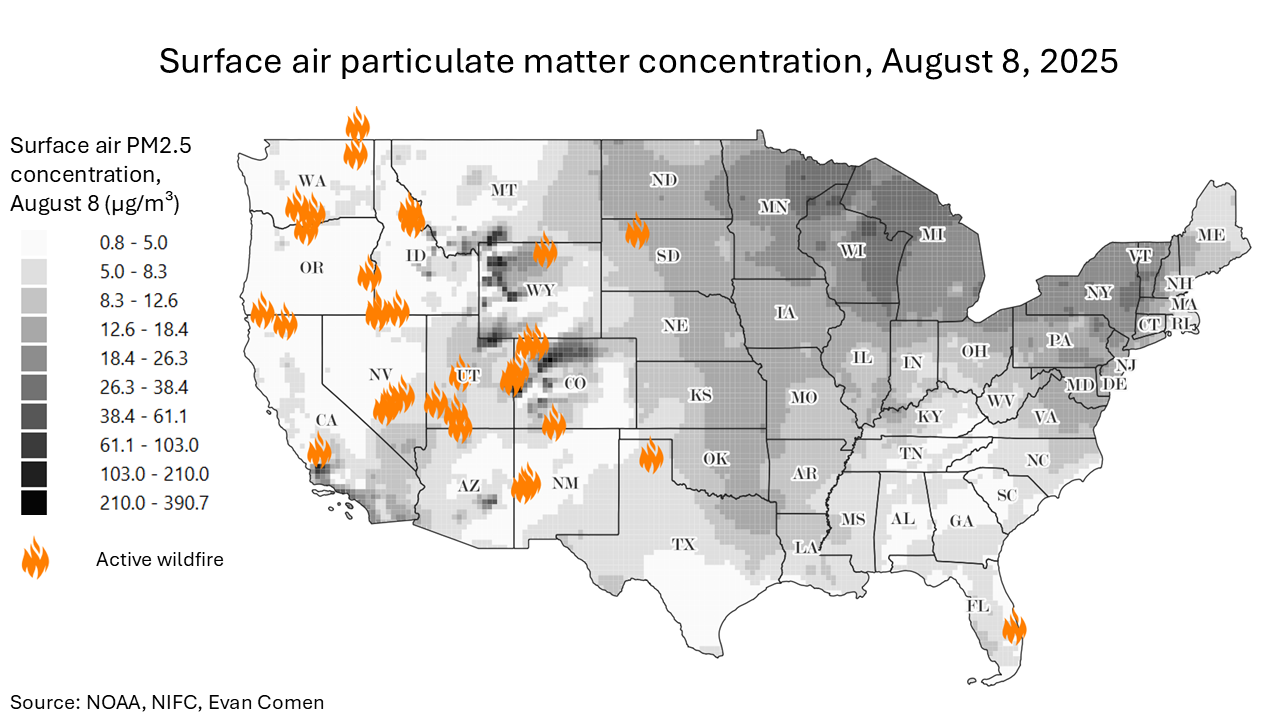
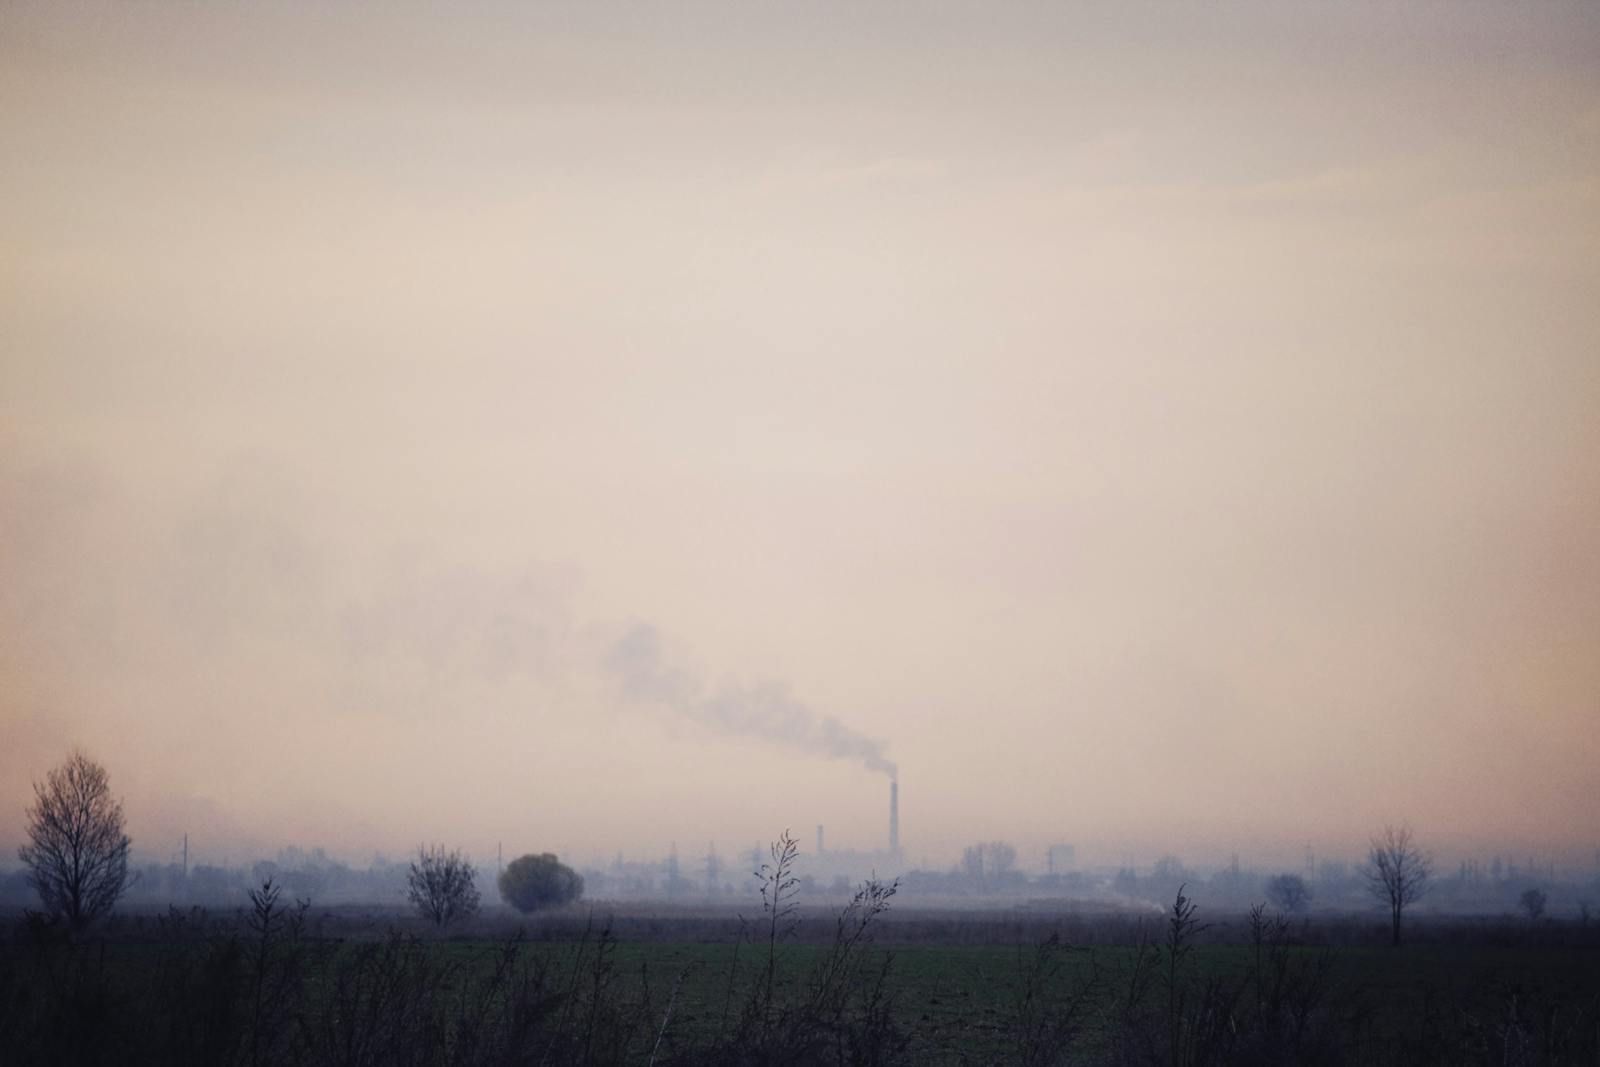
This week, the Dragon Bravo fire in Grand Canyon National Park grew to more than 126,000 acres, becoming the largest wildfire of 2025. While Dragon Bravo is by fire the largest wildfire in the country right now, it is only a dozen major wildfires right now that are collectively burning more than 840,000 acres and causing dangerous degradations in air quality.
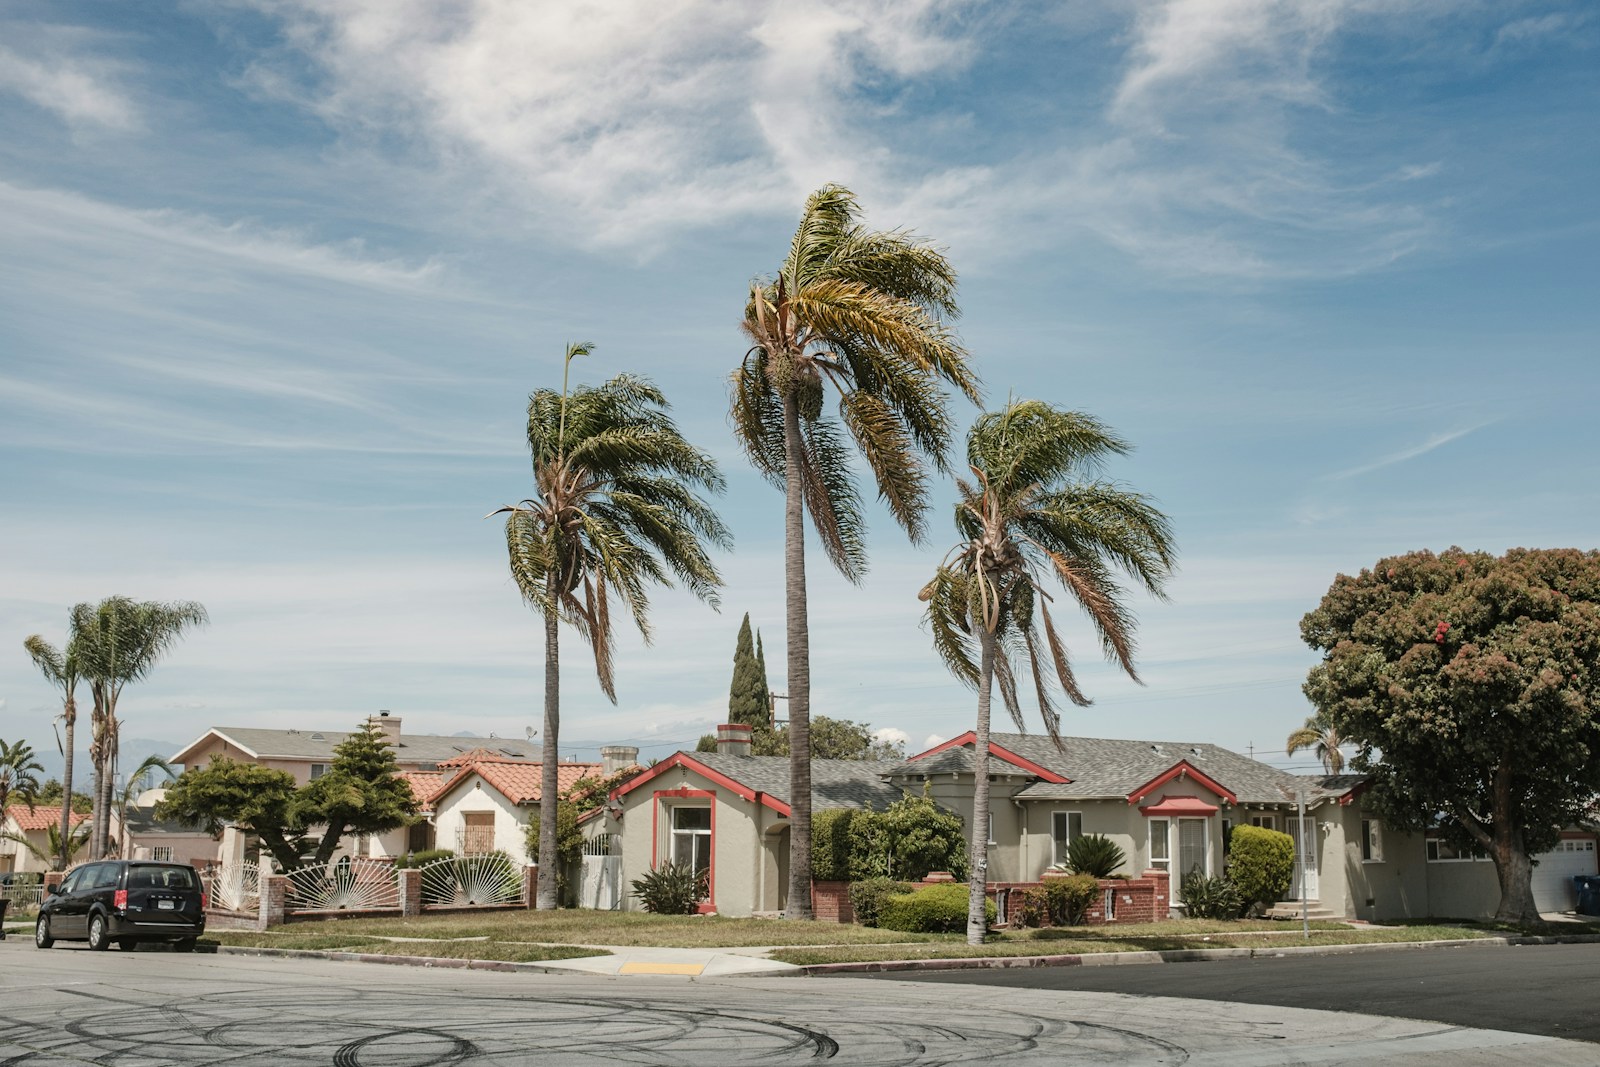
Hot property? From Maui to Malibu, These Affluent Enclaves Are Becoming Wildfire Hotspots
Hold on to your hats! The U.S. Counties Getting Windier Every Year
Particulate matter concentrations are spiking in cities downwind from the fires, with air pollution levels more than double the EPA threshold – 35 micrograms of PM2.5 per cubic meter of air in a 24-hour period – for unhealthy air in several major metro areas. The National Weather Service has issued air quality alerts in 102 counties, representing 51.6 million Americans. A closer look at the data reveals the cities with the worst air quality right now.
To determine the cities where air quality is the worst right now, Climate Crisis 247 reviewed data on particulate matter forecasts from the EPA’s AirNow platform. Cities were ranked based on the forecast concentration of 24-hour PM2.5 pollution for August 8, 2025. Only cities with at least 50,000 residents were considered. Supplemental data on forecast temperature maximums are from NOAA.
25. West Allis, WI
- Surface air particulate matter concentration, August 8, 2025: 32.4 µg/m³
- Forecast high, August 8, 2025: 88.7°F
- Population: 59,907
24. Waukesha, WI
- Surface air particulate matter concentration, August 8, 2025: 32.8 µg/m³
- Forecast high, August 8, 2025: 85.9°F
- Population: 70,945
23. Long Beach, CA

- Surface air particulate matter concentration, August 8, 2025: 33.2 µg/m³
- Forecast high, August 8, 2025: 84.2°F
- Population: 462,293
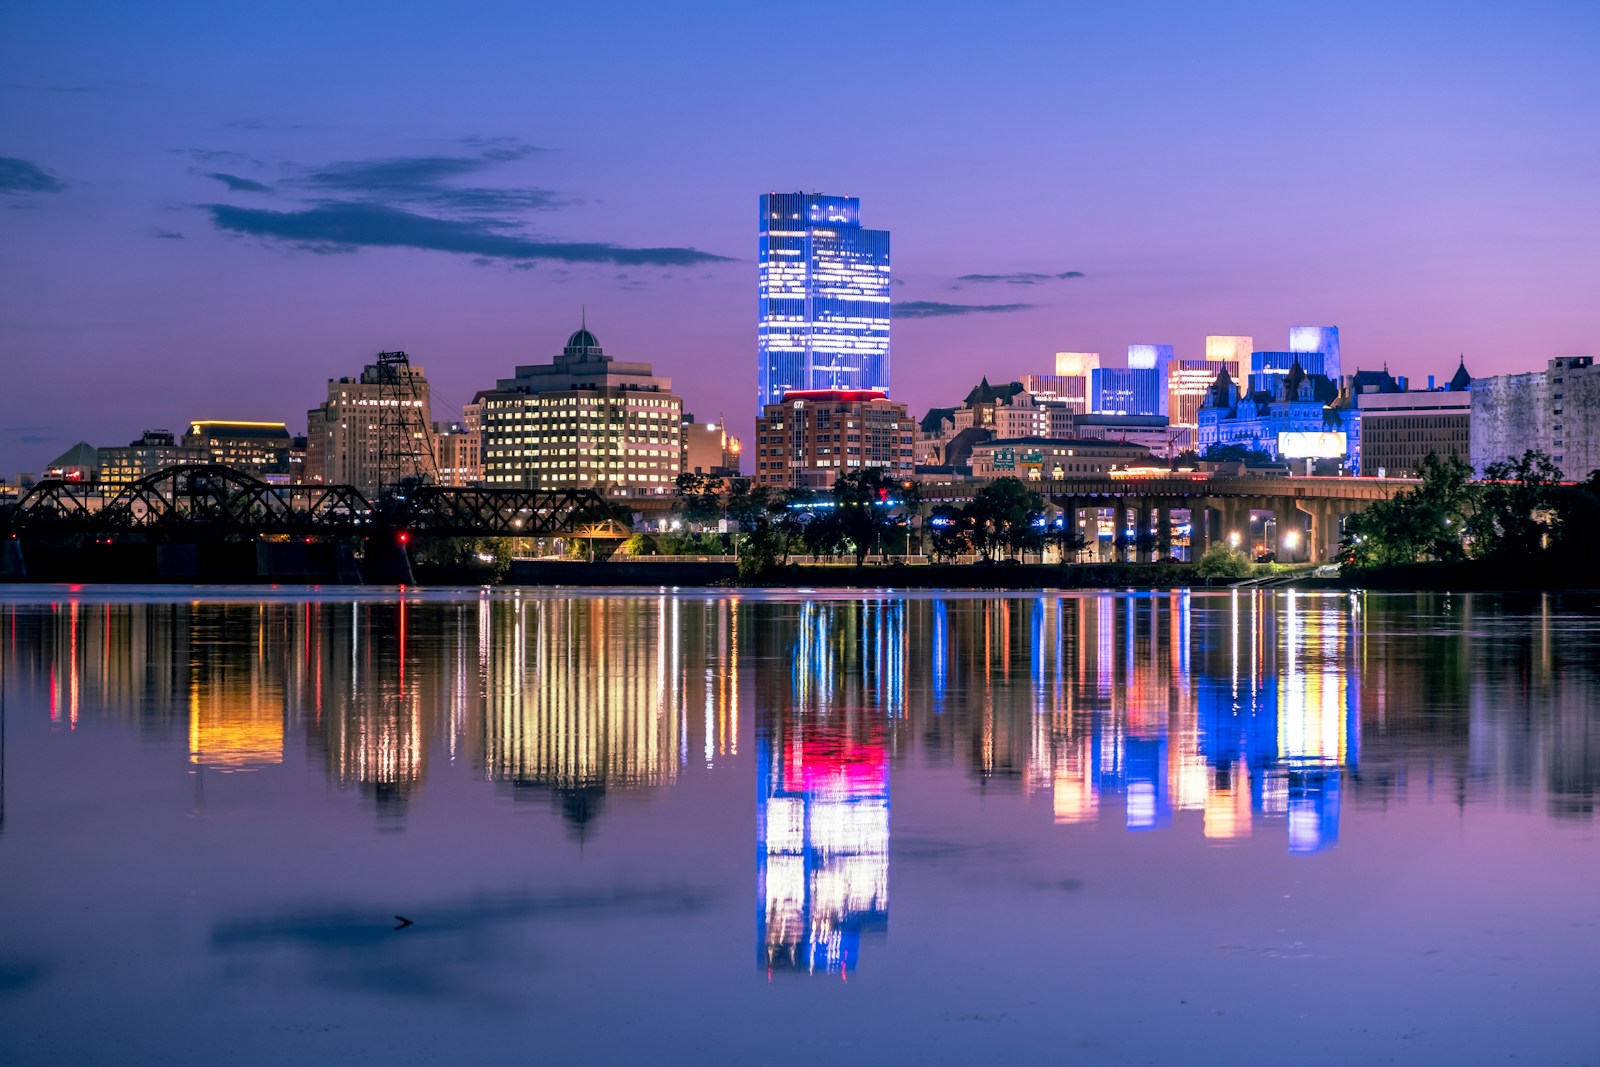
22. Schenectady, NY

- Surface air particulate matter concentration, August 8, 2025: 33.3 µg/m³
- Forecast high, August 8, 2025: 81.4°F
- Population: 68,476
21. Fountain Valley, CA
- Surface air particulate matter concentration, August 8, 2025: 33.6 µg/m³
- Forecast high, August 8, 2025: 85.0°F
- Population: 56,754
20. Troy, NY
- Surface air particulate matter concentration, August 8, 2025: 34.2 µg/m³
- Forecast high, August 8, 2025: 82.2°F
- Population: 51,268
19. Appleton, WI

- Surface air particulate matter concentration, August 8, 2025: 34.2 µg/m³
- Forecast high, August 8, 2025: 83.9°F
- Population: 75,133
18. Carson, CA
- Surface air particulate matter concentration, August 8, 2025: 34.3 µg/m³
- Forecast high, August 8, 2025: 87.0°F
- Population: 94,475
17. Costa Mesa, CA

- Surface air particulate matter concentration, August 8, 2025: 35.3 µg/m³
- Forecast high, August 8, 2025: 83.0°F
- Population: 111,490
16. Greeley, CO
- Surface air particulate matter concentration, August 8, 2025: 35.9 µg/m³
- Forecast high, August 8, 2025: 101.1°F
- Population: 107,949
15. Albany, NY
- Surface air particulate matter concentration, August 8, 2025: 36.2 µg/m³
- Forecast high, August 8, 2025: 81.9°F
- Population: 99,692
14. Huntington Beach, CA
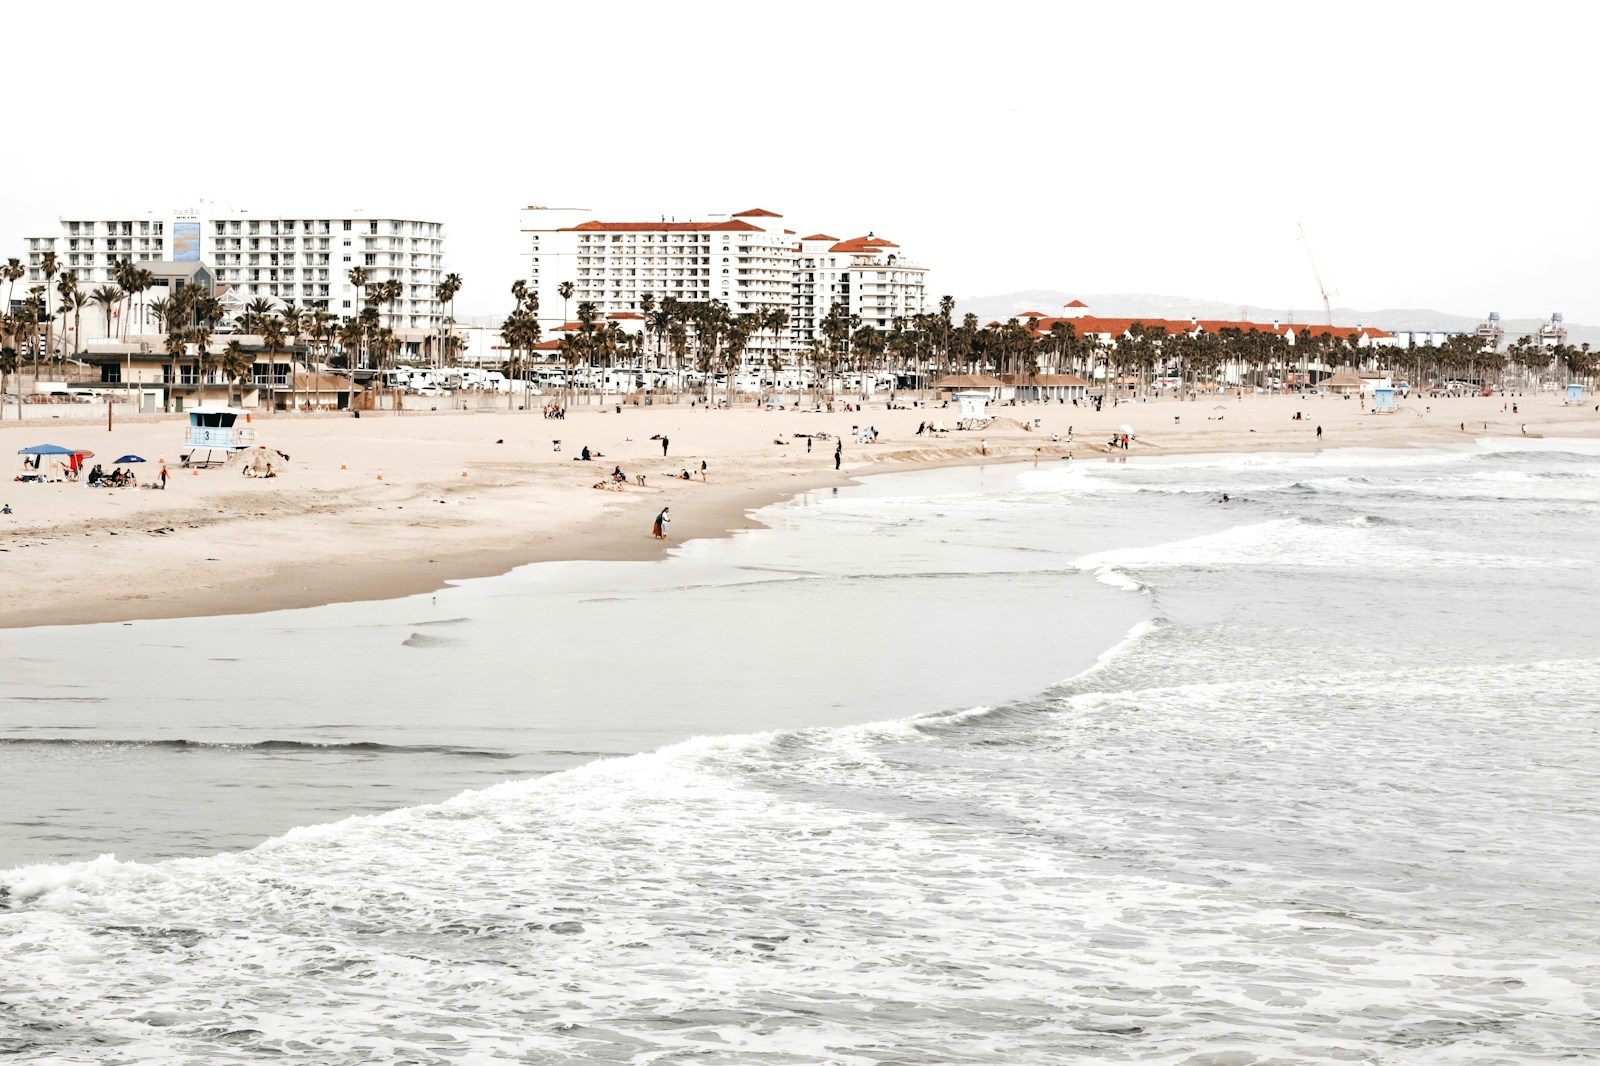
- Surface air particulate matter concentration, August 8, 2025: 36.9 µg/m³
- Forecast high, August 8, 2025: 79.2°F
- Population: 197,481
13. Newport Beach, CA

- Surface air particulate matter concentration, August 8, 2025: 37.2 µg/m³
- Forecast high, August 8, 2025: 76.0°F
- Population: 85,159
12. Green Bay, WI

- Surface air particulate matter concentration, August 8, 2025: 37.5 µg/m³
- Forecast high, August 8, 2025: 83.9°F
- Population: 106,846
11. Gardena, CA

- Surface air particulate matter concentration, August 8, 2025: 39.1 µg/m³
- Forecast high, August 8, 2025: 84.7°F
- Population: 60,377
10. Santa Maria, CA

- Surface air particulate matter concentration, August 8, 2025: 39.7 µg/m³
- Forecast high, August 8, 2025: 72.0°F
- Population: 109,543
9. Inglewood, CA
- Surface air particulate matter concentration, August 8, 2025: 41.5 µg/m³
- Forecast high, August 8, 2025: 82.7°F
- Population: 106,806
8. Fort Collins, CO
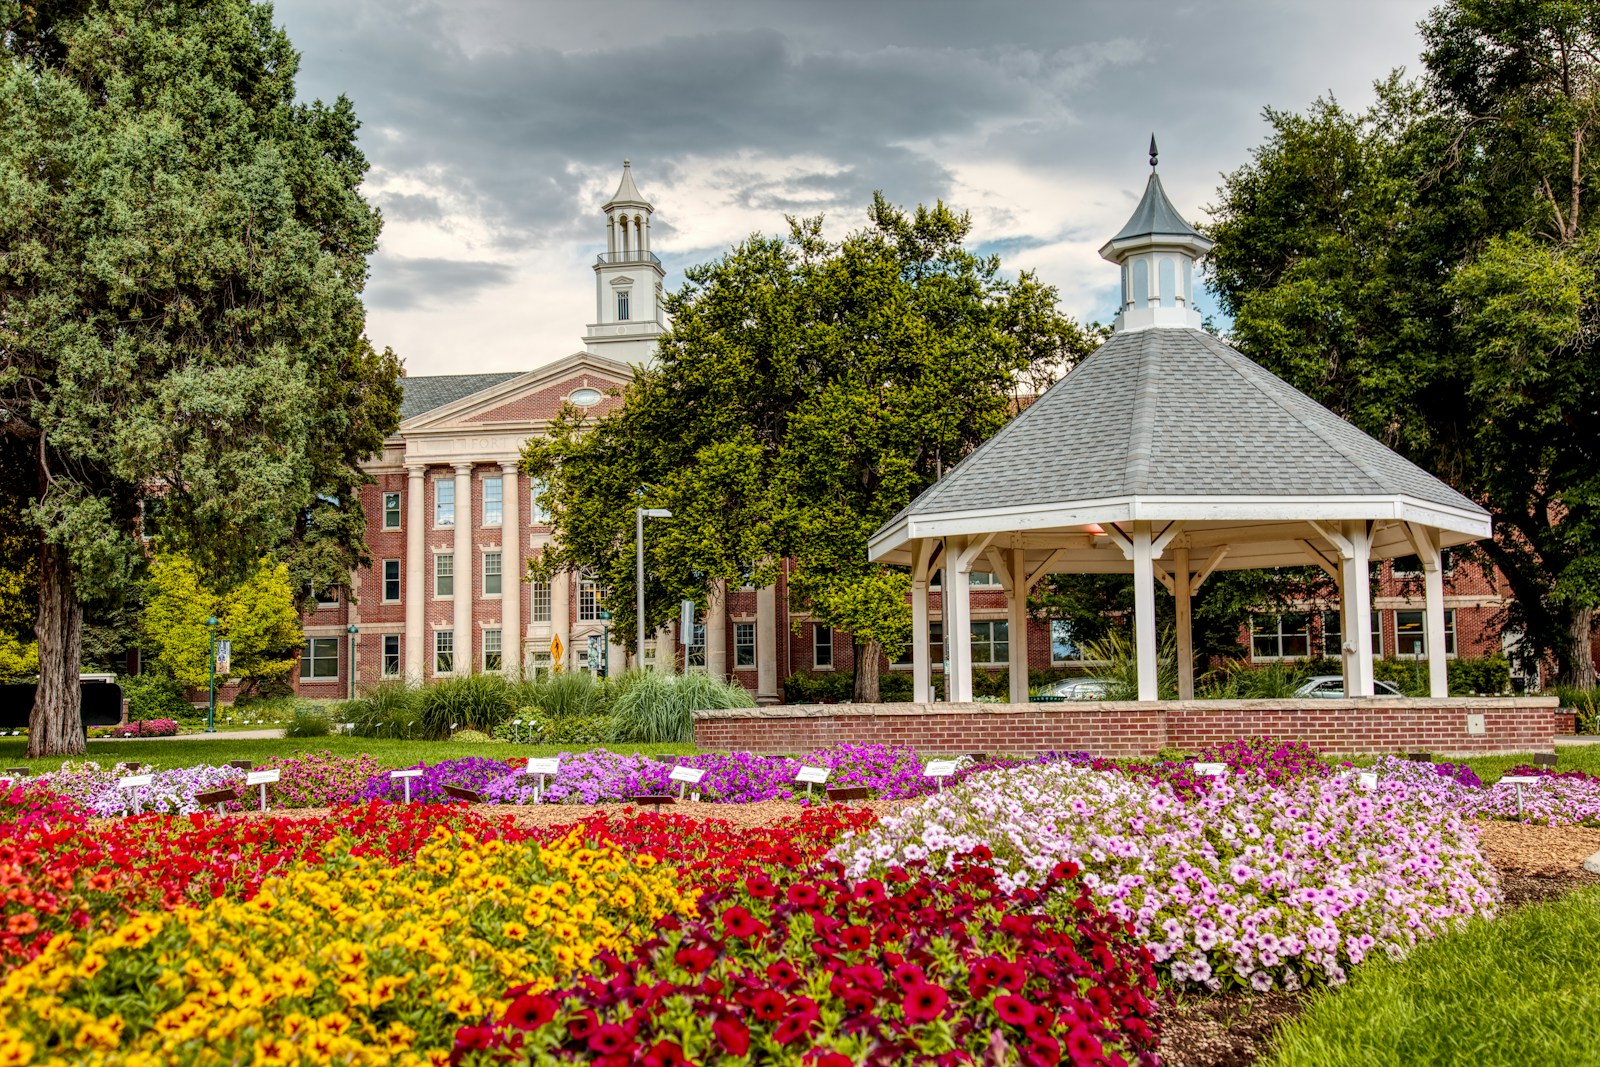
- Surface air particulate matter concentration, August 8, 2025: 41.5 µg/m³
- Forecast high, August 8, 2025: 100.2°F
- Population: 168,758
7. Duluth, MN
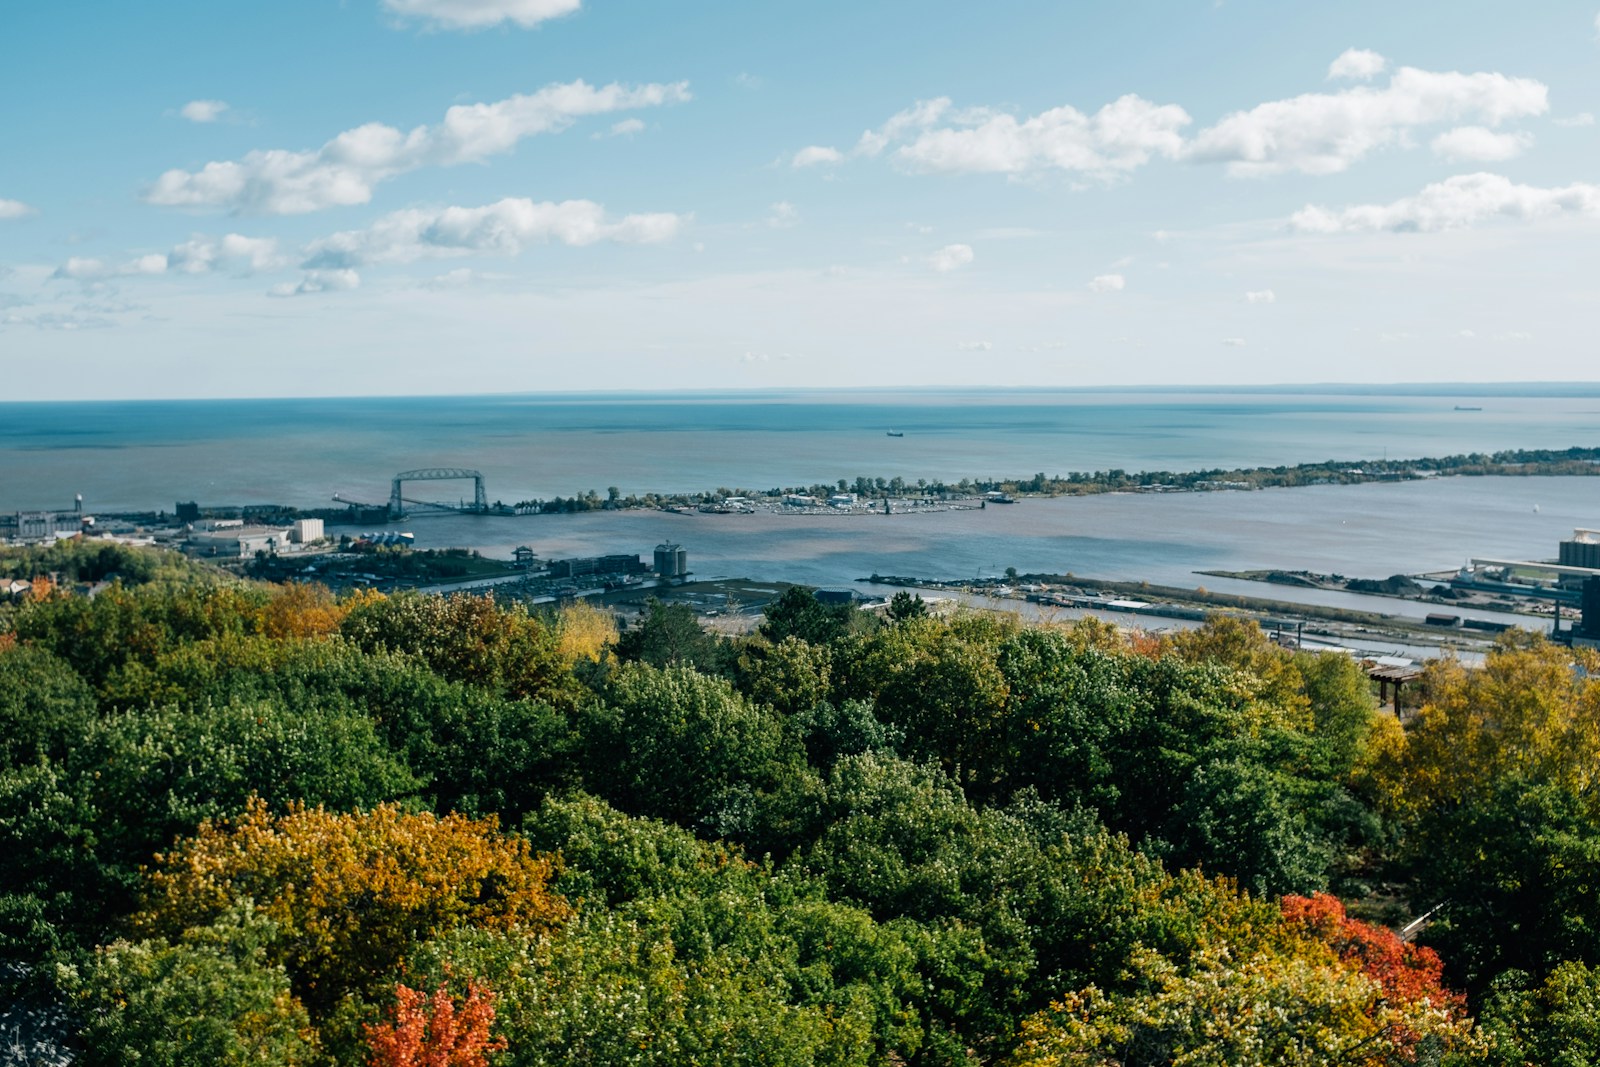
- Surface air particulate matter concentration, August 8, 2025: 42.0 µg/m³
- Forecast high, August 8, 2025: 84.0°F
- Population: 86,772
6. Hawthorne, CA
- Surface air particulate matter concentration, August 8, 2025: 44.2 µg/m³
- Forecast high, August 8, 2025: 81.9°F
- Population: 86,978
5. Loveland, CO
- Surface air particulate matter concentration, August 8, 2025: 47.0 µg/m³
- Forecast high, August 8, 2025: 100.9°F
- Population: 76,500
4. Torrance, CA
- Surface air particulate matter concentration, August 8, 2025: 49.3 µg/m³
- Forecast high, August 8, 2025: 80.9°F
- Population: 145,454
3. Santa Monica, CA

- Surface air particulate matter concentration, August 8, 2025: 53.0 µg/m³
- Forecast high, August 8, 2025: 76.0°F
- Population: 92,168
2. Redondo Beach, CA
- Surface air particulate matter concentration, August 8, 2025: 55.2 µg/m³
- Forecast high, August 8, 2025: 75.8°F
- Population: 70,620
1. Grand Junction, CO
- Surface air particulate matter concentration, August 8, 2025: 104.8 µg/m³
- Forecast high, August 8, 2025: 100.2°F
- Population: 65,918
More from ClimateCrisis 247
- Where Heat Risk Will Be Worst This Weekend
- Trump Dismantled Biden’s Climate Agenda, But Americans in These Cities Are Likely to Take Exception
- Miami Is One of Several Climate Risk Hotspots With Collapsing Housing Markets
- These National Parks Are On Fire Right Now