Due to Deregulation, Trump Is Putting The Health Of Americans At Most Risk In These Counties
 https://climatecrisis247.com/wp-content/uploads/2025/03/9889054-150x150.jpeg
Earlier this month, the Trump administration announced it would repeal dozens of the nation’s most important environmental regulations. In the historic rollback, the EPA unveiled a list of 31 regulations it will scale back or eliminate, including clean water protections for certain waterways and wetlands, fuel efficiency and emissions standards for vehicles, and limitations on emissions from power plants.
DOGE reforms? Climate Programs That May Get Gutted By the Trump Administration
Change in scenery? These Cities Have the Most Diverse Climates
One of the most significant actions announced by the EPA is a reconsideration of regulations on power plants, specifically the suite of rules called the Greenhouse Gas Standards and Guidelines for Fossil Fuel-Fired Power Plants enacted by the Biden administration in 2024. While the existing framework forces power plants to achieve a 90% reduction in carbon emissions by 2032, which federal officials forecast to prevent 1,500 to 3,600 premature deaths annually by 2030, easing of the Biden-era rules could put millions of Americans at risk. A look at where the nation’s dirtiest power plants are highlights the communities most at risk from the EPA regulations rollback.
To determine where the Trump rollback is putting the most people at risk, Climate Crisis 247 reviewed data on power plant emissions from the EPA. Power plants were ranked based on total annual carbon dioxide emissions. Supplemental data on annual particulate matter emissions, nitrogen oxides emissions, and downstream population impacted by each power plant are also from the EPA. Estimates for the downstream population impacted by each power plant’s emissions are based on the EPA’s Power Plants and Neighboring Communities Mapping Tool.
10. Sweetwater County, WY (Jim Bridger Power Plant)

- Annual CO2 emissions: 12.2 million tons
- Annual PM2.5 emissions: 726 tons
- Annual nitrogen oxides emissions: 6,552 tons
- Total downstream population impacted by power plant: 6.2 million
9. Gallia County, OH (General James M. Gavin Power Plant)

- Annual CO2 emissions: 12.3 million tons
- Annual PM2.5 emissions: 624 tons
- Annual nitrogen oxides emissions: 5,571 tons
- Total downstream population impacted by power plant: 69.1 million
8. Platte County, WY (Laramie River Station)
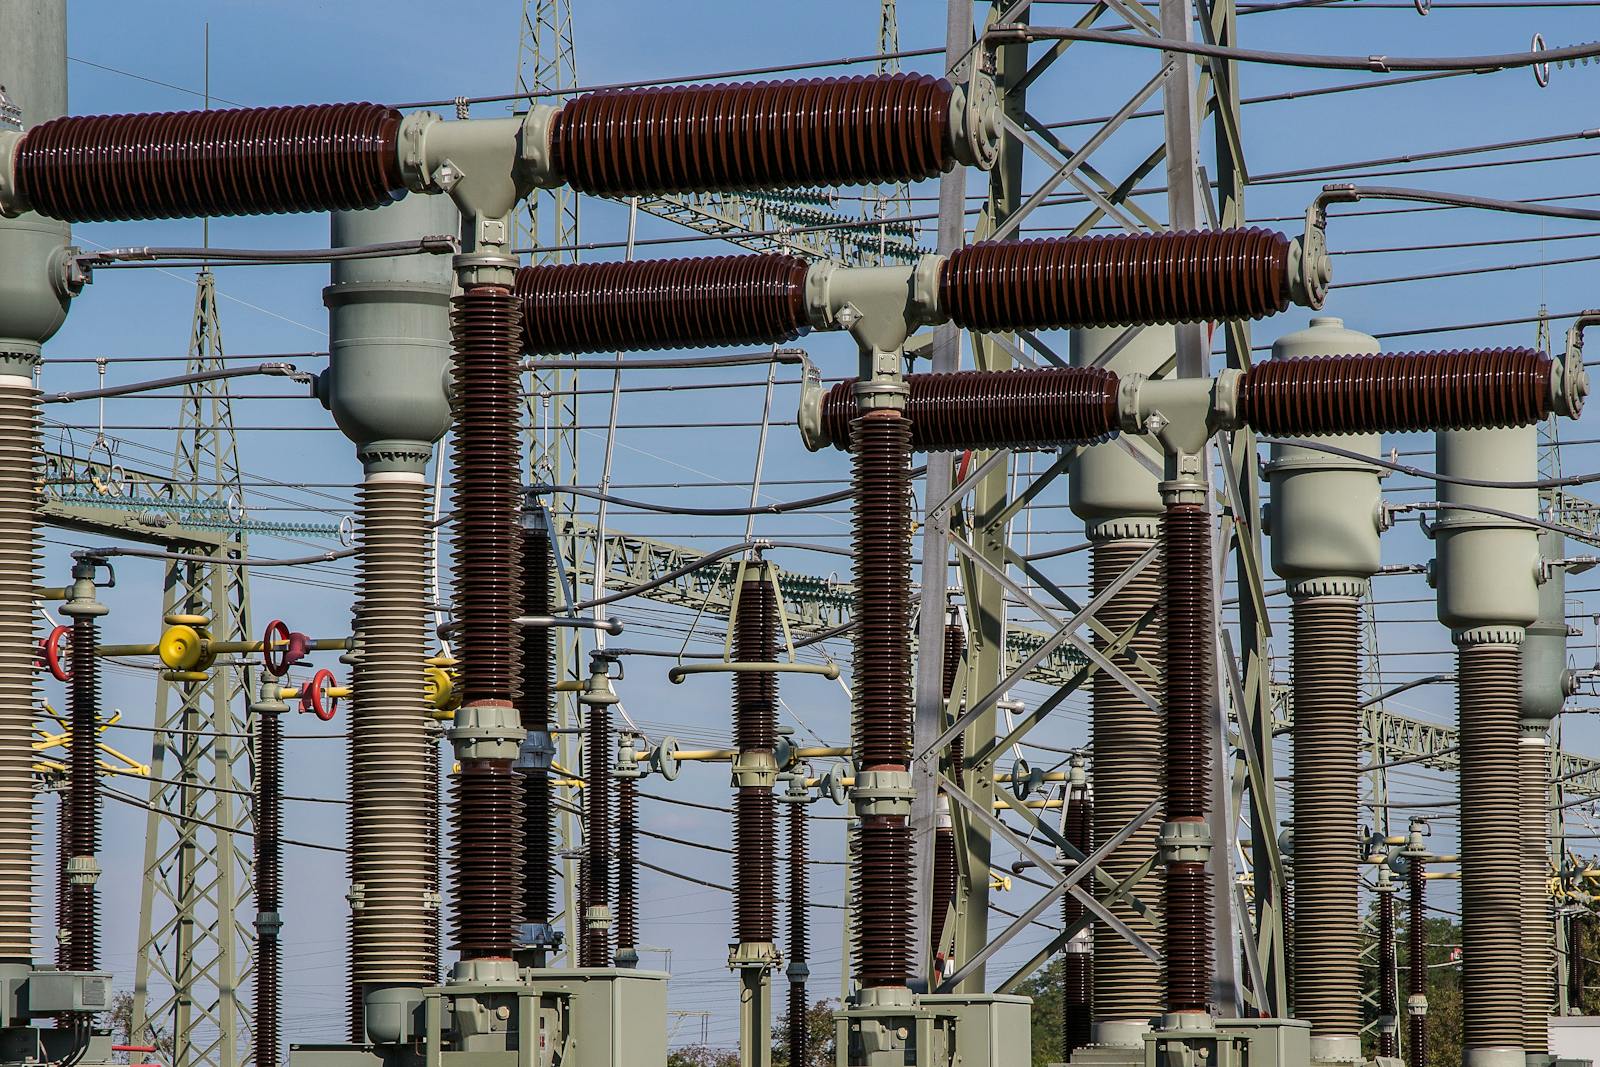
- Annual CO2 emissions: 12.6 million tons
- Annual PM2.5 emissions: 83 tons
- Annual nitrogen oxides emissions: 7,077 tons
- Total downstream population impacted by power plant: 7.2 million
7. Harrison County, WV (Harrison Power Station)
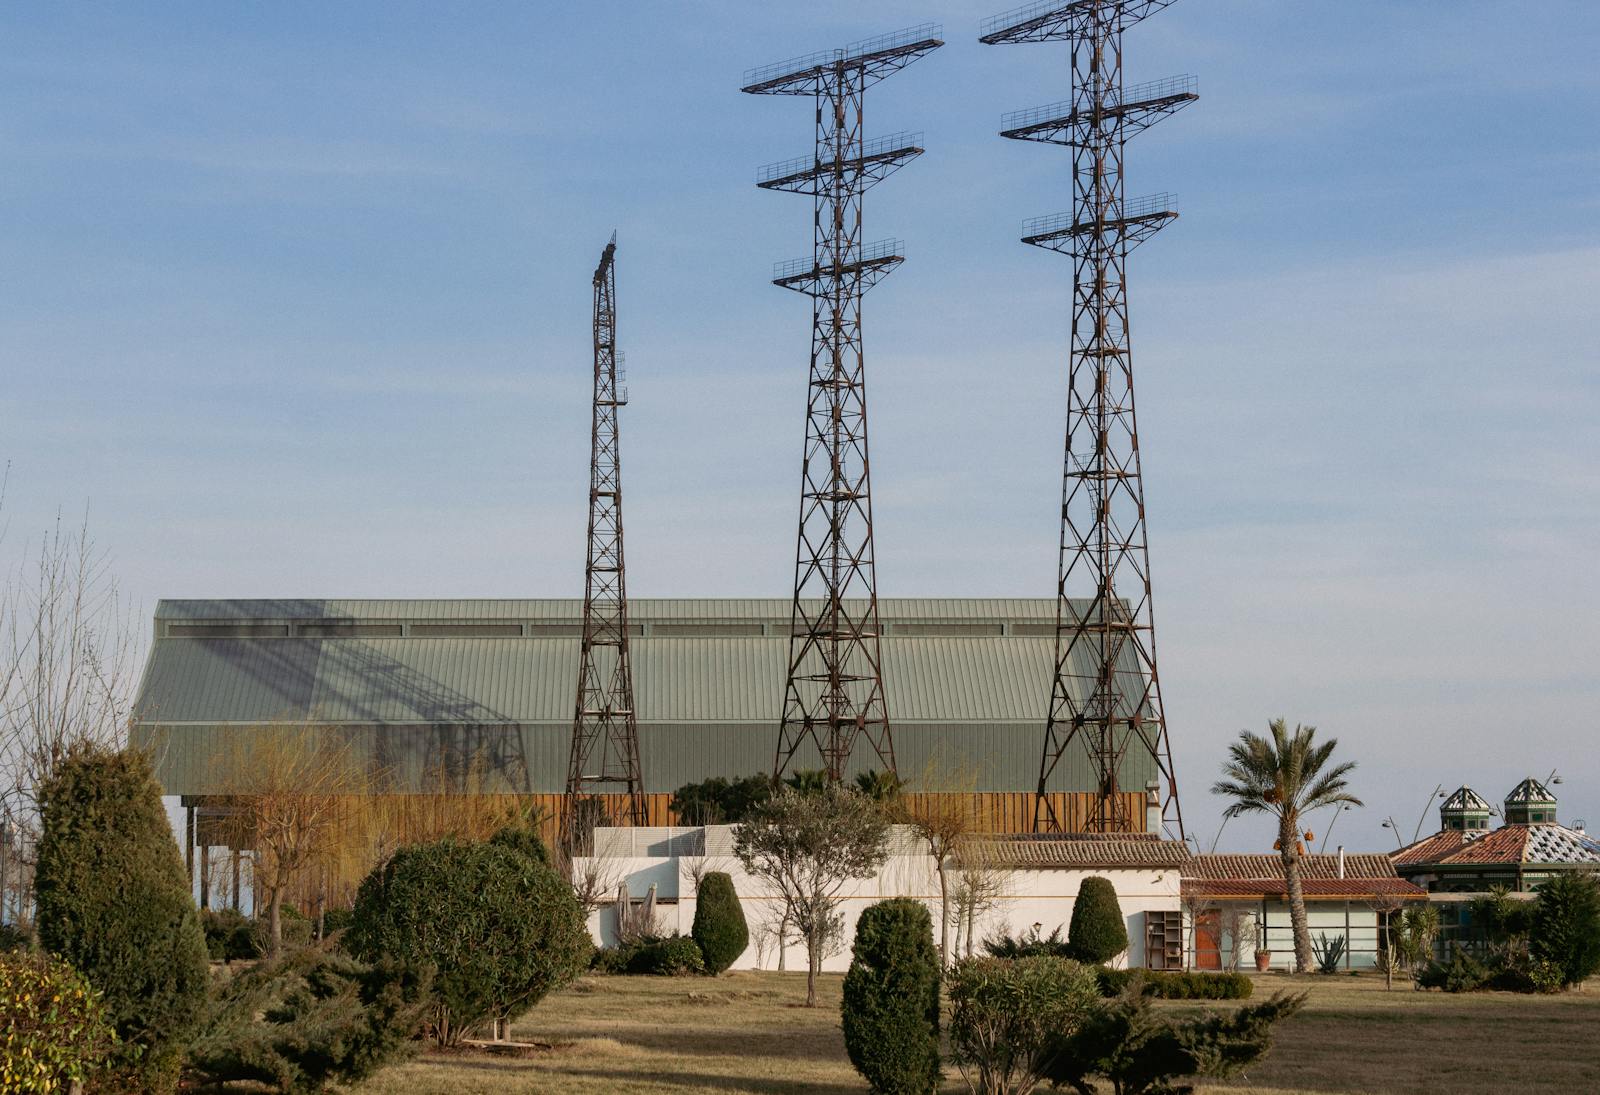
- Annual CO2 emissions: 12.8 million tons
- Annual PM2.5 emissions: 1,432 tons
- Annual nitrogen oxides emissions: 4,492 tons
- Total downstream population impacted by power plant: 59.4 million
6. Thompsons, TX (W.A. Parish Generating Station)
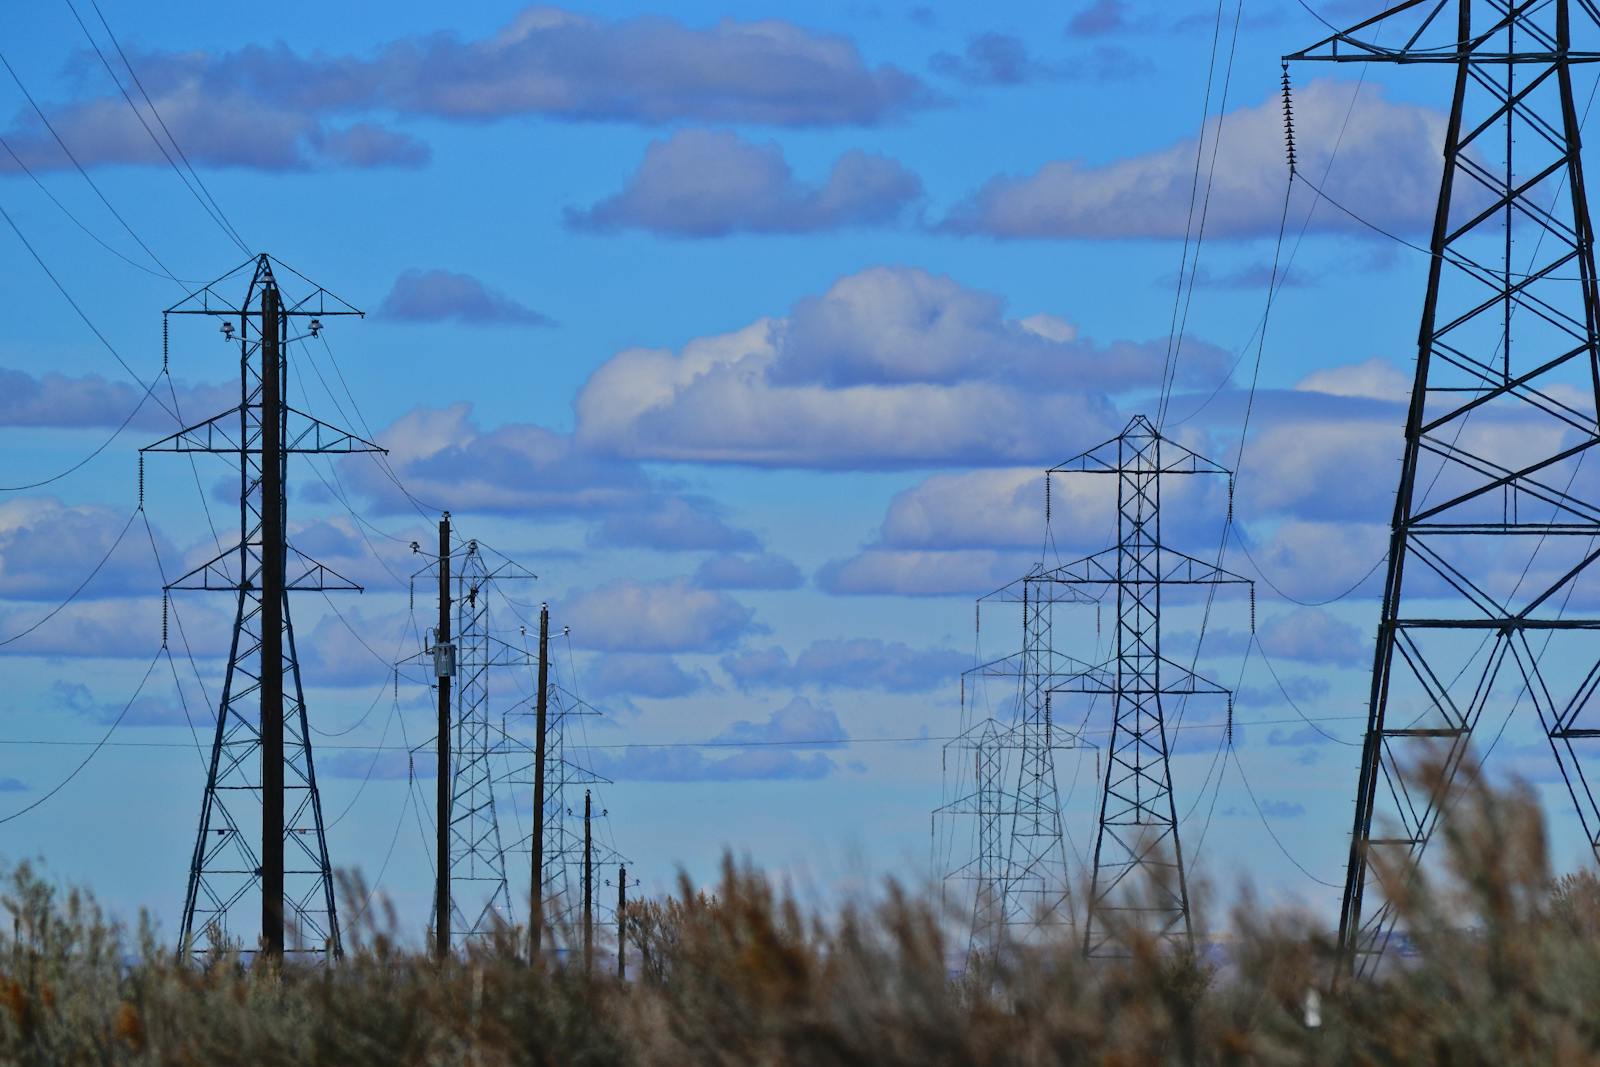
- Annual CO2 emissions: 13.6 million tons
- Annual PM2.5 emissions: 1,321 tons
- Annual nitrogen oxides emissions: 5,232 tons
- Total downstream population impacted by power plant: 63.3 million
5. Robertson County, TX (Oak Grove Power Plant)
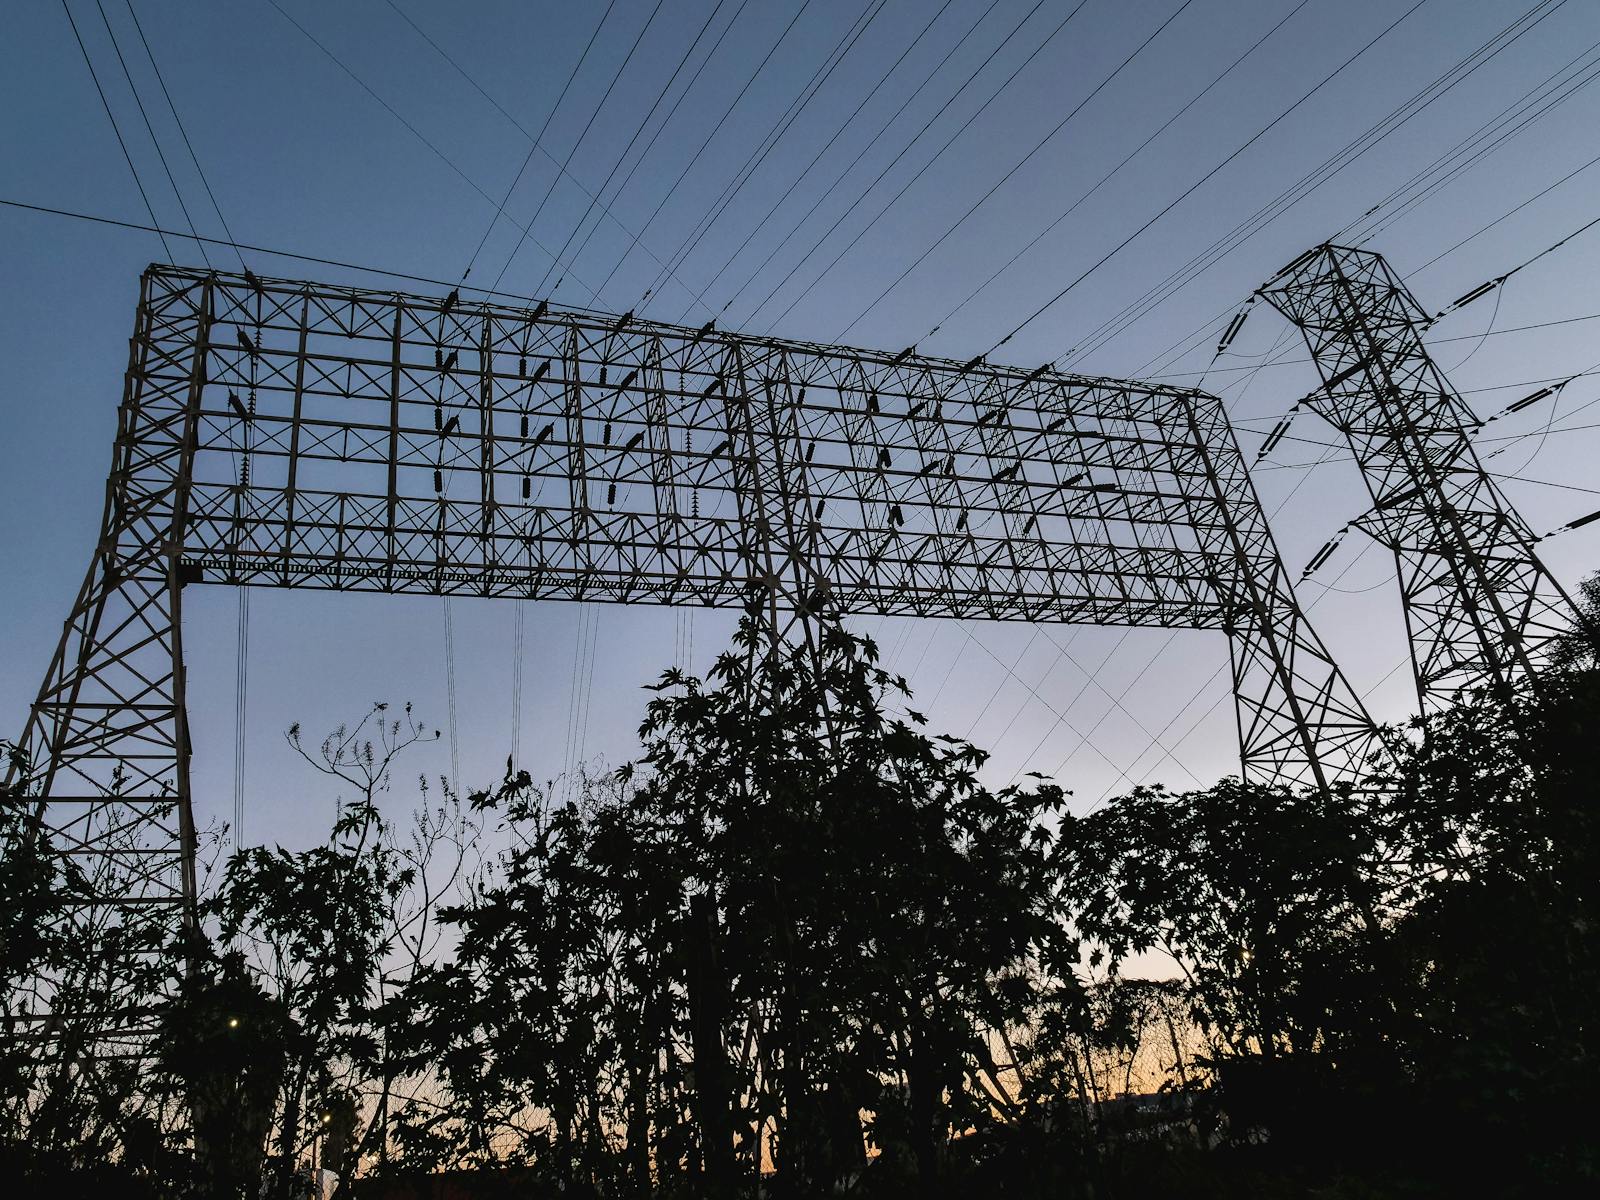
- Annual CO2 emissions: 13.9 million tons
- Annual PM2.5 emissions: 1,890 tons
- Annual nitrogen oxides emissions: 4,591 tons
- Total downstream population impacted by power plant: 37.8 million
4. Rusk County, TX (Martin Lake Power Plant)

- Annual CO2 emissions: 14.6 million tons
- Annual PM2.5 emissions: 995 tons
- Annual nitrogen oxides emissions: 9,000 tons
- Total downstream population impacted by power plant: 38.8 million
3. Monroe County, MI (Monroe Power Plant)

- Annual CO2 emissions: 16.3 million tons
- Annual PM2.5 emissions: 63 tons
- Annual nitrogen oxides emissions: 4,900 tons
- Total downstream population impacted by power plant: 77.9 million
2. Franklin County, MO (Labadie Power Plant)
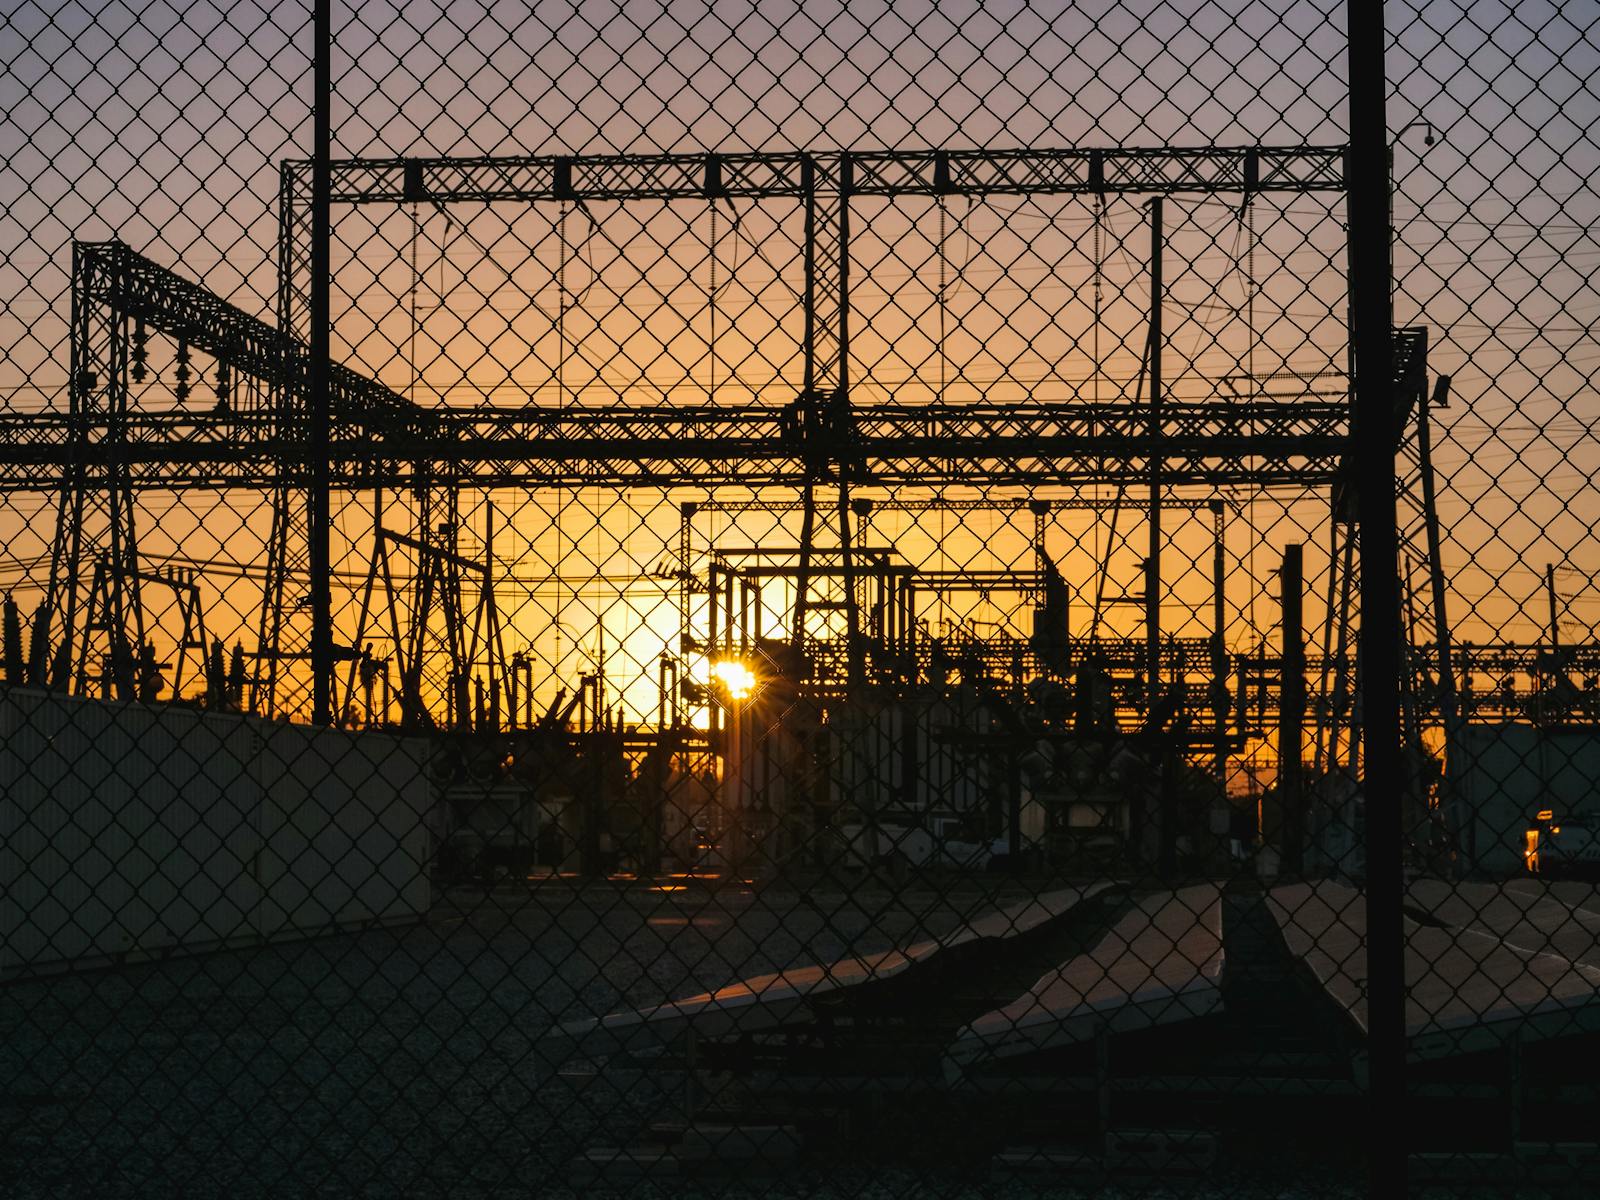
- Annual CO2 emissions: 17.3 million tons
- Annual PM2.5 emissions: 1,476 tons
- Annual nitrogen oxides emissions: 7,763 tons
- Total downstream population impacted by power plant: 58.5 million
1. Jefferson County, AL (James H. Miller Jr. Electric Generating Plant)

- Annual CO2 emissions: 23.8 million tons
- Annual PM2.5 emissions: 218 tons
- Annual nitrogen oxides emissions: 7,538 tons
- Total downstream population impacted by power plant: 68.5 million
More from ClimateCrisis 247
- From Texas to Ohio, Climate Change Fuels More Intense Downpours in These US Cities
- These Cities Are Directly in the Path of a Rare ‘High Risk’ Tornado Outbreak
- Tesla Hate Is Surging; The Next Elon Musk Protests Will Happen In These Cities
- Get Ready, Dayton and Louisville: Severe Rainstorms Are About to Batter Cities in Midwest And South. Are You On The List?
