It’s Not Just Newark: The Airports Where Extreme Weather Is Causing More Delays
 https://climatecrisis247.com/wp-content/uploads/2025/05/3709560-150x150.jpg
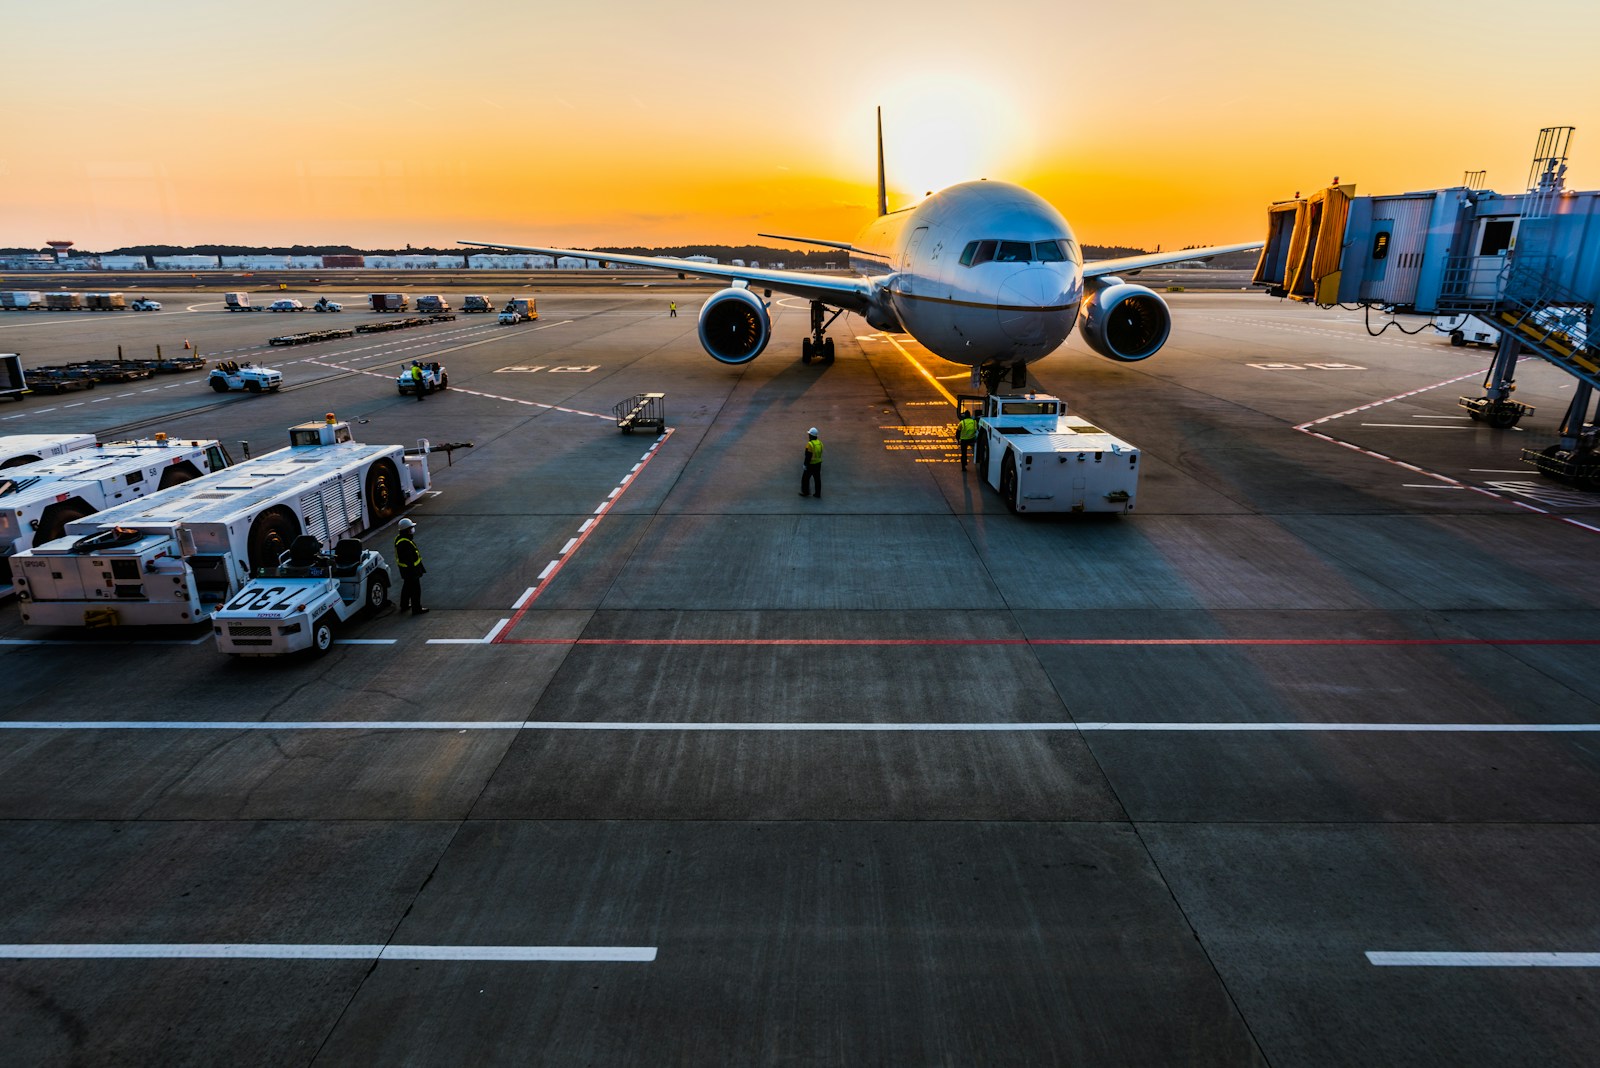
Over the past week, one of the nation’s busiest travel hubs has faced a wave of delays, cancellations, and technical disruptions. More than 200 flights at Newark Liberty International Airport were delayed in a period of just a few days, driven by a mix of staffing shortages and long-standing infrastructure problems.
Not in Kansas anymore? Tornado Alley Is Expanding South Into These Cities
Dying for air? Climate Activism Is Turning Deadly In These Cities
Among the many disruptions were weather-related delays averaging four hours. While weather is only one piece of the puzzle, Newark’s troubles highlight how climate change is increasingly affecting air travel.
Shifting wind patterns, hotter air, and more frequent storms are complicating takeoffs and landings, while rising seas threaten the long-term viability of some coastal airports.
Weather-related flight delays have risen alongside climate change, with some smaller airports reporting double-digit increases. An analysis of data from the U.S. Bureau of Transportation Statistics reveals which airports have seen the biggest jumps in weather-related delays since 2018.
To determine the airports where extreme weather is causing more delay activity, Climate Crisis 247 reviewed data on airport departures from the U.S. Bureau of Transportation Statistics. Airports were ranked based on the percentage-point change in weather-related departure delay activity as a share of all departure delay activity from 2018 to 2024. Delay activity is measured in total minutes of flight delay and is reported by cause by airline carriers. Only airports with at least 4,000 departing flights in 2024 were considered. Data on 2024 flights is through September 2024.
20. San Diego International (San Diego, CA)

- Weather-related delays, 2024: 3.0% of all delays (+1.7 ppts from 2018)
- Weather-related delays, 2018: 1.4% of all delays
- All departing flights that are delayed: 17.3%
19. Glacier Park International (Kalispell, MT)

- Weather-related delays, 2024: 5.8% of all delays (+1.7 ppts from 2018)
- Weather-related delays, 2018: 4.1% of all delays
- All departing flights that are delayed: 12.6%
18. Louis Armstrong New Orleans International (New Orleans, LA)
- Weather-related delays, 2024: 5.3% of all delays (+1.7 ppts from 2018)
- Weather-related delays, 2018: 3.5% of all delays
- All departing flights that are delayed: 19.3%
17. Cherry Capital (Traverse City, MI)

- Weather-related delays, 2024: 8.1% of all delays (+2.0 ppts from 2018)
- Weather-related delays, 2018: 6.1% of all delays
- All departing flights that are delayed: 16.2%
16. Northwest Florida Beaches International (Panama City, FL)
- Weather-related delays, 2024: 5.4% of all delays (+2.1 ppts from 2018)
- Weather-related delays, 2018: 3.2% of all delays
- All departing flights that are delayed: 16.1%
15. Charlotte Douglas International (Charlotte, NC)
- Weather-related delays, 2024: 8.6% of all delays (+2.2 ppts from 2018)
- Weather-related delays, 2018: 6.5% of all delays
- All departing flights that are delayed: 18.9%
14. Fort Wayne International (Fort Wayne, IN)

- Weather-related delays, 2024: 7.7% of all delays (+2.2 ppts from 2018)
- Weather-related delays, 2018: 5.6% of all delays
- All departing flights that are delayed: 17.0%
13. St Pete Clearwater International (St. Petersburg, FL)

- Weather-related delays, 2024: 15.4% of all delays (+2.3 ppts from 2018)
- Weather-related delays, 2018: 13.1% of all delays
- All departing flights that are delayed: 15.3%
12. Pensacola International (Pensacola, FL)

- Weather-related delays, 2024: 6.7% of all delays (+2.4 ppts from 2018)
- Weather-related delays, 2018: 4.3% of all delays
- All departing flights that are delayed: 14.3%
11. Portland International (Portland, OR)
- Weather-related delays, 2024: 4.4% of all delays (+2.8 ppts from 2018)
- Weather-related delays, 2018: 1.6% of all delays
- All departing flights that are delayed: 12.6%
10. Austin - Bergstrom International (Austin, TX)

- Weather-related delays, 2024: 5.7% of all delays (+3.3 ppts from 2018)
- Weather-related delays, 2018: 2.4% of all delays
- All departing flights that are delayed: 17.8%
9. Tallahassee International (Tallahassee, FL)
- Weather-related delays, 2024: 7.2% of all delays (+3.4 ppts from 2018)
- Weather-related delays, 2018: 3.8% of all delays
- All departing flights that are delayed: 14.0%
8. Huntsville International-Carl T Jones Field (Huntsville, AL)

- Weather-related delays, 2024: 8.7% of all delays (+5.6 ppts from 2018)
- Weather-related delays, 2018: 3.1% of all delays
- All departing flights that are delayed: 14.9%
7. Missoula Montana (Missoula, MT)

- Weather-related delays, 2024: 8.9% of all delays (+6.0 ppts from 2018)
- Weather-related delays, 2018: 2.9% of all delays
- All departing flights that are delayed: 13.8%
6. Bill and Hillary Clinton Nat Adams Field (Little Rock, AR)

- Weather-related delays, 2024: 10.4% of all delays (+6.2 ppts from 2018)
- Weather-related delays, 2018: 4.2% of all delays
- All departing flights that are delayed: 15.1%
5. Springfield-Branson National (Springfield, MO)

- Weather-related delays, 2024: 13.1% of all delays (+6.3 ppts from 2018)
- Weather-related delays, 2018: 6.8% of all delays
- All departing flights that are delayed: 17.2%
4. Appleton International (Appleton, WI)

- Weather-related delays, 2024: 13.7% of all delays (+7.2 ppts from 2018)
- Weather-related delays, 2018: 6.6% of all delays
- All departing flights that are delayed: 14.4%
3. Eppley Airfield (Omaha, NE)
- Weather-related delays, 2024: 10.8% of all delays (+7.4 ppts from 2018)
- Weather-related delays, 2018: 3.4% of all delays
- All departing flights that are delayed: 14.8%
2. Roberts Field (Bend/Redmond, OR)

- Weather-related delays, 2024: 16.5% of all delays (+11.1 ppts from 2018)
- Weather-related delays, 2018: 5.4% of all delays
- All departing flights that are delayed: 14.5%
1. Aspen Pitkin County Sardy Field (Aspen, CO)

- Weather-related delays, 2024: 25.9% of all delays (+19.0 ppts from 2018)
- Weather-related delays, 2018: 6.9% of all delays
- All departing flights that are delayed: 19.6%
More from ClimateCrisis 247
- These Places Have The Highest Risk of a Major Wildfire in 2025
- In 50 Years, Which U.S. Cities Are Projected To Become Deserts? A New Study Details the Locations
- Two Months of Rain in Two Days? A Southeast Storm Is Bringing Heavy Winds, Precipitation to These Cities This Week
- Chevy EV Sales Double While Tesla Declines: See the EV Models Overtaking Tesla in Popularity