
July Heat Shattered Historic Highs in These Counties
 https://climate-crisis-247-bucket.nyc3.cdn.digitaloceanspaces.com/wp-content/uploads/2025/08/07205935/5wrgsa1ycps-150x150.jpg
Recent climate data analysis indicates that last month will go down as the third hottest July on record globally. In the United States, extreme heat events across large swaths of the country pushed temperatures well above historic norms. According to the National Oceanic and Atmospheric Administration, temperatures in the continental U.S. averaged 75.4°F throughout July 2025, about 1.8°F higher than what is typical for the month, based on July averages recorded between 1901 and 2000 – and only about 1.4°F below the all-time monthly high, reported in 1936.
July temperatures were especially high in certain parts of the country – particularly along the East Coast. The average July temperature hit all-time highs in both Virginia and West Virginia, at 78.7°F and 76.1°F, respectively. Similarly, Maryland and North Carolina each reported their second hottest July in at least the last 131 years.
At the local level, record-breaking temperatures were even more common. Across the Lower 48, there were 111 counties or county equivalents in which 2025 now stands as the hottest July on record. In over a dozen of these places, the average temperature last month exceeded the 21st century baseline by more than 5°F.
Using data from NOAA, Climate Crisis 247 identified the U.S. counties where average July temperatures hit historic highs in 2025. We reviewed average temperatures in July 2025 for over 3,100 counties and county equivalents, and identified those for which last month’s average temperature was the highest since record keeping began in 1895. Only counties where July temperatures hit a record high in 2025 and exceeded the average July temperature throughout the 21st century by at least 5°F rank on this list. All supplemental temperature data is from NOAA. Population data are five-year estimates from the U.S. Census Bureau’s 2023 American Community Survey. Due to a reclassification of counties, population data for Connecticut is current as of 2020. Counties are listed in ascending order, based on the difference between their average temperature in July 2025 and the average July temperature from 1901 to 2000.
The counties on this list span four states – Connecticut, Maryland, Virginia, and West Virginia – and are collectively home to more than 1.2 million Americans.
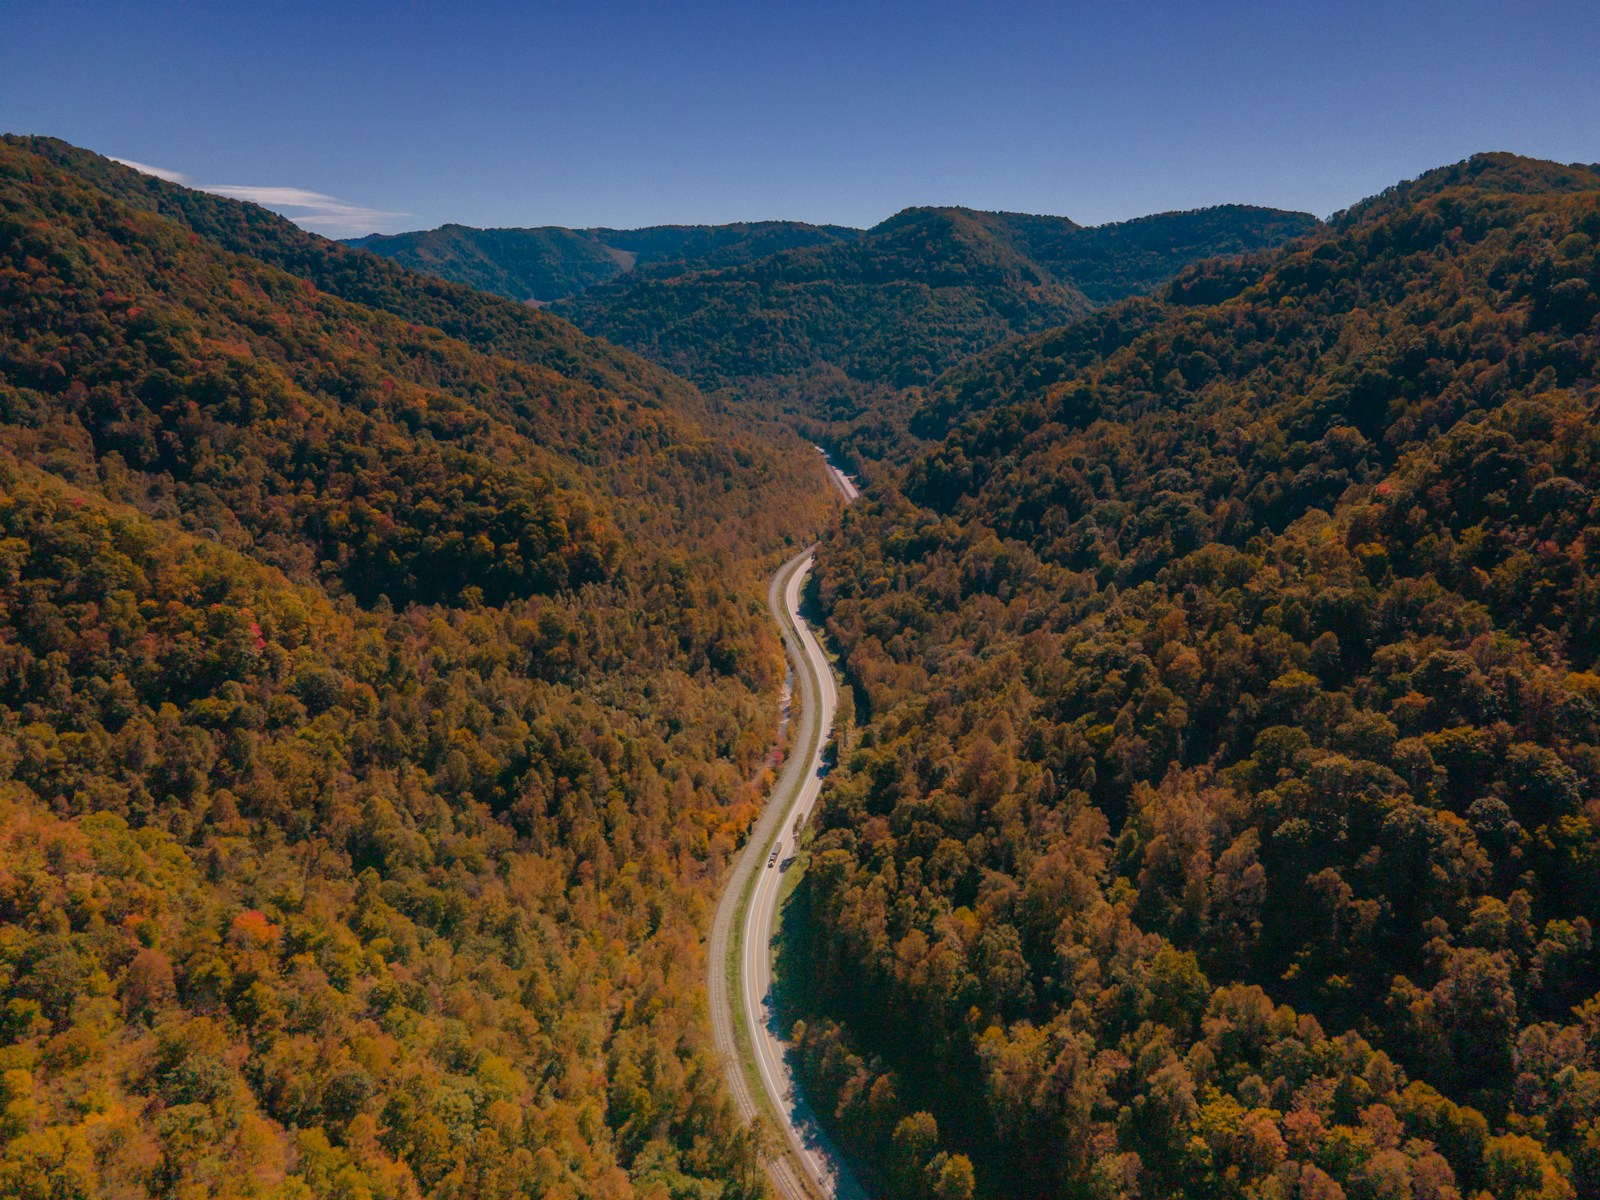
13. Mineral County, West Virginia
- Average temperature in July 2025: 78.1°F (hottest July on record)
- Baseline, 20th century average July temperature: 73.0°F
- Average temperature in July 2025 compared to baseline: +5.1°F
- Local population: 26,922
12. Madison County, Virginia

- Average temperature in July 2025: 78.5°F (hottest July on record)
- Baseline, 20th century average July temperature: 73.4°F
- Average temperature in July 2025 compared to baseline: +5.1°F
- Local population: 13,931
11. Orange County, Virginia

- Average temperature in July 2025: 80.5°F (hottest July on record)
- Baseline, 20th century average July temperature: 75.4°F
- Average temperature in July 2025 compared to baseline: +5.1°F
- Local population: 37,208
10. Fluvanna County, Virginia

- Average temperature in July 2025: 81.1°F (hottest July on record)
- Baseline, 20th century average July temperature: 76.0°F
- Average temperature in July 2025 compared to baseline: +5.1°F
- Local population: 27,764
9. Grant County, West Virginia

- Average temperature in July 2025: 75.6°F (hottest July on record)
- Baseline, 20th century average July temperature: 70.4°F
- Average temperature in July 2025 compared to baseline: +5.2°F
- Local population: 10,972
8. Harrison County, West Virginia

- Average temperature in July 2025: 77.9°F (hottest July on record)
- Baseline, 20th century average July temperature: 72.7°F
- Average temperature in July 2025 compared to baseline: +5.2°F
- Local population: 65,407
7. Randolph County, West Virginia

- Average temperature in July 2025: 72.2°F (hottest July on record)
- Baseline, 20th century average July temperature: 66.8°F
- Average temperature in July 2025 compared to baseline: +5.4°F
- Local population: 27,782
6. Tucker County, West Virginia

- Average temperature in July 2025: 72.6°F (hottest July on record)
- Baseline, 20th century average July temperature: 67.1°F
- Average temperature in July 2025 compared to baseline: +5.5°F
- Local population: 6,698
5. Garrett County, Maryland

- Average temperature in July 2025: 73.3°F (hottest July on record)
- Baseline, 20th century average July temperature: 67.8°F
- Average temperature in July 2025 compared to baseline: +5.5°F
- Local population: 28,713
4. Fairfield County, Connecticut

- Average temperature in July 2025: 77.3°F (hottest July on record)
- Baseline, 20th century average July temperature: 71.8°F
- Average temperature in July 2025 compared to baseline: +5.5°F
- Local population: 957,419
3. Lewis County, West Virginia

- Average temperature in July 2025: 78.4°F (hottest July on record)
- Baseline, 20th century average July temperature: 72.9°F
- Average temperature in July 2025 compared to baseline: +5.5°F
- Local population: 16,808
2. Barbour County, West Virginia

- Average temperature in July 2025: 76.6°F (hottest July on record)
- Baseline, 20th century average July temperature: 71.0°F
- Average temperature in July 2025 compared to baseline: +5.6°F
- Local population: 15,454
1. Upshur County, West Virginia

- Average temperature in July 2025: 76.6°F (hottest July on record)
- Baseline, 20th century average July temperature: 70.7°F
- Average temperature in July 2025 compared to baseline: +5.9°F
- Local population: 23,758