
On This Labor Day, These National Parks Have the Worst Air Quality
 https://climate-crisis-247-bucket.nyc3.cdn.digitaloceanspaces.com/wp-content/uploads/2025/08/07204319/Wildfires-and-particulate-matter-concentration-August-31-2025-1-150x150.png
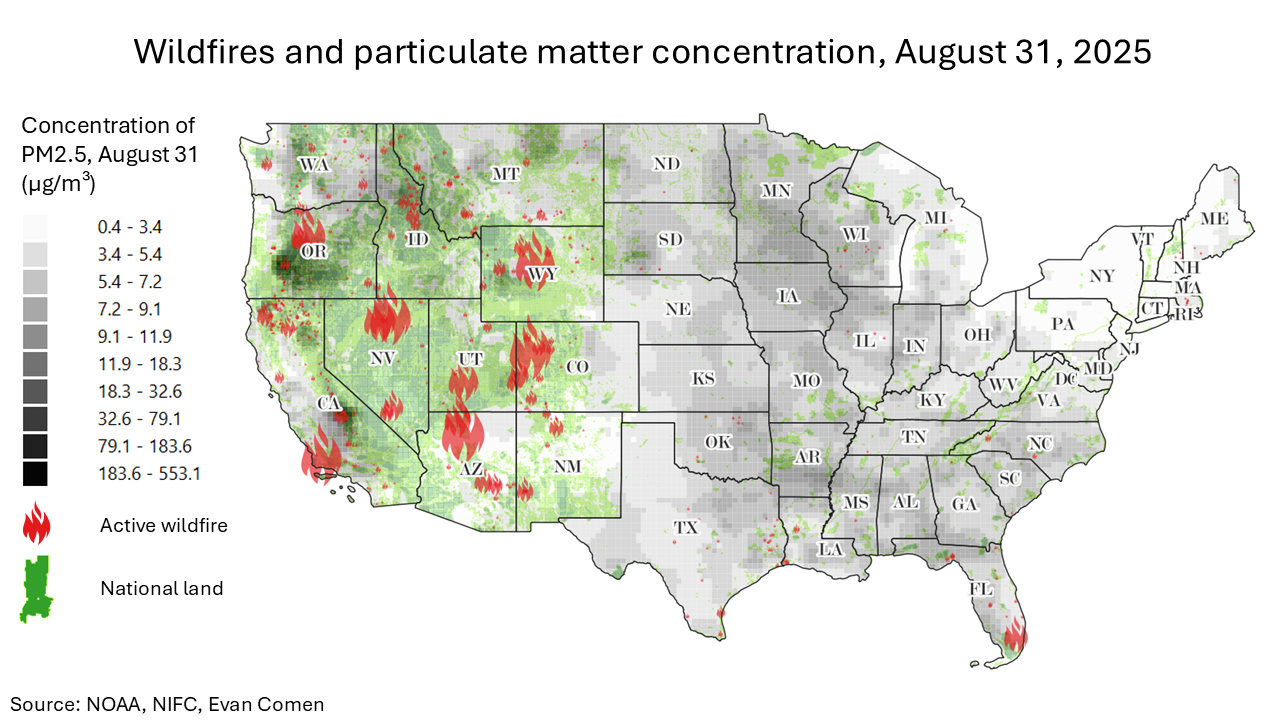
According to the latest data from the University of Chicago’s Air Quality Life Index, average concentrations of particulate matter in the United States rose 1.5% from 2022 to 2023. While improvements in air quality are one of the greatest public health achievements of the last 50 years, the recent reversals of clean air progress are largely due to increased wildfire activity.
The impacts of wildfire on U.S. air quality are particularly apparent in America’s national parks this Labor Day. There are currently five megafires at least 100,000 acres in size burning throughout the contiguous United States, spreading dangerous smoke throughout some of the biggest national parks on one of the most popular outdoor days of the year. In several parks, the concentration of particulate matter is well beyond the threshold for unhealthy air of 35 micrograms of particulate matter per cubic meter of air. A closer look at the data reveals the national parks with the worst air quality this Labor Day.
To determine the national parks with the worst air quality this Labor Day, Climate Crisis 247 reviewed data on particulate matter concentration forecasts from the NOAA. National lands were ranked based on average particulate matter concentration as of September 1, 2025.
9. Deschutes National Forest (OR)
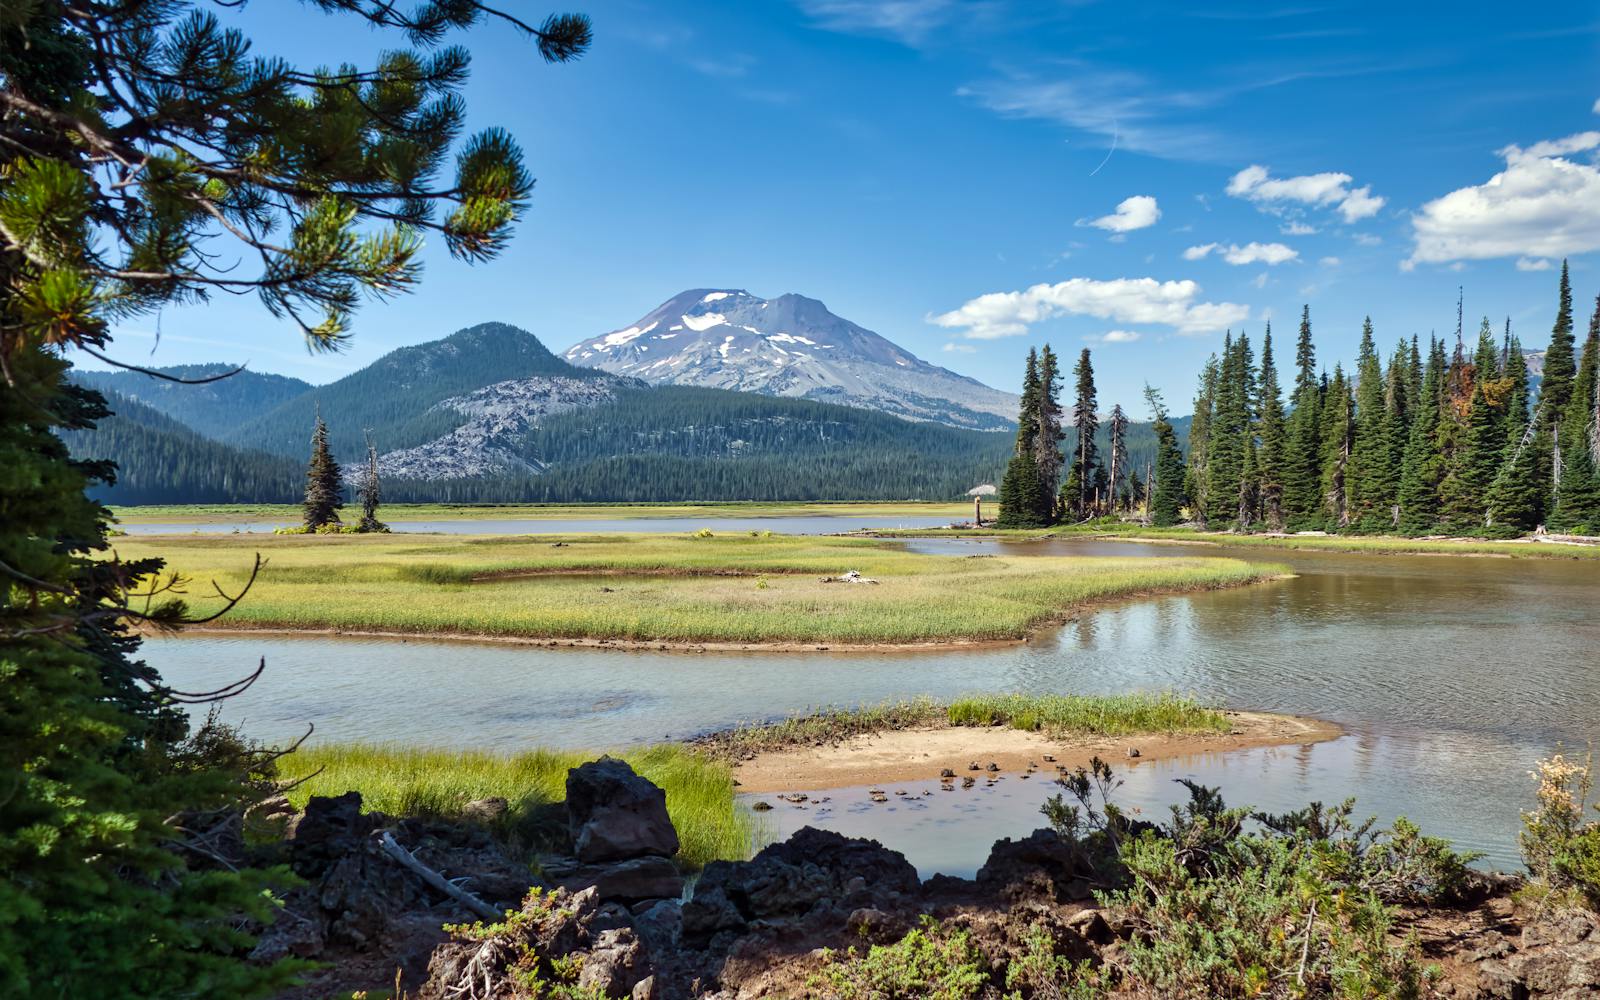
- Current concentration of PM2.5: 34.3 µg/m³
- Total land area: 2,506.7 square miles
- Agency: Forest Service
8. Crater Lake National Park (OR)
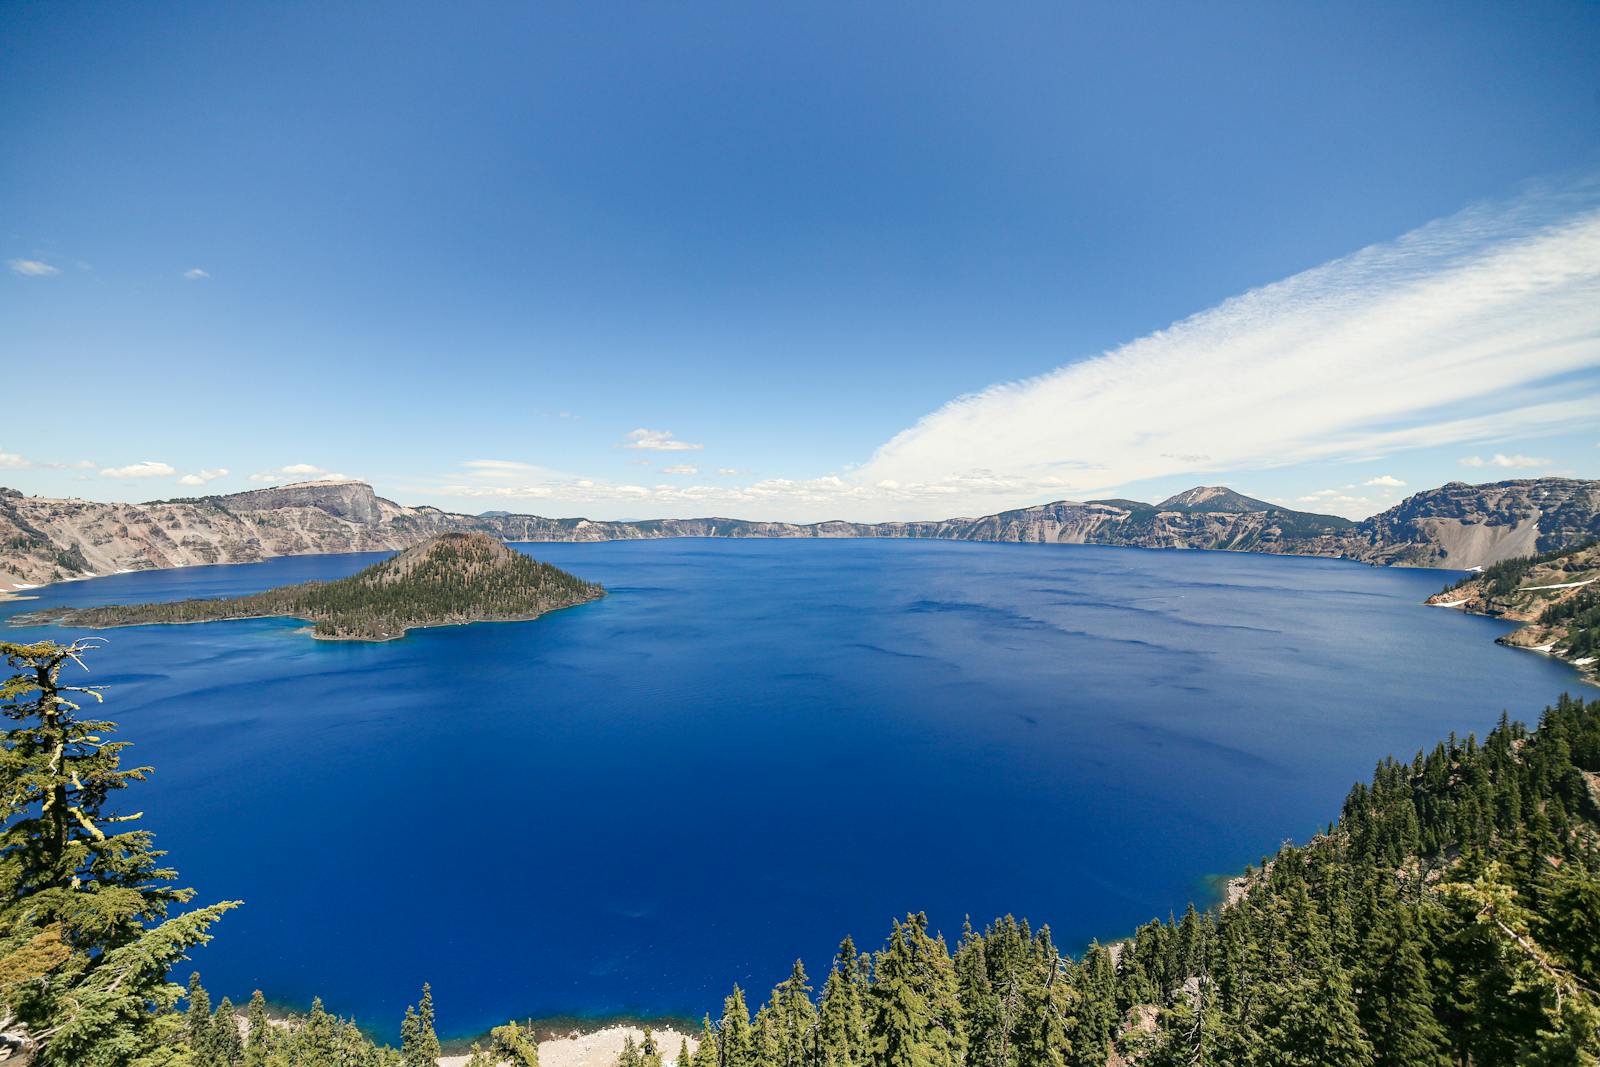
- Current concentration of PM2.5: 36.0 µg/m³
- Total land area: 285.2 square miles
- Agency: National Park Service
7. Fremont-Winema National Forest (OR, CA)
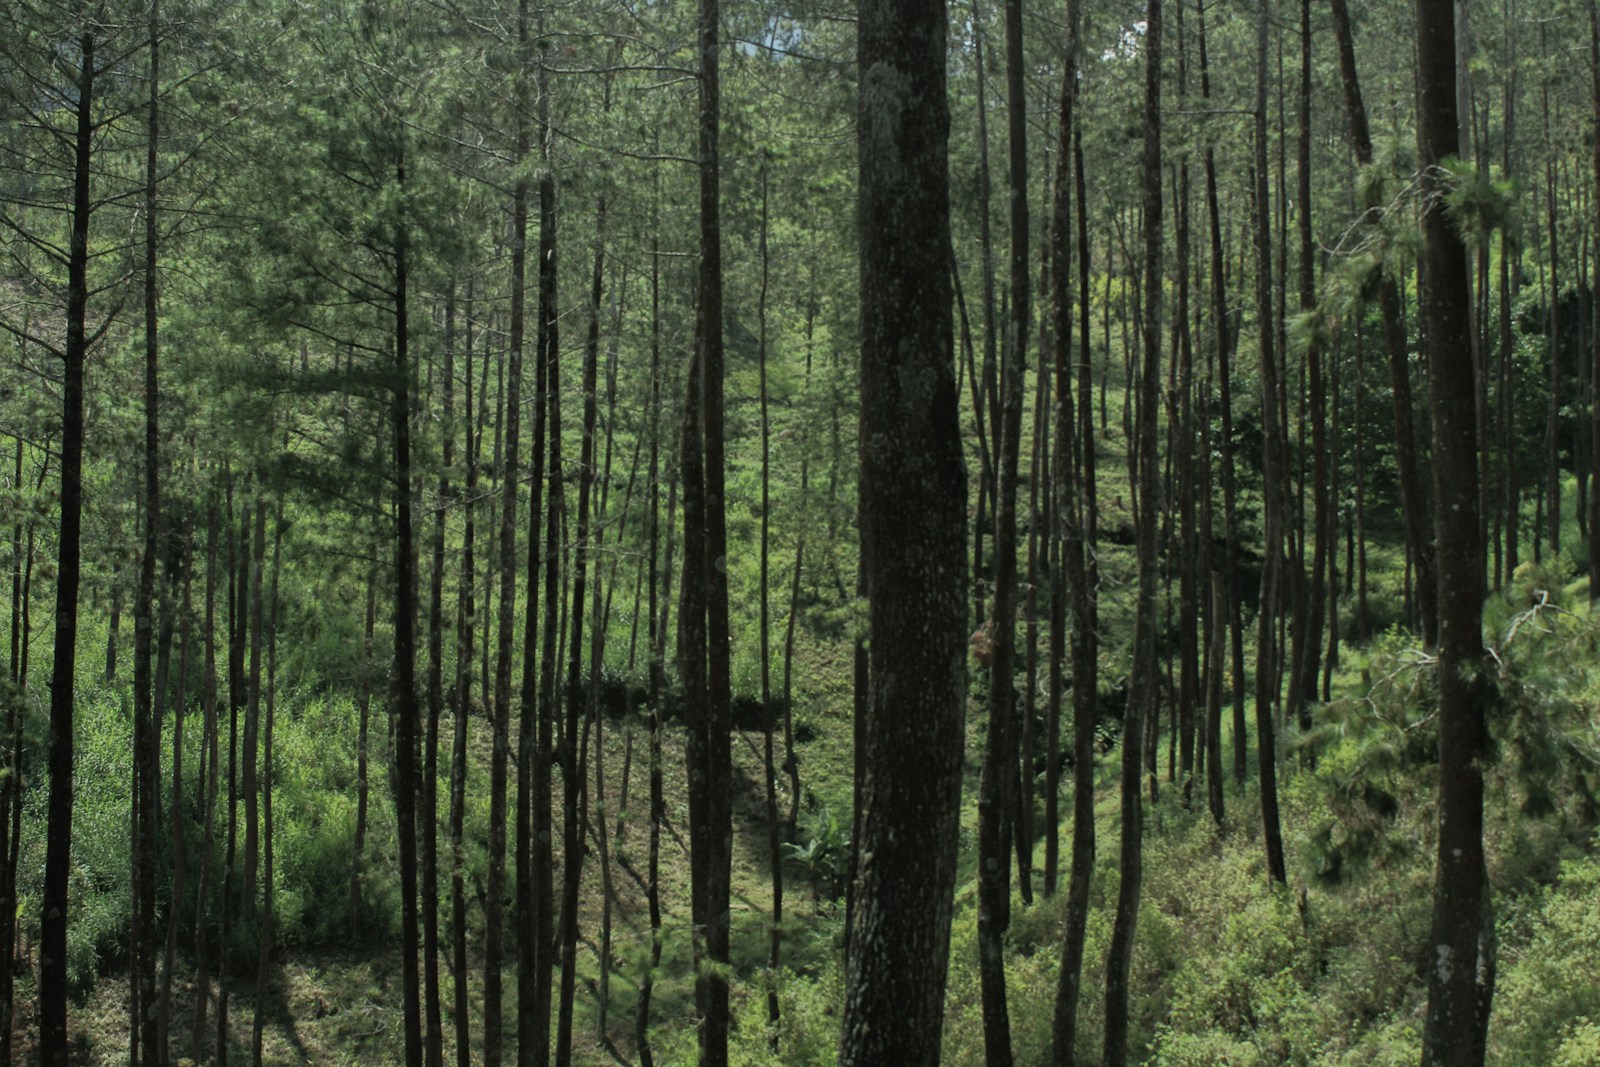
- Current concentration of PM2.5: 37.0 µg/m³
- Total land area: 2,928.7 square miles
- Agency: Forest Service
6. Sequoia National Park (CA)
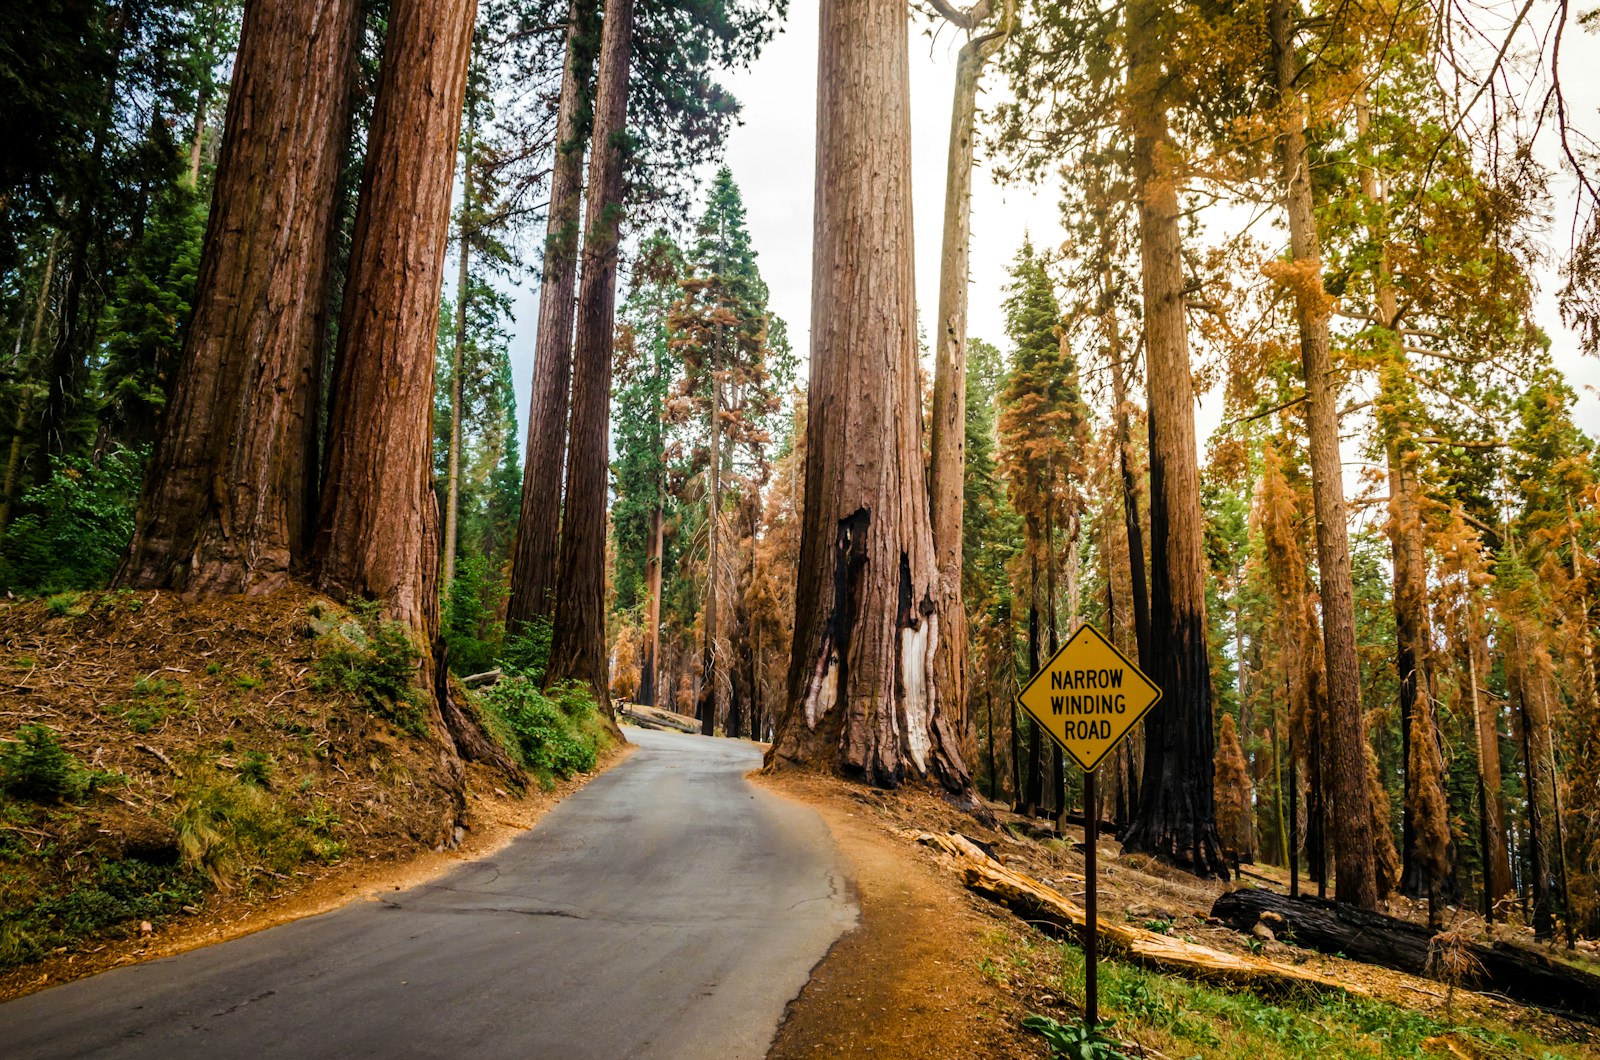
- Current concentration of PM2.5: 41.5 µg/m³
- Total land area: 635.6 square miles
- Agency: National Park Service
5. Millerton Lake (CA)
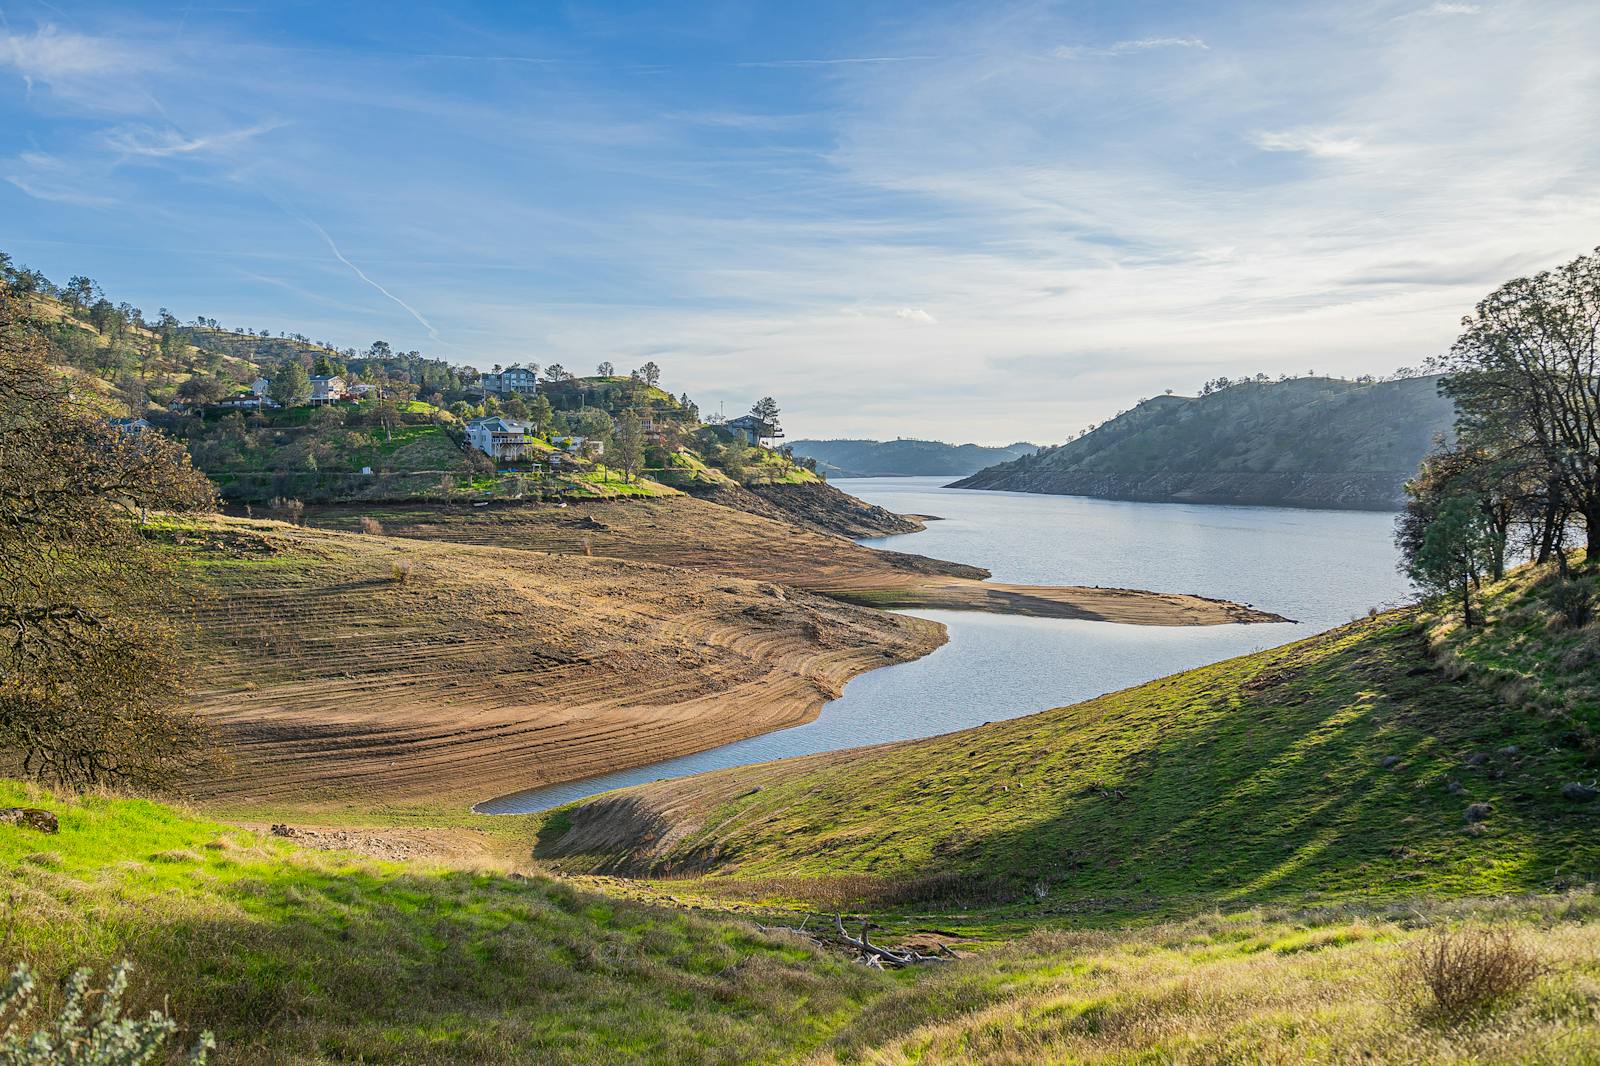
- Current concentration of PM2.5: 44.9 µg/m³
- Total land area: 17.8 square miles
- Agency: Bureau of Reclamation
4. Willamette National Forest (OR)
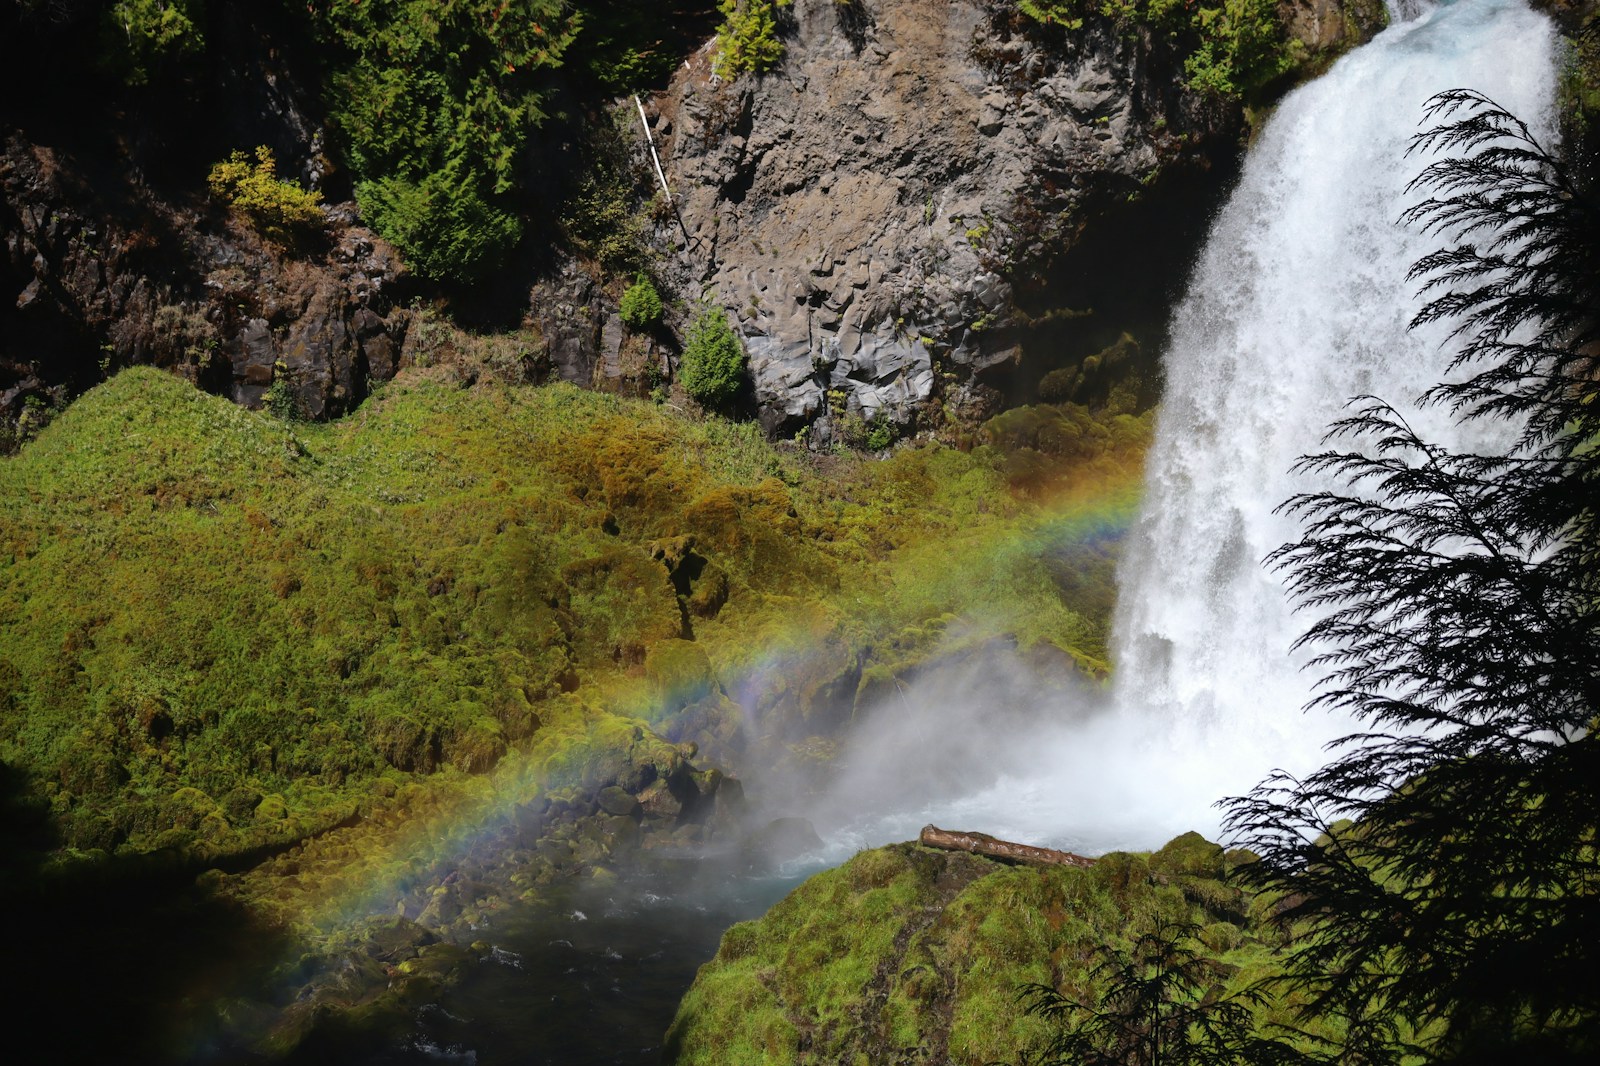
- Current concentration of PM2.5: 77.0 µg/m³
- Total land area: 2,623.0 square miles
- Agency: Forest Service
3. Sierra National Forest (CA)
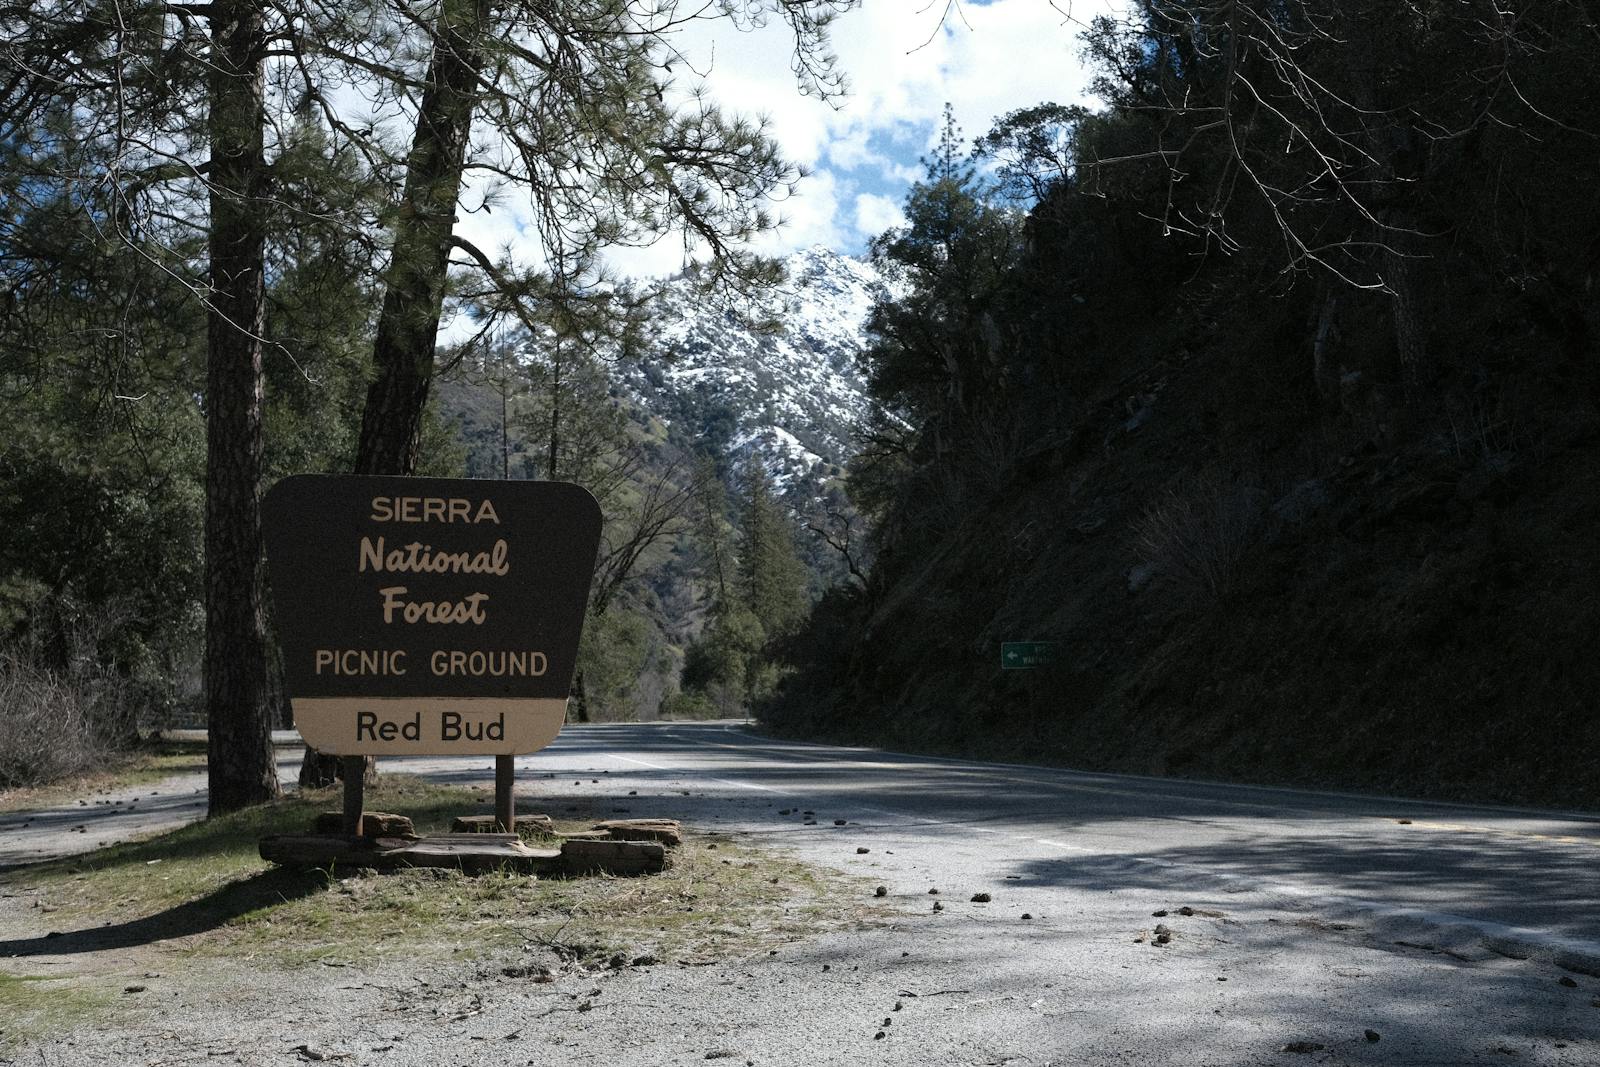
- Current concentration of PM2.5: 80.4 µg/m³
- Total land area: 2,035.8 square miles
- Agency: Forest Service
2. Kings Canyon National Park (CA)
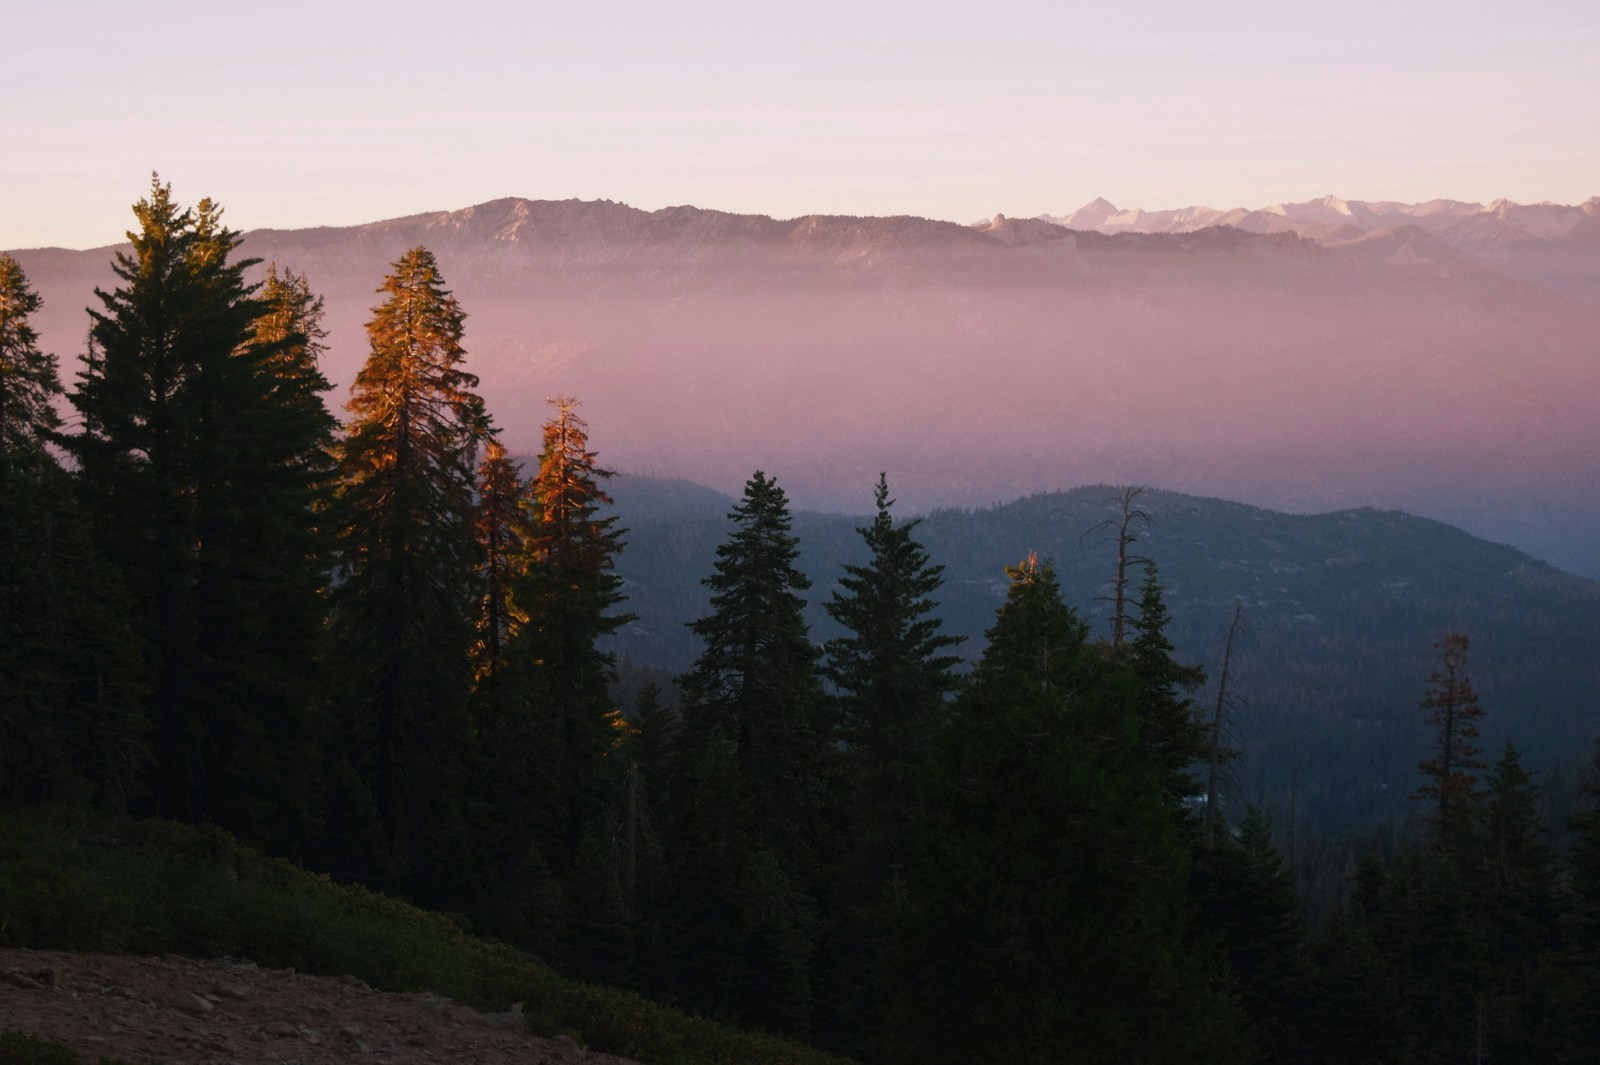
- Current concentration of PM2.5: 89.2 µg/m³
- Total land area: 693.3 square miles
- Agency: National Park Service
1. Umpqua National Forest (OR)
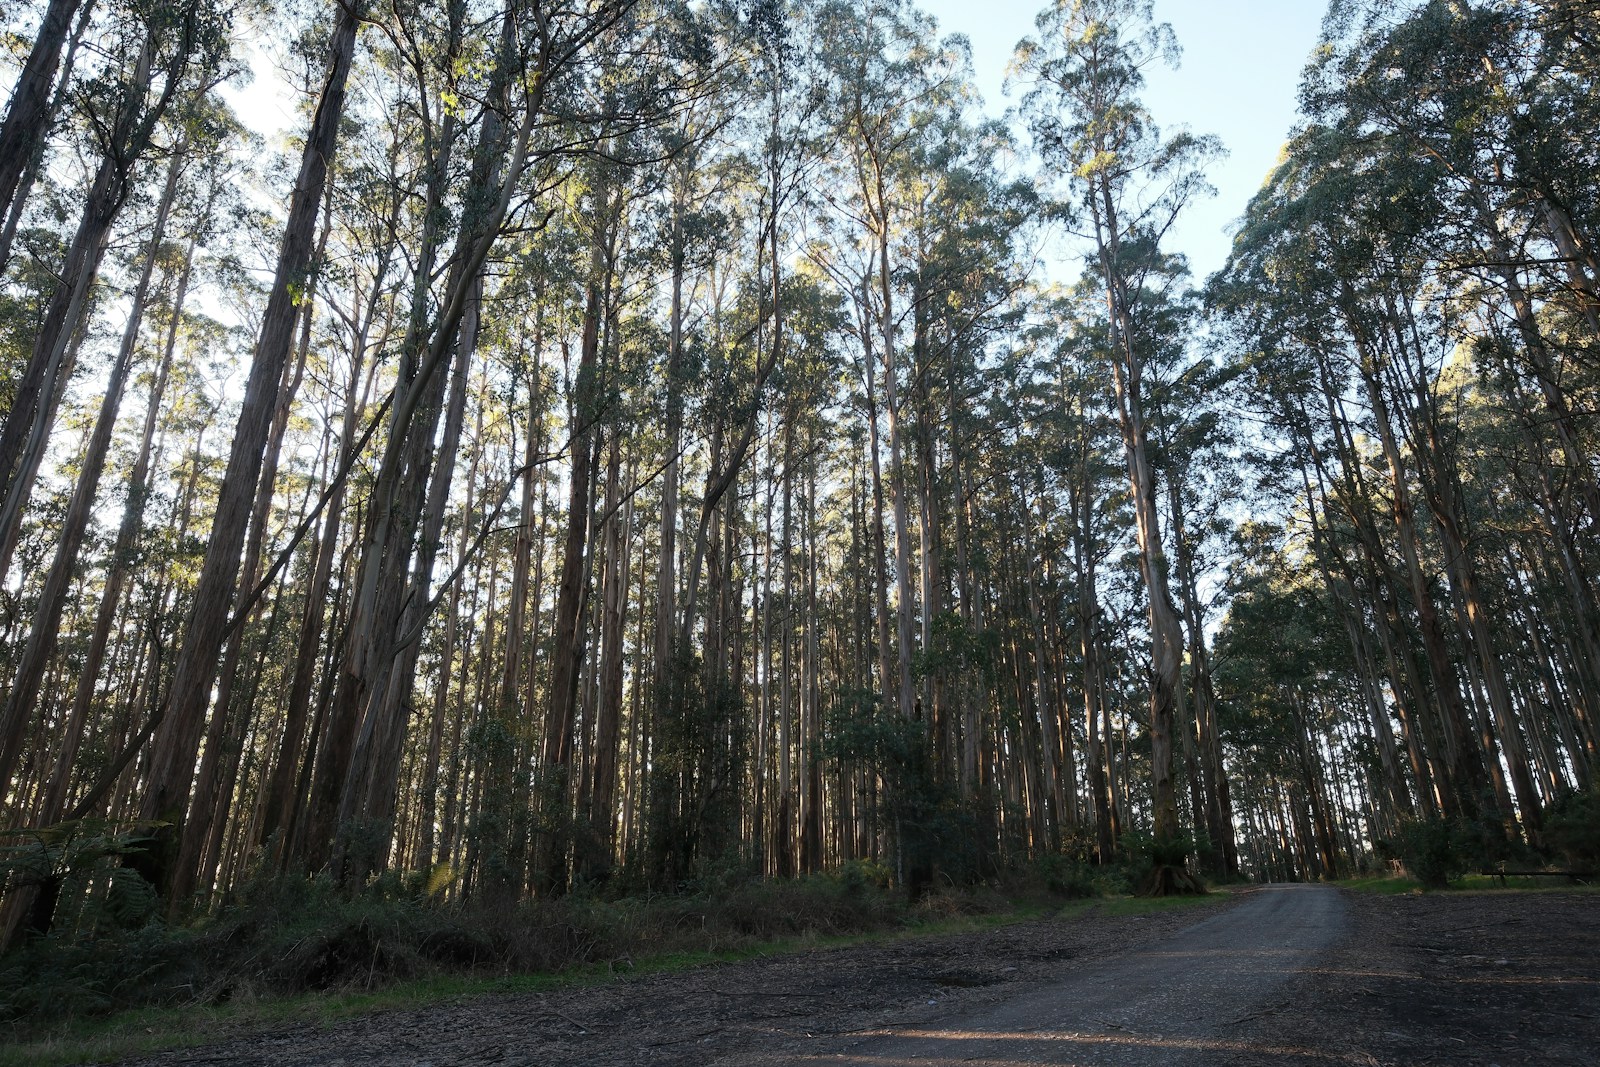
- Current concentration of PM2.5: 132.3 µg/m³
- Total land area: 1,440.1 square miles
- Agency: Forest Service