Rare ‘Omega Block’ Weather Pattern to Bring Days of Chilly Air to These Cities
 https://climatecrisis247.com/wp-content/uploads/2025/05/omega-map-150x150.png
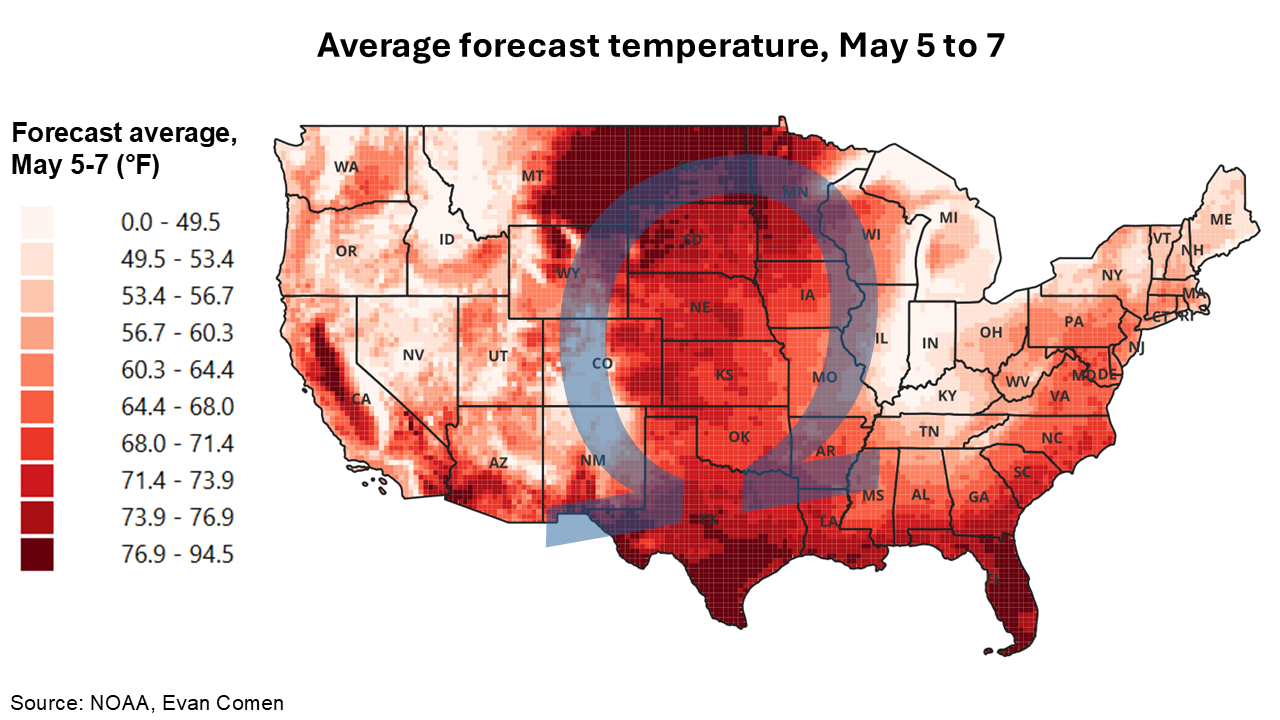
A rare, persistent weather pattern known as an “omega block” is setting up across the continental U.S. this week. Named for the shape of the Greek letter Ω, omega blocks occur when a ridge of high pressure becomes trapped between two areas of low pressure. The result is a slow-moving and stagnant weather setup that can last for days, bringing prolonged impacts to regions on both sides of the ridge.
DOGE backlash? The Federal Departments Americans Want To Keep
Dying for air? Climate Activism Is Turning Deadly In These Cities
The configuration disrupts the usual west-to-east flow of weather systems, causing weather systems to linger for several days. According to NOAA forecasts, a strong ridge of high pressure has formed over the northern Plains, flanked by two low-pressure systems over the Ohio Valley and the West Coast. Cities in the center of the omega block will experience abnormally high temperatures and dry conditions, while cities on the outside of the omega formation on both coasts will experience cool temperatures and heavy precipitation. A closer look at the data reveals the cities that will be abnormally cool this week.
To determine the cities where it will be abnormally cool this week, Climate Crisis 247 reviewed 72-hour temperature forecasts and historical station-level daily temperature readings from the NOAA. Cities were ranked based on the difference between the forecast average temperature for May 5-7 2025, and the average observed temperature for May 4-6 from 2006 to 2020. Gridded forecast data are from the National Digital Forecast Database, while historical temperature normals are from the Global Historical Climatology Network daily program of the National Centers for Environmental Information. Weather stations were matched to places using nearest neighbor analysis and were limited to cities within 50 miles of the city centroid. Only cities with at least 25,000 residents were considered.
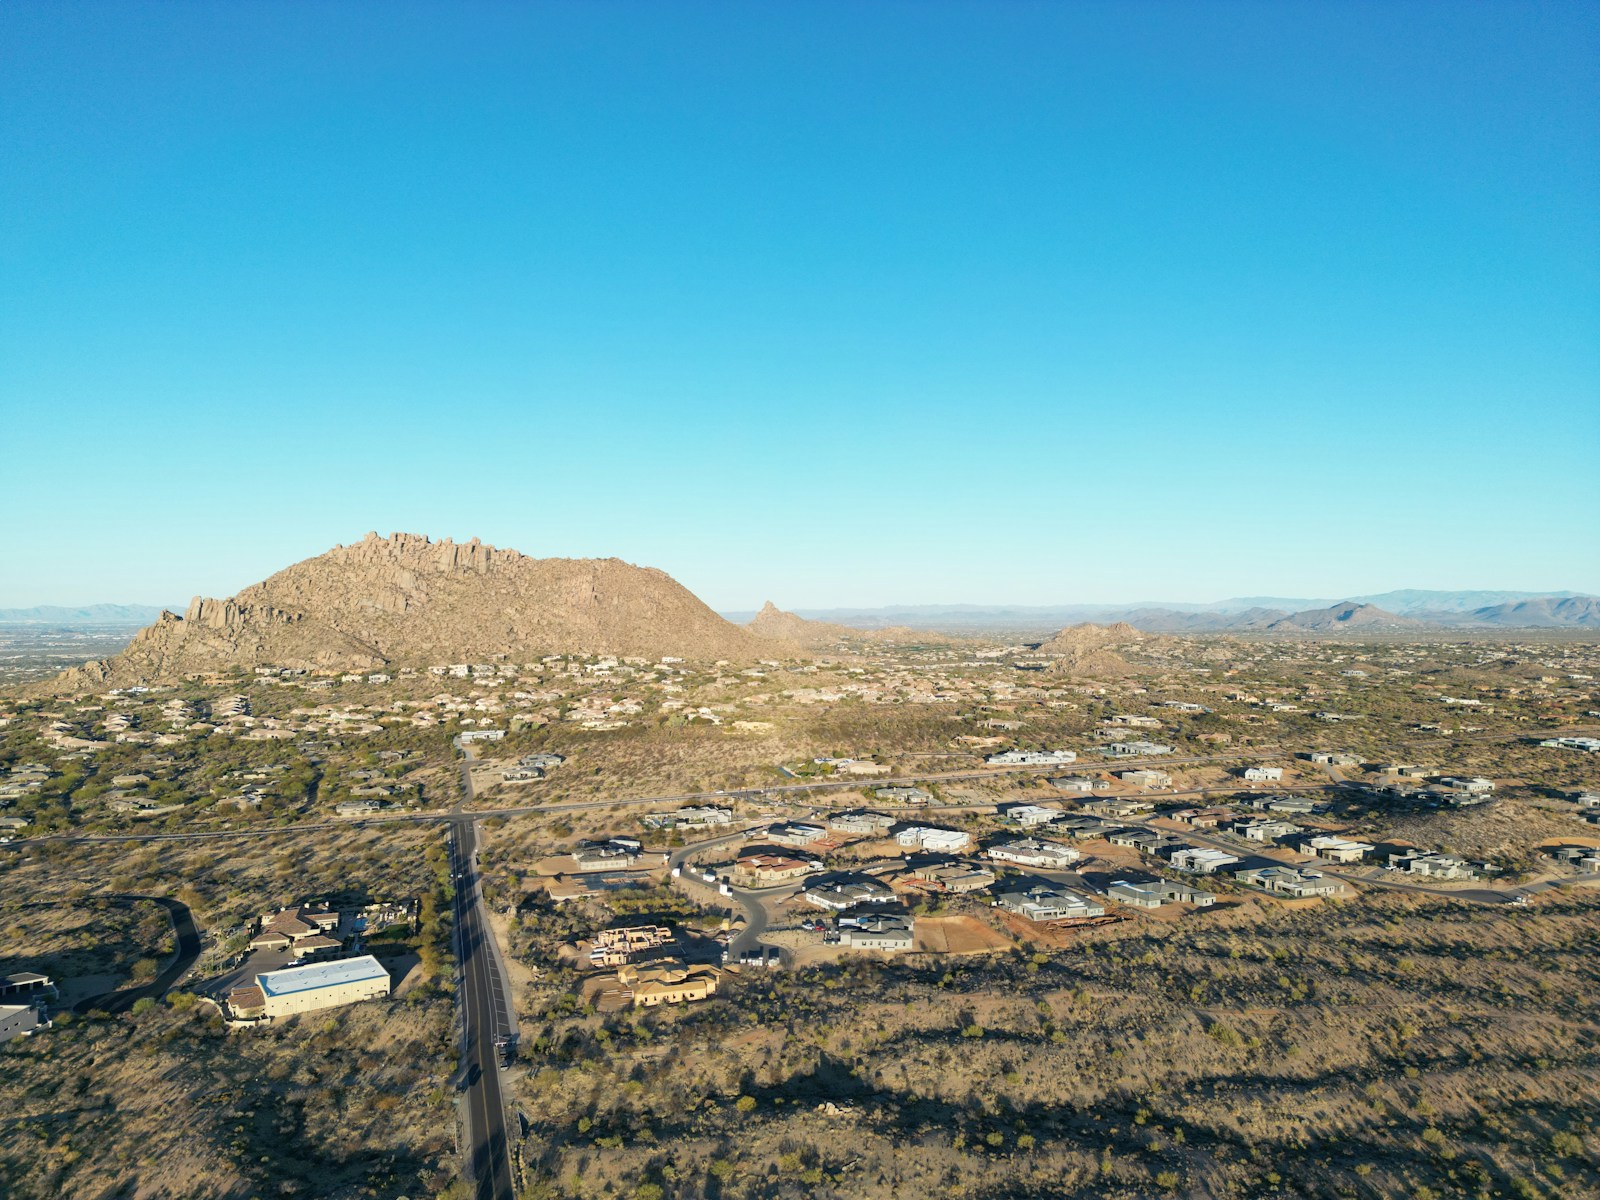
25. Apache Junction, AZ

- Forecast average, May 5-7: 65.6°F (-8.2°F below climate normal)
- Normal average, May 5-7: 73.7°F (2006-2020)
- Total population: 38,855
24. Muncie, IN

- Forecast average, May 5-7: 53.1°F (-8.2°F below climate normal)
- Normal average, May 5-7: 61.3°F (2006-2020)
- Total population: 65,167
23. Cookeville, TN

- Forecast average, May 5-7: 54.6°F (-8.4°F below climate normal)
- Normal average, May 5-7: 63.0°F (2006-2020)
- Total population: 34,967
22. Phoenix, AZ

- Forecast average, May 5-7: 66.4°F (-8.4°F below climate normal)
- Normal average, May 5-7: 74.8°F (2006-2020)
- Total population: 1,609,456
21. Chattanooga, TN

- Forecast average, May 5-7: 59.0°F (-8.4°F below climate normal)
- Normal average, May 5-7: 67.4°F (2006-2020)
- Total population: 181,288
20. Scottsdale, AZ
- Forecast average, May 5-7: 62.5°F (-8.5°F below climate normal)
- Normal average, May 5-7: 71.0°F (2006-2020)
- Total population: 240,537
19. Lexington-Fayette, KY

- Forecast average, May 5-7: 54.5°F (-8.5°F below climate normal)
- Normal average, May 5-7: 63.0°F (2006-2020)
- Total population: 321,276
18. Gadsden, AL

- Forecast average, May 5-7: 59.4°F (-8.6°F below climate normal)
- Normal average, May 5-7: 67.9°F (2006-2020)
- Total population: 33,881
17. Athens, AL

- Forecast average, May 5-7: 59.0°F (-8.7°F below climate normal)
- Normal average, May 5-7: 67.7°F (2006-2020)
- Total population: 26,179
16. Hopkinsville, KY

- Forecast average, May 5-7: 55.6°F (-8.8°F below climate normal)
- Normal average, May 5-7: 64.4°F (2006-2020)
- Total population: 31,042
15. Henderson, KY

- Forecast average, May 5-7: 54.6°F (-8.8°F below climate normal)
- Normal average, May 5-7: 63.4°F (2006-2020)
- Total population: 28,166
14. Frankfort, KY

- Forecast average, May 5-7: 54.4°F (-8.8°F below climate normal)
- Normal average, May 5-7: 63.2°F (2006-2020)
- Total population: 28,460
13. Bullhead City, AZ

- Forecast average, May 5-7: 68.4°F (-9.0°F below climate normal)
- Normal average, May 5-7: 77.4°F (2006-2020)
- Total population: 41,593
12. Clarksville, TN

- Forecast average, May 5-7: 56.2°F (-9.1°F below climate normal)
- Normal average, May 5-7: 65.3°F (2006-2020)
- Total population: 167,882
11. Peoria, AZ

- Forecast average, May 5-7: 64.7°F (-9.3°F below climate normal)
- Normal average, May 5-7: 74.0°F (2006-2020)
- Total population: 191,292
10. Huntsville, AL
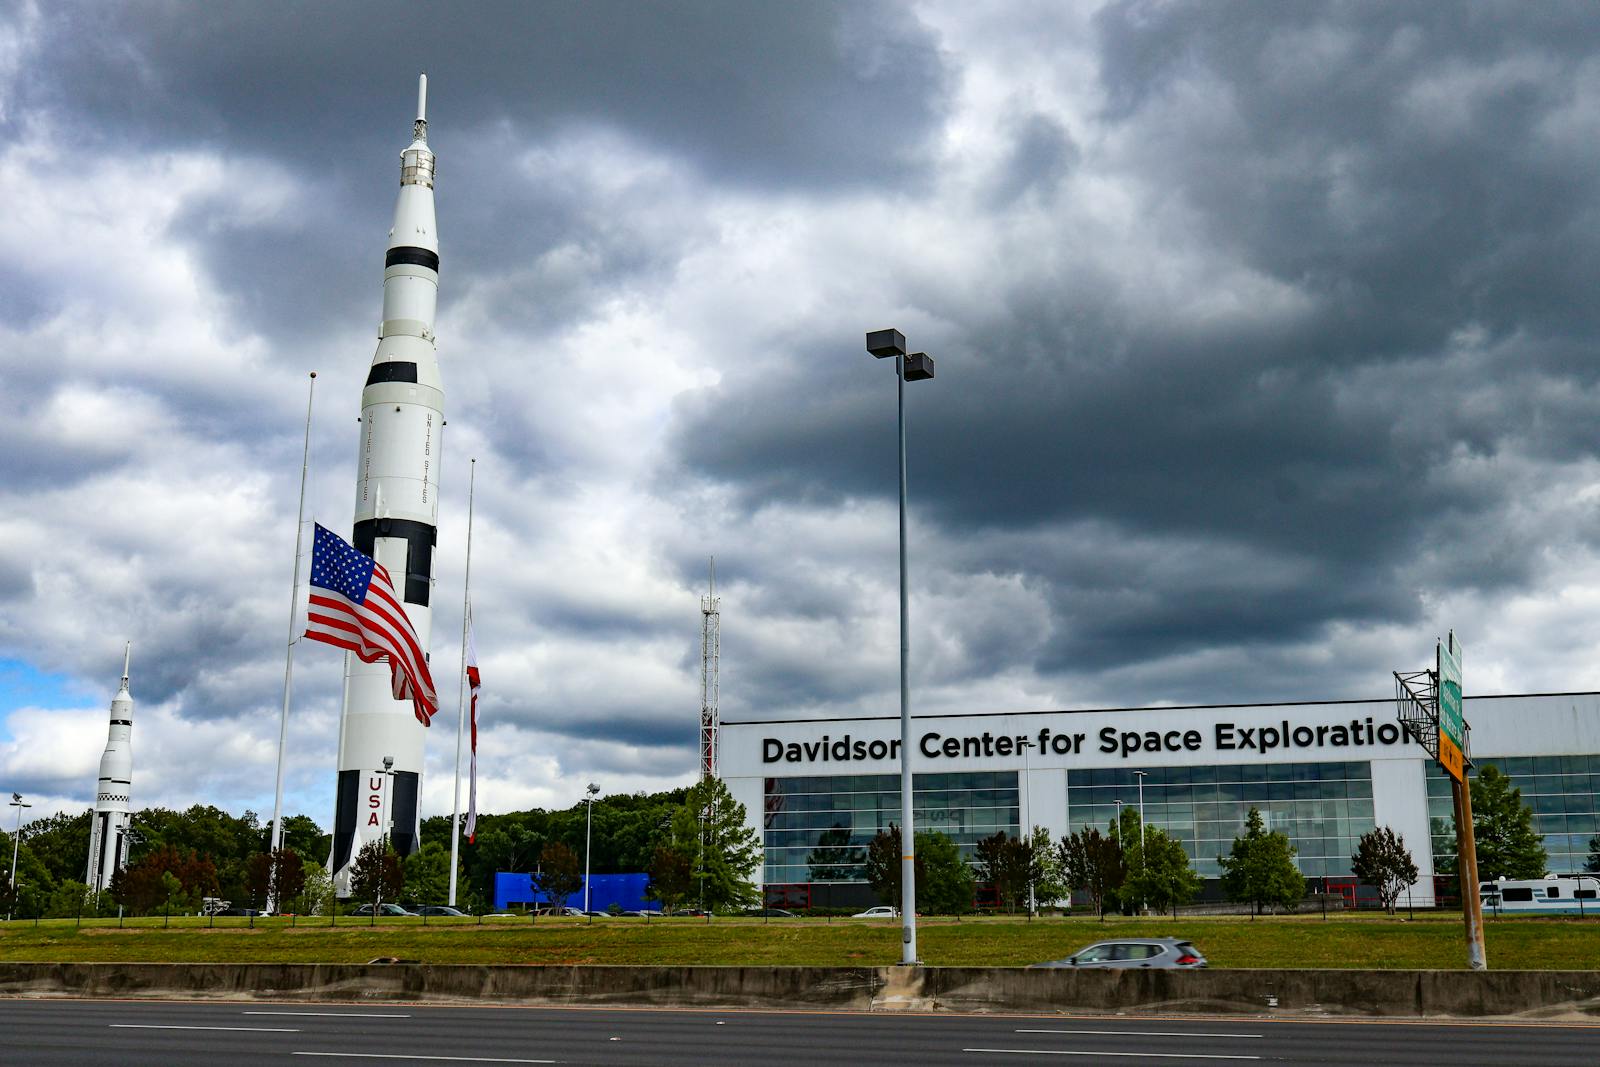
- Forecast average, May 5-7: 59.2°F (-9.3°F below climate normal)
- Normal average, May 5-7: 68.4°F (2006-2020)
- Total population: 215,025
9. Prescott, AZ

- Forecast average, May 5-7: 47.2°F (-9.8°F below climate normal)
- Normal average, May 5-7: 56.9°F (2006-2020)
- Total population: 46,054
8. Sierra Vista, AZ

- Forecast average, May 5-7: 54.2°F (-9.8°F below climate normal)
- Normal average, May 5-7: 64.1°F (2006-2020)
- Total population: 45,212
7. Bowling Green, KY

- Forecast average, May 5-7: 55.4°F (-9.9°F below climate normal)
- Normal average, May 5-7: 65.3°F (2006-2020)
- Total population: 72,385
6. Louisville/Jefferson County, KY

- Forecast average, May 5-7: 54.4°F (-10.1°F below climate normal)
- Normal average, May 5-7: 64.5°F (2006-2020)
- Total population: 629,176
5. Casa Grande, AZ

- Forecast average, May 5-7: 65.0°F (-10.3°F below climate normal)
- Normal average, May 5-7: 75.3°F (2006-2020)
- Total population: 55,186
4. Evansville, IN

- Forecast average, May 5-7: 54.7°F (-10.6°F below climate normal)
- Normal average, May 5-7: 65.3°F (2006-2020)
- Total population: 116,906
3. Terre Haute, IN

- Forecast average, May 5-7: 53.1°F (-10.6°F below climate normal)
- Normal average, May 5-7: 63.7°F (2006-2020)
- Total population: 58,599
2. Tucson, AZ
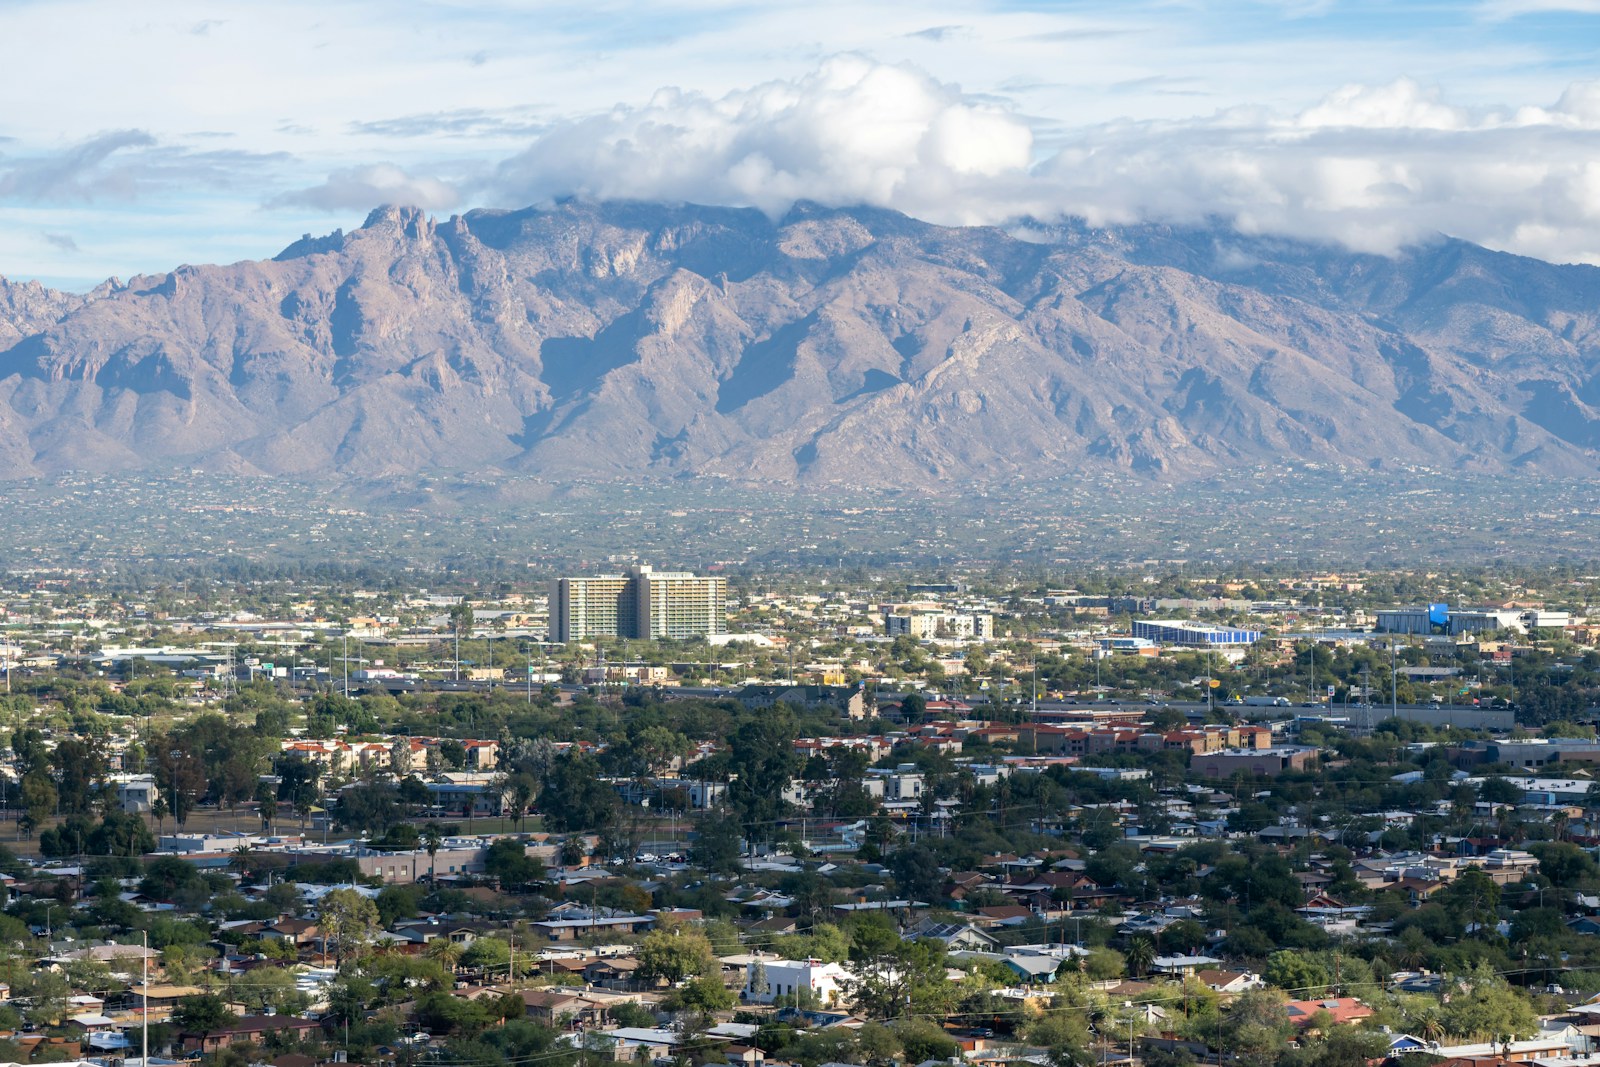
- Forecast average, May 5-7: 62.0°F (-11.2°F below climate normal)
- Normal average, May 5-7: 73.2°F (2006-2020)
- Total population: 541,033
1. Palm Springs, CA

- Forecast average, May 5-7: 66.4°F (-11.4°F below climate normal)
- Normal average, May 5-7: 77.8°F (2006-2020)
- Total population: 44,935
More from ClimateCrisis 247
- From Forest to Desert, These Are The Cities That Will Look Completely Different by 2080
- Here’s How Donald Trump Is Hurting the Environment, Reversing Decades of Bipartisan Progress
- States at Highest Risk For a Major Hurricane in 2025
- A Rare Weather Pattern Is Trapping These Cities This Week With Days Of Rain