See Where Chantal Caused the Worst Flooding
 https://climate-crisis-247-bucket.nyc3.cdn.digitaloceanspaces.com/wp-content/uploads/2025/07/07213027/8602955-150x150.jpg
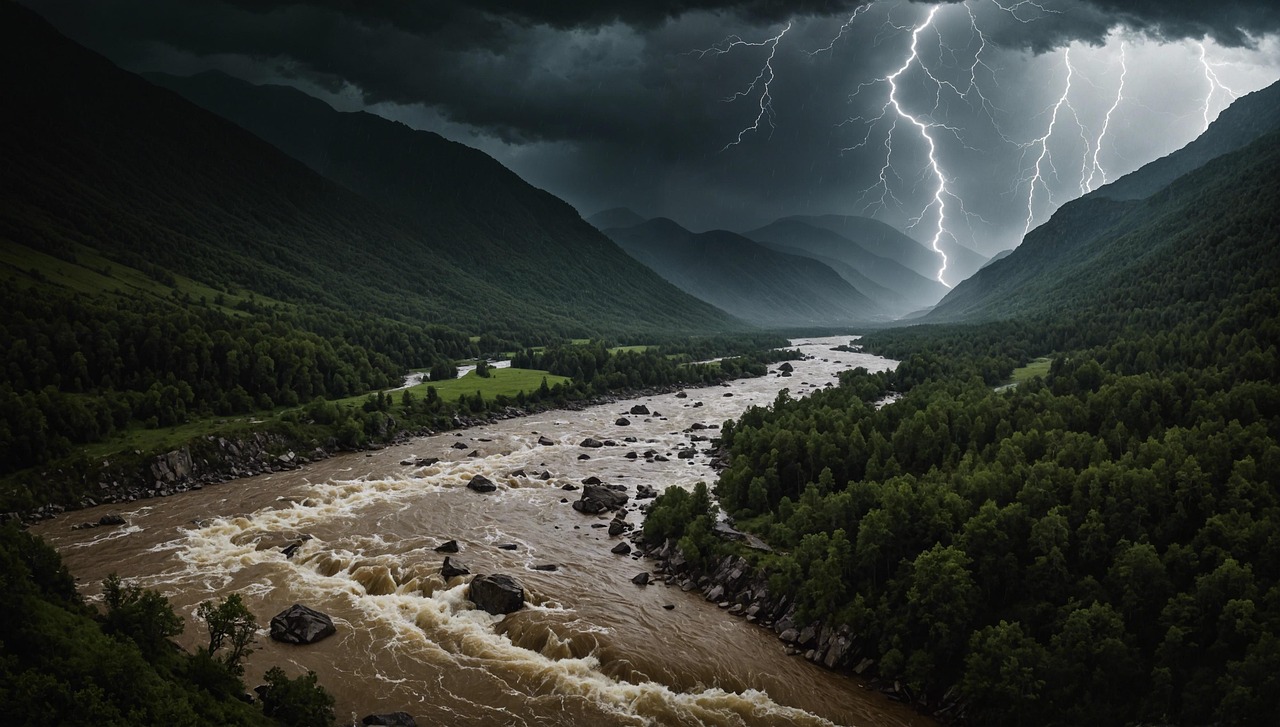
On Sunday, tropical storm Chantal made landfall in South Carolina. While the storm quickly weakened to a tropical depression, Chantal delivered more than 10 inches of rain as it moved inland, soaking cities from North Carolina to Virginia.
Hot property? From Maui to Malibu, These Affluent Enclaves Are Becoming Wildfire Hotspots
Hold on to your hats! The U.S. Counties Getting Windier Every Year
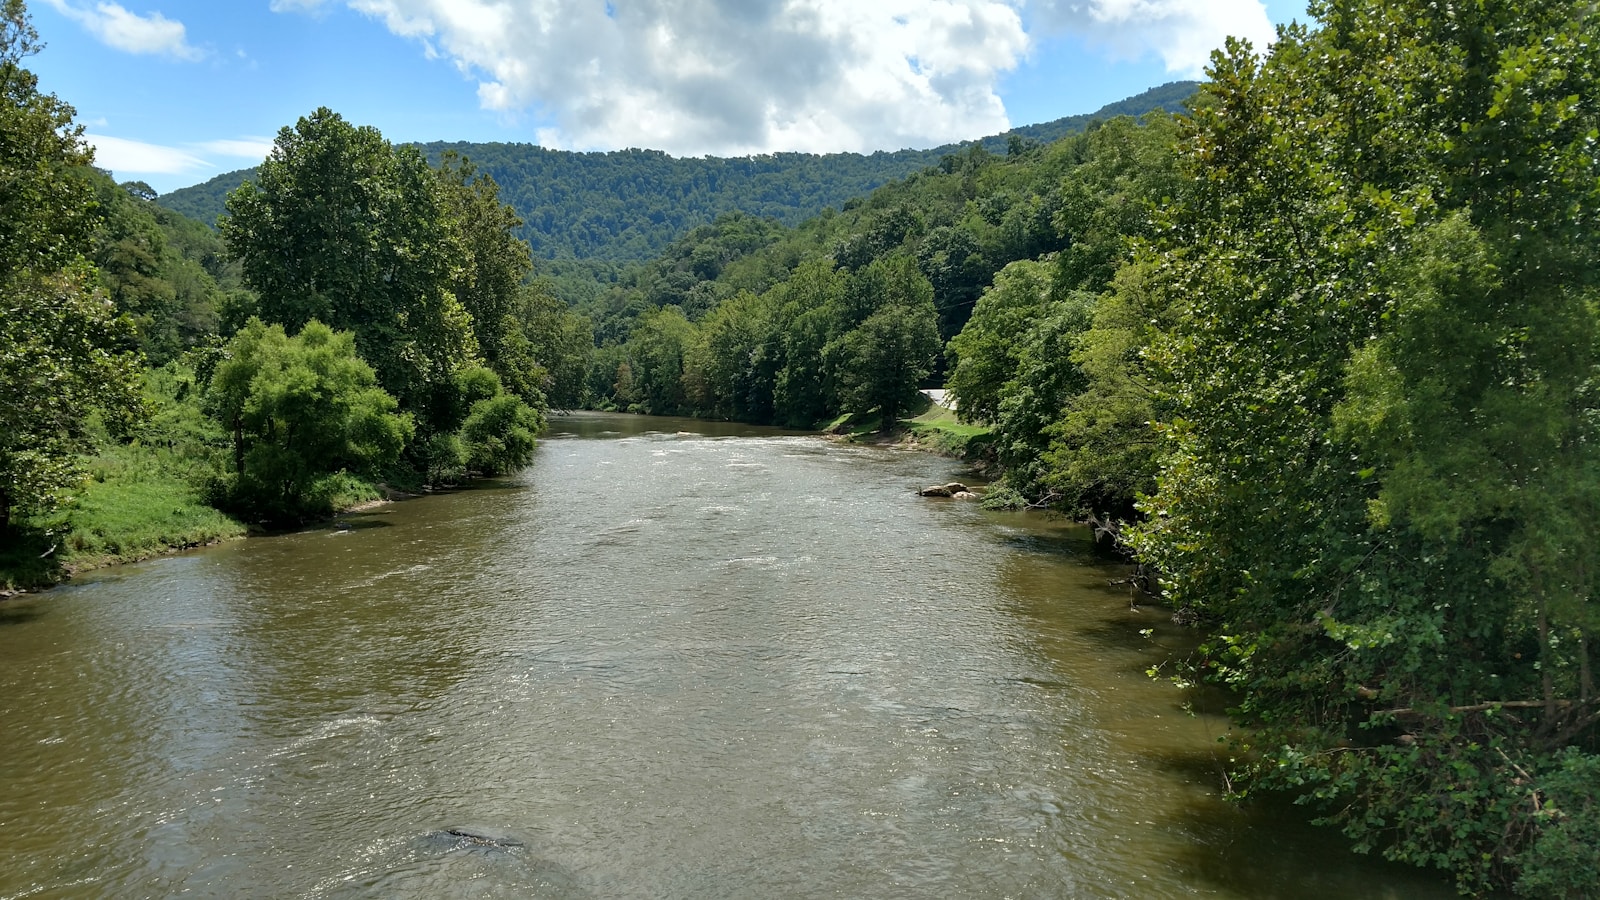
The storm’s deluge has swollen rivers and creeks to near-historic highs, necessitating evacuations and rescue efforts and causing widespread power outages. In several central North Carolina communities, water levels are more than five feet above flood thresholds, threatening thousands of homes. A closer look at the data reveals the cities where flooding is the worst right now.
To determine the cities where flooding is the worst right now, Climate Crisis 247 reviewed data on flood inundation from the NOAA’s Office of Water Prediction. Waterbody monitoring stations were ranked based on the difference between current water levels and defined flooding thresholds. Data on current flooding are based on observations for July 7, 2025. Waterbody monitoring stations were matched to cities using Census Bureau boundary definitions.
10. Lumberton, NC (Lumber River)
- Current water level: 14.6 feet (+1.6 feet above flooding threshold)
- Flooding threshold: 13.0 feet
- City population: 19,099
9. Angier, NC (Cape Fear River)
- Current water level: 15.8 feet (+1.8 feet above flooding threshold)
- Flooding threshold: 14.0 feet
- City population: 5,348
8. Montevideo, MN (Minnesota River)
- Current water level: 17.0 feet (+3.0 feet above flooding threshold)
- Flooding threshold: 14.0 feet
- City population: 5,350
7. Sanford, NC (Deep River)
- Current water level: 12.2 feet (+3.2 feet above flooding threshold)
- Flooding threshold: 9.0 feet
- City population: 30,373
6. Redwood Falls, MN (Minnesota River)
- Current water level: 24.6 feet (+3.6 feet above flooding threshold)
- Flooding threshold: 21.0 feet
- City population: 5,091
5. Searcy, AR (White River)
- Current water level: 30.7 feet (+4.7 feet above flooding threshold)
- Flooding threshold: 26.0 feet
- City population: 22,961
4. Elizabeth City, NC (Pasquotank River)
- Current water level: 7.9 feet (+6.2 feet above flooding threshold)
- Flooding threshold: 1.8 feet
- City population: 18,570
3. Chapel Hill, NC (Morgan Creek)

- Current water level: 17.3 feet (+6.3 feet above flooding threshold)
- Flooding threshold: 11.0 feet
- City population: 58,919
2. Durham, NC (Eno River)
- Current water level: 20.0 feet (+8.0 feet above flooding threshold)
- Flooding threshold: 12.0 feet
- City population: 284,094
1. Graham, NC (Haw River)
- Current water level: 27.0 feet (+9.0 feet above flooding threshold)
- Flooding threshold: 18.0 feet
- City population: 17,136