Temperatures Have Soared This Year in These US Cities
 https://climate-crisis-247-bucket.nyc3.cdn.digitaloceanspaces.com/wp-content/uploads/2025/08/07204229/1853442-150x150.jpg
Throughout the summer, much of the country suffered through prolonged heatwaves that posed a real threat to public health and, in some places, exacerbated severe drought conditions. According to the National Oceanic and Atmospheric Administration, the average temperature in the continental United States in July 2025 was 75.4°F, nearly 2°F above the baseline July average, and only about 1.4°F below the all-time high for the month, reported in 1936.
In many places, above average temperatures this summer were the continuation of a longer-term trend, as atmospheric conditions were also milder than normal in the spring and winter months. Data from NOAA shows that the average temperature across the continental United States so far in 2025 has been 53.3°F, meaningfully higher than the 51.3°F baseline average of the same months over the 100 years between 1901 and 2000.
At the local level, abnormally high temperatures impacted millions of Americans, as in most cities tracked by NOAA across the Lower 48, average temperatures so far in 2025 were above the local baseline average. In over a dozen of these places, the average temperature between January and July 2025 exceeded the baseline average by more than 1.5°F.
Using data from the National Atmospheric and Oceanic Administration, Climate Crisis 247 identified the U.S. cities where temperatures have been well above average so far this year. We reviewed data for over 200 cities, towns, and places in the U.S. and ranked them on the difference between the average local temperature between January and July, and the average local temperature over the same period in 2025. Only places where average temperatures exceed the baseline by more than 1.5°F are listed. Baseline temperatures, as classified by NOAA, are average temperatures over the months of January through July each year from 1991 through 2020. It is important to note that, due to rounding, the 2025 temperature anomalies reported in this story may not reflect the precise difference from the noted baseline averages.
22. Bridgeport, Connecticut

- Average temperature in 2025 compared to baseline: 1.6°F above avg.
- Average local temperature, January-July 2025: 52.7°F
- Baseline average local temperature (January-July 1991-2020): 51.0°F
- Local population: 148,012
21. Salisbury, Maryland

- Average temperature in 2025 compared to baseline: 1.6°F above avg.
- Average local temperature, January-July 2025: 57.2°F
- Baseline average local temperature (January-July 1991-2020): 55.6°F
- Local population: 33,080
20. Nashville, Tennessee

- Average temperature in 2025 compared to baseline: 1.6°F above avg.
- Average local temperature, January-July 2025: 62.1°F
- Baseline average local temperature (January-July 1991-2020): 60.5°F
- Local population: 684,298
19. Montpelier, Vermont
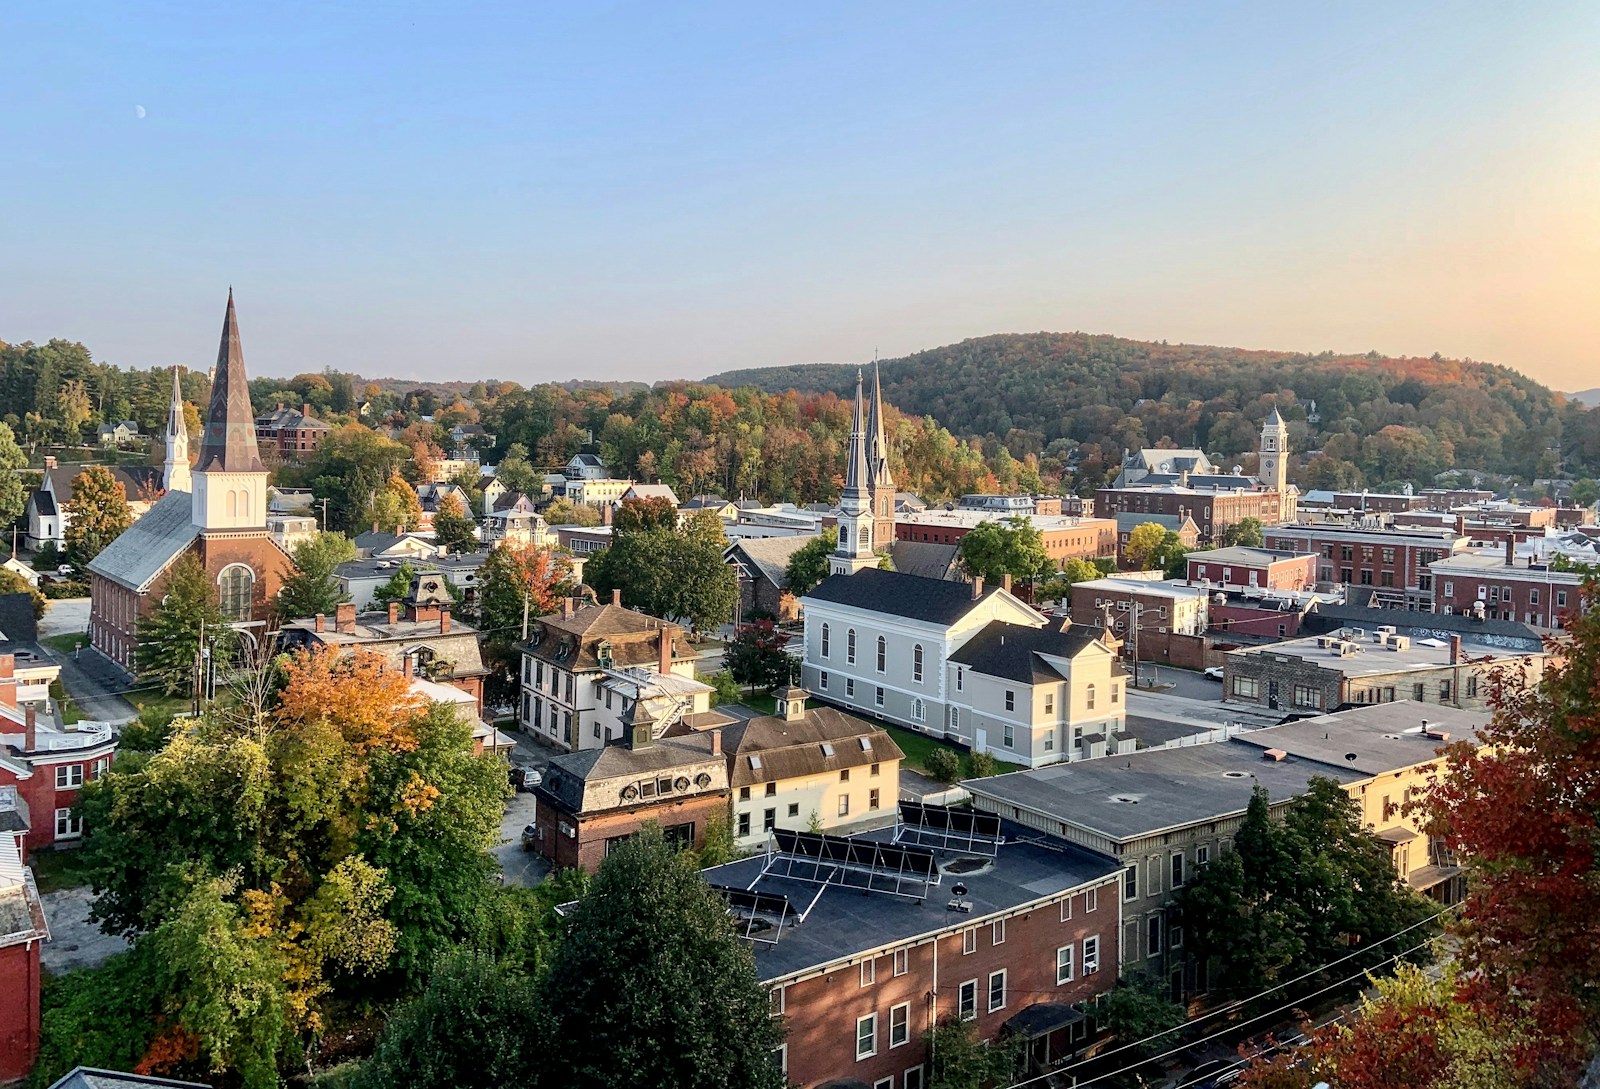
- Average temperature in 2025 compared to baseline: 1.7°F above avg.
- Average local temperature, January-July 2025: 42.8°F
- Baseline average local temperature (January-July 1991-2020): 41.1°F
- Local population: 8,038
18. Burlington, Vermont

- Average temperature in 2025 compared to baseline: 1.7°F above avg.
- Average local temperature, January-July 2025: 47.3°F
- Baseline average local temperature (January-July 1991-2020): 45.6°F
- Local population: 44,649
17. Dubuque, Iowa

- Average temperature in 2025 compared to baseline: 1.7°F above avg.
- Average local temperature, January-July 2025: 47.9°F
- Baseline average local temperature (January-July 1991-2020): 46.3°F
- Local population: 59,271
16. Allentown, Pennsylvania

- Average temperature in 2025 compared to baseline: 1.7°F above avg.
- Average local temperature, January-July 2025: 51.9°F
- Baseline average local temperature (January-July 1991-2020): 50.2°F
- Local population: 125,320
15. Washington (Dulles), Virginia

- Average temperature in 2025 compared to baseline: 1.7°F above avg.
- Average local temperature, January-July 2025: 56.6°F
- Baseline average local temperature (January-July 1991-2020): 54.9°F
- Local population: N/A
14. Charlotte, North Carolina

- Average temperature in 2025 compared to baseline: 1.7°F above avg.
- Average local temperature, January-July 2025: 63.6°F
- Baseline average local temperature (January-July 1991-2020): 62.0°F
- Local population: 886,283
13. Jackson, Mississippi

- Average temperature in 2025 compared to baseline: 1.7°F above avg.
- Average local temperature, January-July 2025: 67.4°F
- Baseline average local temperature (January-July 1991-2020): 65.7°F
- Local population: 149,827
12. West Palm Beach, Florida

- Average temperature in 2025 compared to baseline: 1.7°F above avg.
- Average local temperature, January-July 2025: 76.6°F
- Baseline average local temperature (January-July 1991-2020): 74.9°F
- Local population: 119,508
11. Mt. Washington, New Hampshire

- Average temperature in 2025 compared to baseline: 1.8°F above avg.
- Average local temperature, January-July 2025: 27.3°F
- Baseline average local temperature (January-July 1991-2020): 25.5°F
- Local population: N/A
10. New Orleans, Louisiana

- Average temperature in 2025 compared to baseline: 1.8°F above avg.
- Average local temperature, January-July 2025: 71.4°F
- Baseline average local temperature (January-July 1991-2020): 69.6°F
- Local population: 376,035
9. Williamsport, Pennsylvania

- Average temperature in 2025 compared to baseline: 1.9°F above avg.
- Average local temperature, January-July 2025: 52.1°F
- Baseline average local temperature (January-July 1991-2020): 50.3°F
- Local population: 27,629
8. Atlantic City, New Jersey

- Average temperature in 2025 compared to baseline: 1.9°F above avg.
- Average local temperature, January-July 2025: 55.1°F
- Baseline average local temperature (January-July 1991-2020): 53.2°F
- Local population: 38,486
7. Elko, Nevada

- Average temperature in 2025 compared to baseline: 2.0°F above avg.
- Average local temperature, January-July 2025: 49.5°F
- Baseline average local temperature (January-July 1991-2020): 47.5°F
- Local population: 20,624
6. Grand Junction, Colorado

- Average temperature in 2025 compared to baseline: 2.0°F above avg.
- Average local temperature, January-July 2025: 56.4°F
- Baseline average local temperature (January-July 1991-2020): 54.4°F
- Local population: 67,027
5. Ely, Nevada

- Average temperature in 2025 compared to baseline: 2.1°F above avg.
- Average local temperature, January-July 2025: 47.1°F
- Baseline average local temperature (January-July 1991-2020): 45.0°F
- Local population: 3,941
4. Atlanta, Georgia

- Average temperature in 2025 compared to baseline: 2.1°F above avg.
- Average local temperature, January-July 2025: 65.1°F
- Baseline average local temperature (January-July 1991-2020): 63.0°F
- Local population: 499,287
3. Raleigh, North Carolina

- Average temperature in 2025 compared to baseline: 2.2°F above avg.
- Average local temperature, January-July 2025: 64.1°F
- Baseline average local temperature (January-July 1991-2020): 61.9°F
- Local population: 470,763
2. Norfolk, Virginia

- Average temperature in 2025 compared to baseline: 2.4°F above avg.
- Average local temperature, January-July 2025: 61.9°F
- Baseline average local temperature (January-July 1991-2020): 59.5°F
- Local population: 235,037
1. Grand Forks, North Dakota

- Average temperature in 2025 compared to baseline: 2.5°F above avg.
- Average local temperature, January-July 2025: 41.2°F
- Baseline average local temperature (January-July 1991-2020): 38.7°F
- Local population: 58,882