The Cities Where the Fourth of July Will Be Abnormally Hot This Year
 https://climate-crisis-247-bucket.nyc3.cdn.digitaloceanspaces.com/wp-content/uploads/2025/07/07213847/Maximum-temperature-July-4th-2025-150x150.png
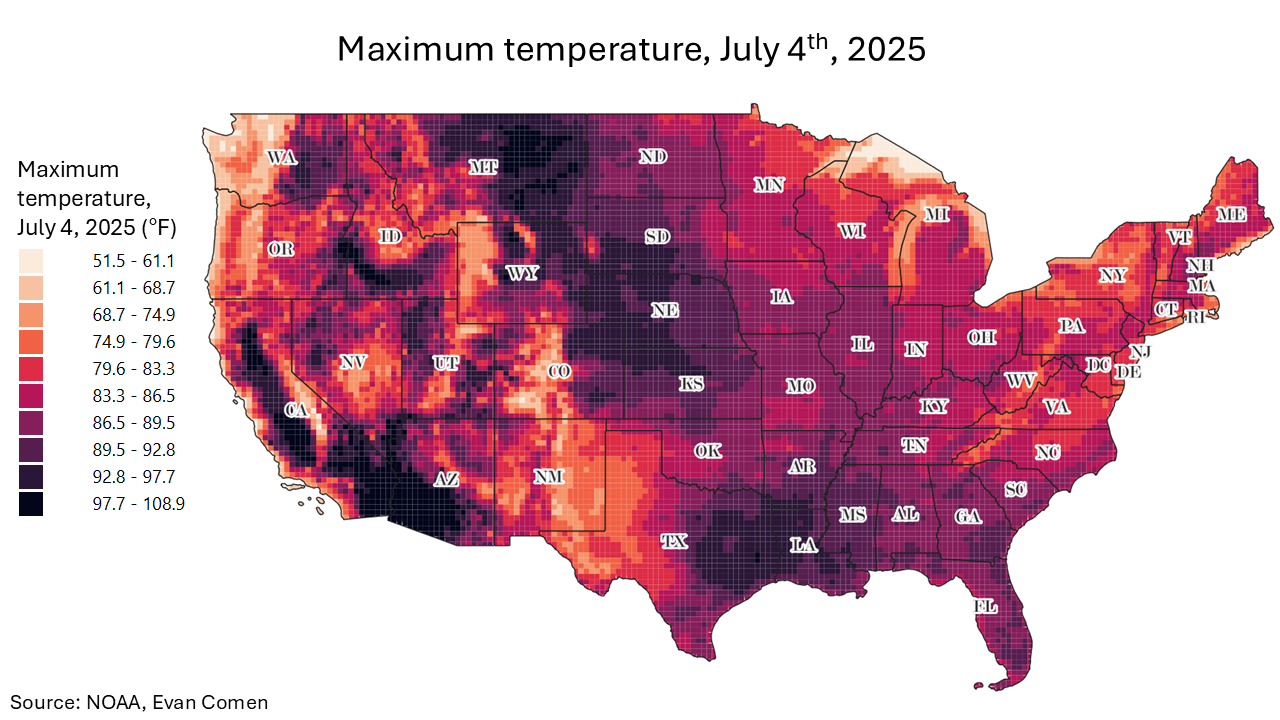
As Americans prepare for cookouts, fireworks, and one of the biggest outdoor days of the year, forecasters are warning of high heat in several major cities. A powerful ridge of high pressure is set to blanket parts of the country with unusually hot temperatures, pushing daily highs well above climate normals for the period. Dozens of communities are forecast to experience Fourth of July heat more than 10°F above historical norms.
Extra charge? The EVs That Could Lose Their $7,500 Tax Credit
Hot property? From Maui to Malibu, These Affluent Enclaves Are Becoming Wildfire Hotspots
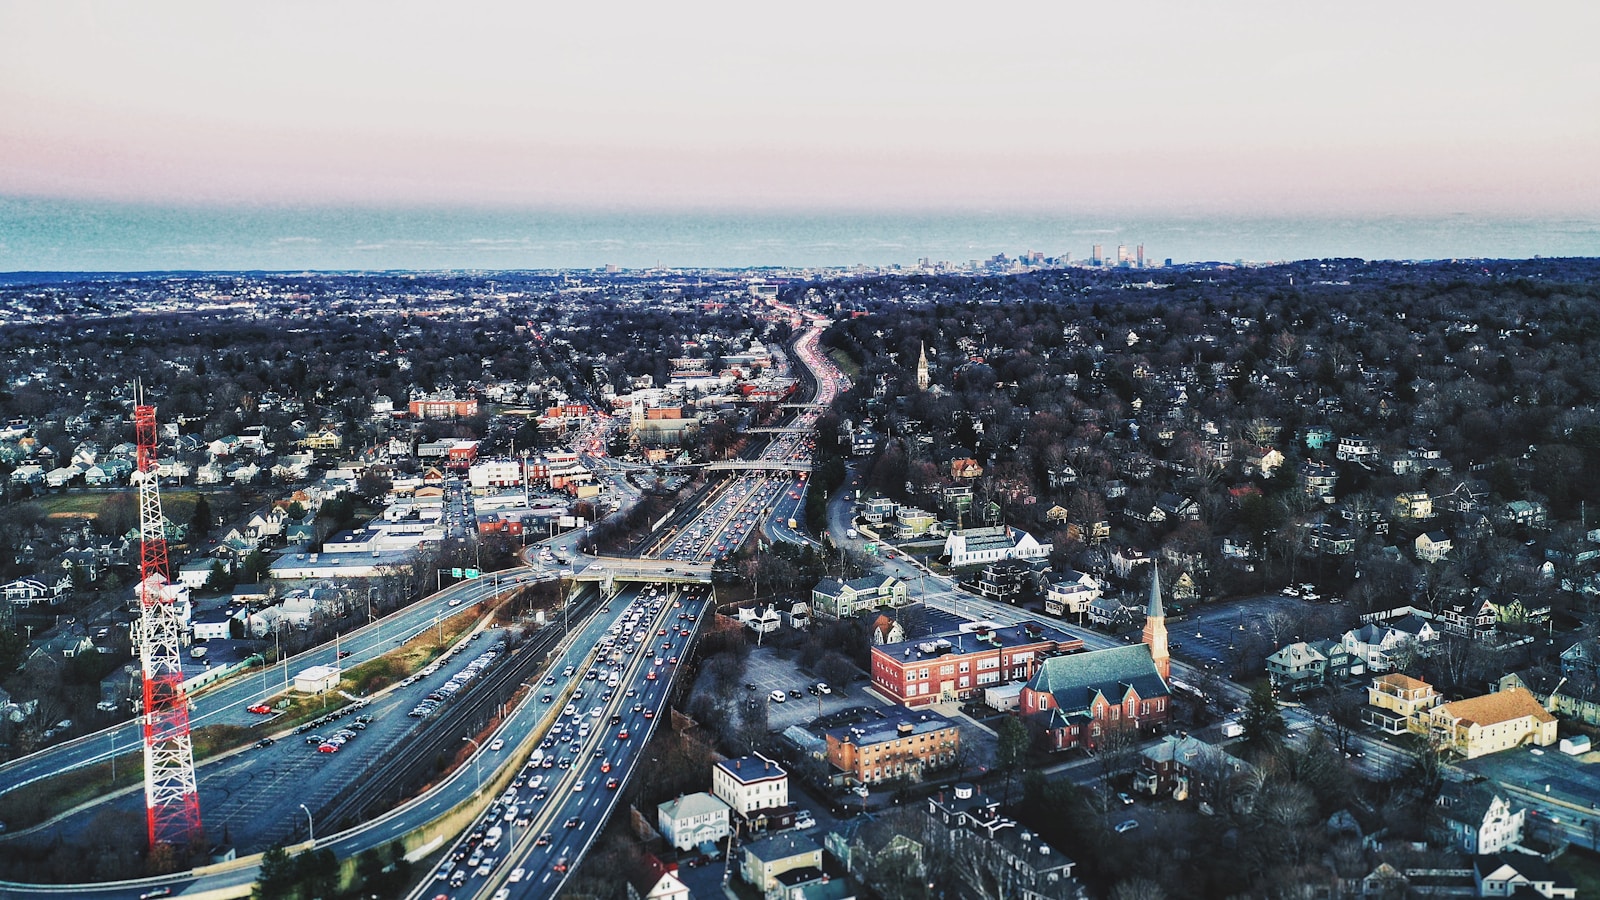
The National Weather Service has issued heat advisories for 31 counties, representing over 600,000 Americans. In some cities, the heat will feel more like mid-July or August than early July, raising the risk of heat-related illness at outdoor holiday gatherings. The biggest clusters of abnormal heat will occur in parts of Massachusetts and California. A closer look at the data reveals the full list of cities where July 4th will be abnormally hot this year.
To determine the cities where it will be abnormally hot this Fourth of July, Climate Crisis 247 reviewed 24-hour maximum temperature forecasts and historical daily temperature normals from the NOAA. Cities were ranked based on the difference between the forecast high temperature for July 4, 2025, and the average observed high for that date from 2006 to 2020. Forecast data are from the National Digital Forecast Database, while historical norms are from the Global Historical Climatology Network Daily program at the National Centers for Environmental Information. Cities were matched to the nearest weather station within 50 miles. Only cities with at least 40,000 residents were considered.
25. Brookline, MA
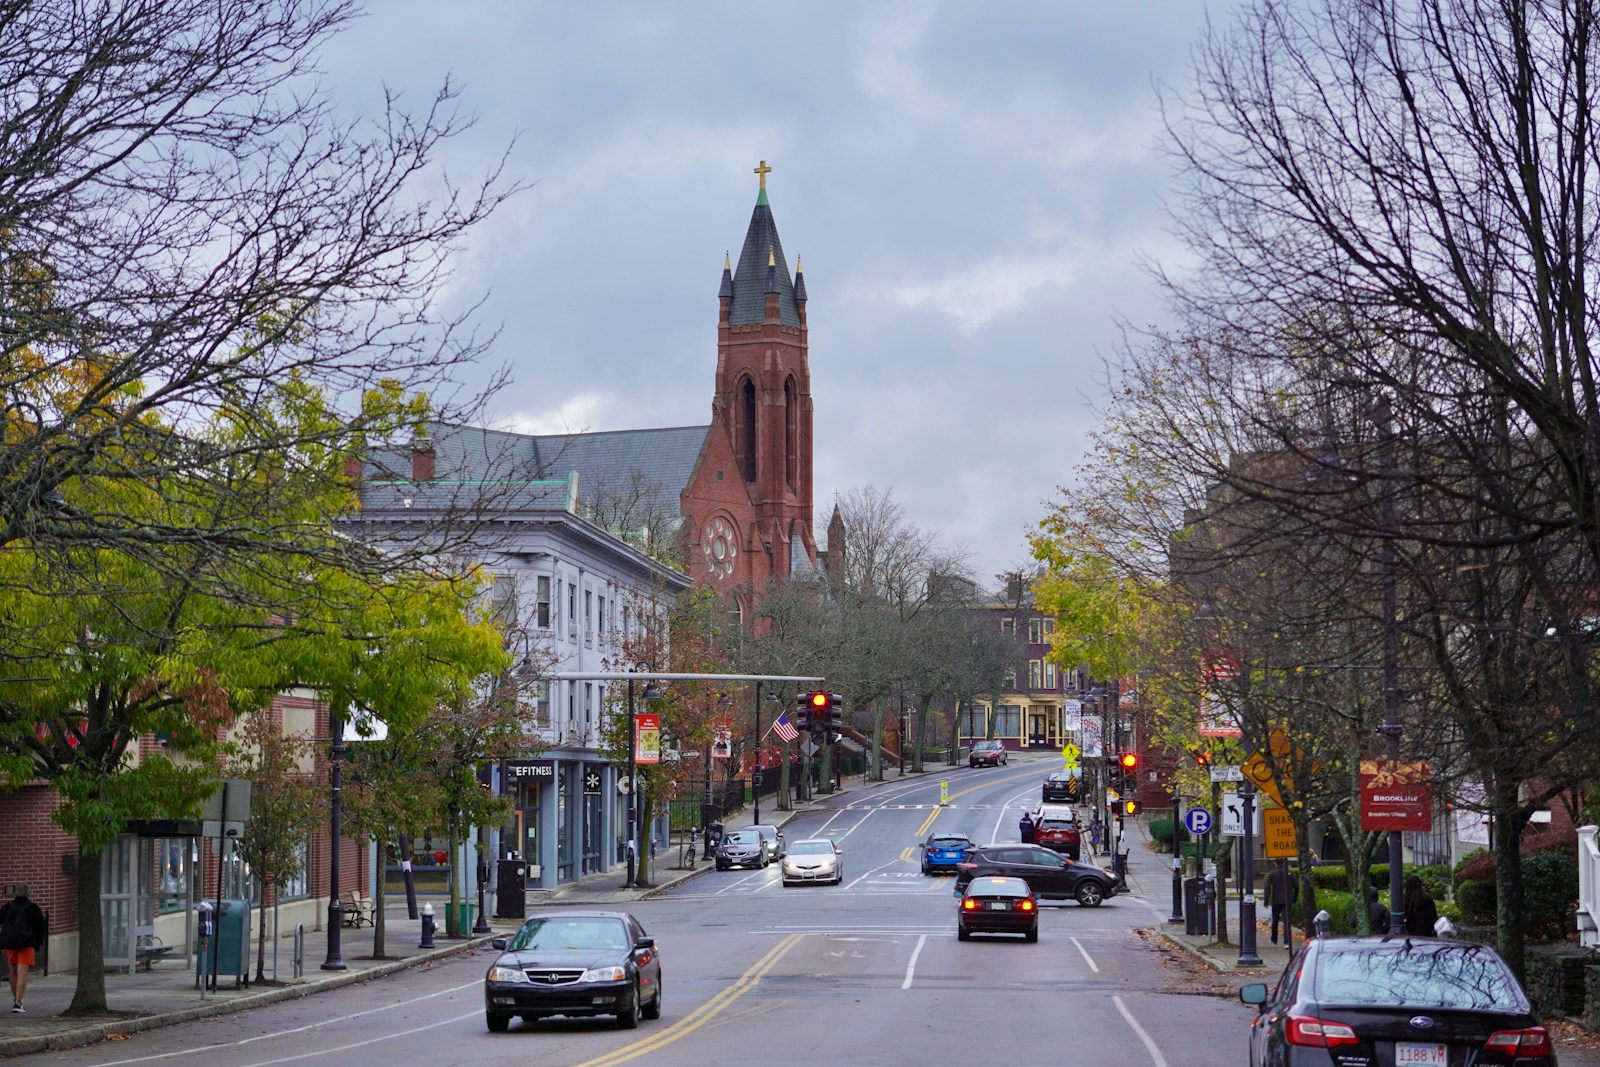
- Forecast maximum, July 4th, 2025: 90.9°F (+9.6°F above climate normal)
- Normal July 4th maximum, 2006-2020: 81.3°F
- Total population: 62,698
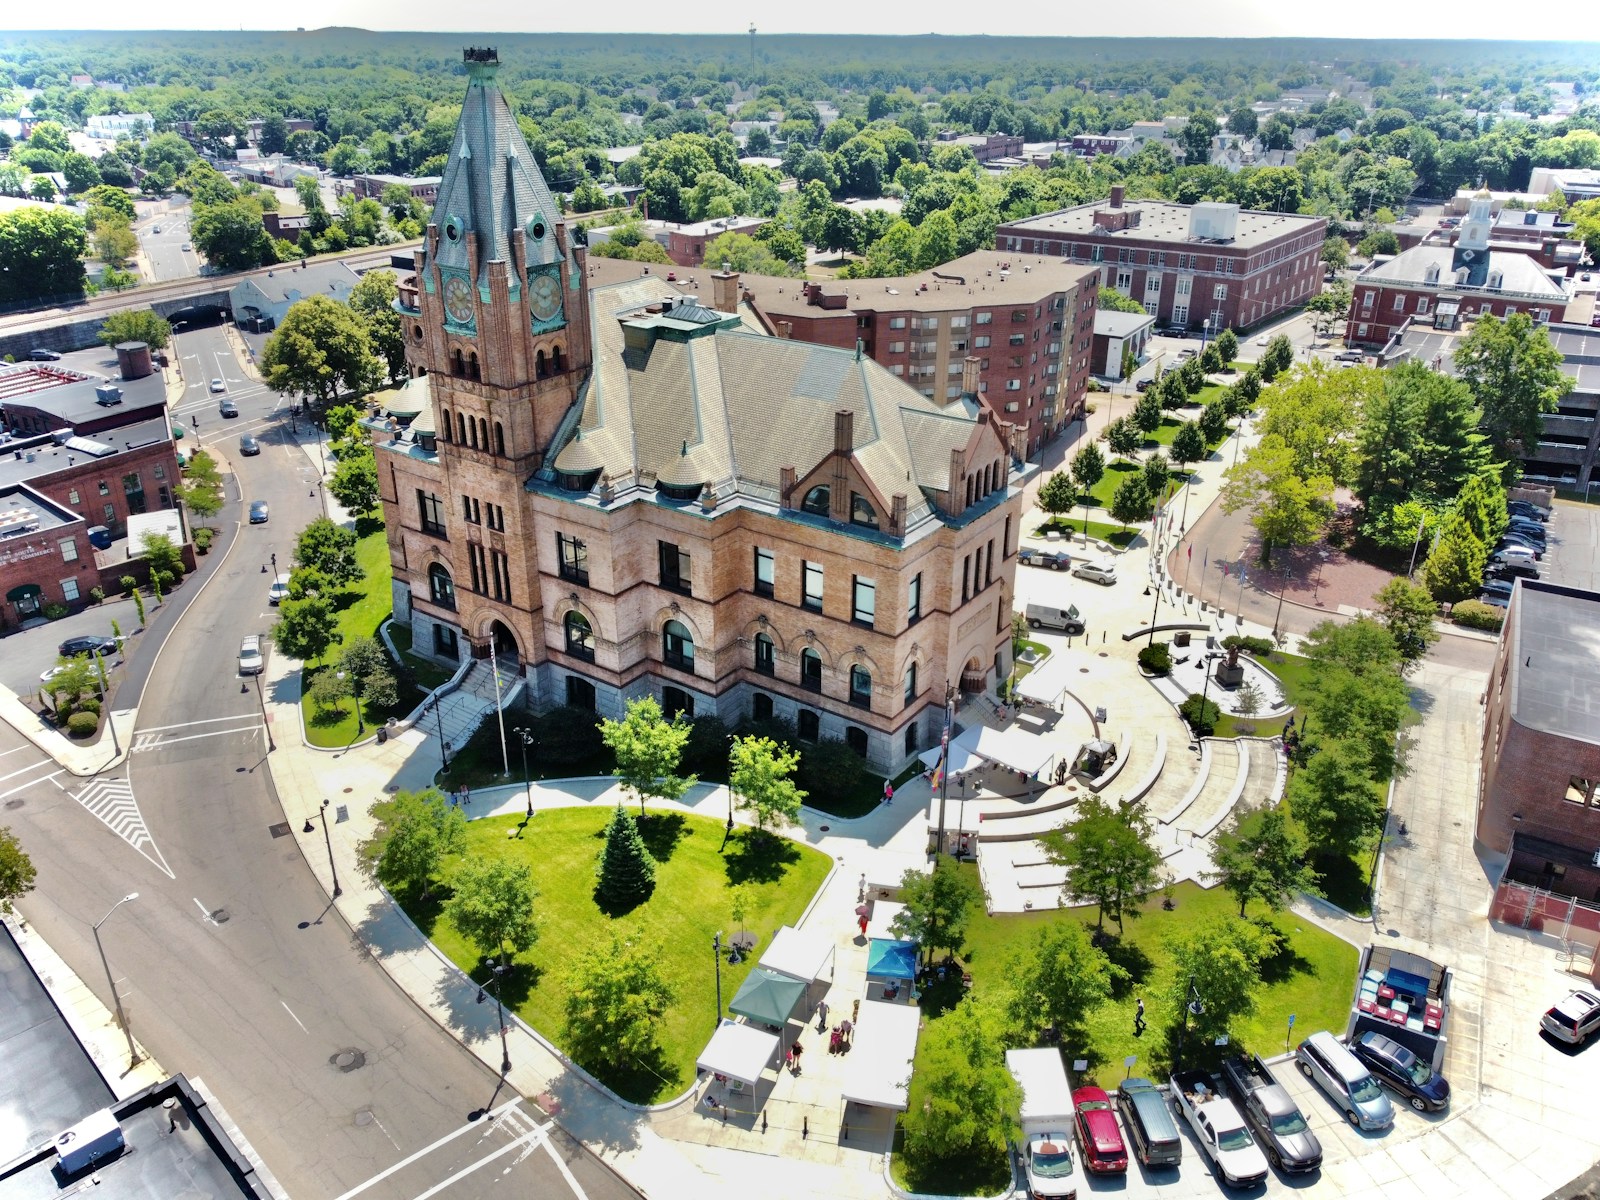
24. Taunton, MA

- Forecast maximum, July 4th, 2025: 91.2°F (+9.7°F above climate normal)
- Normal July 4th maximum, 2006-2020: 81.5°F
- Total population: 59,436
23. Palatine, IL
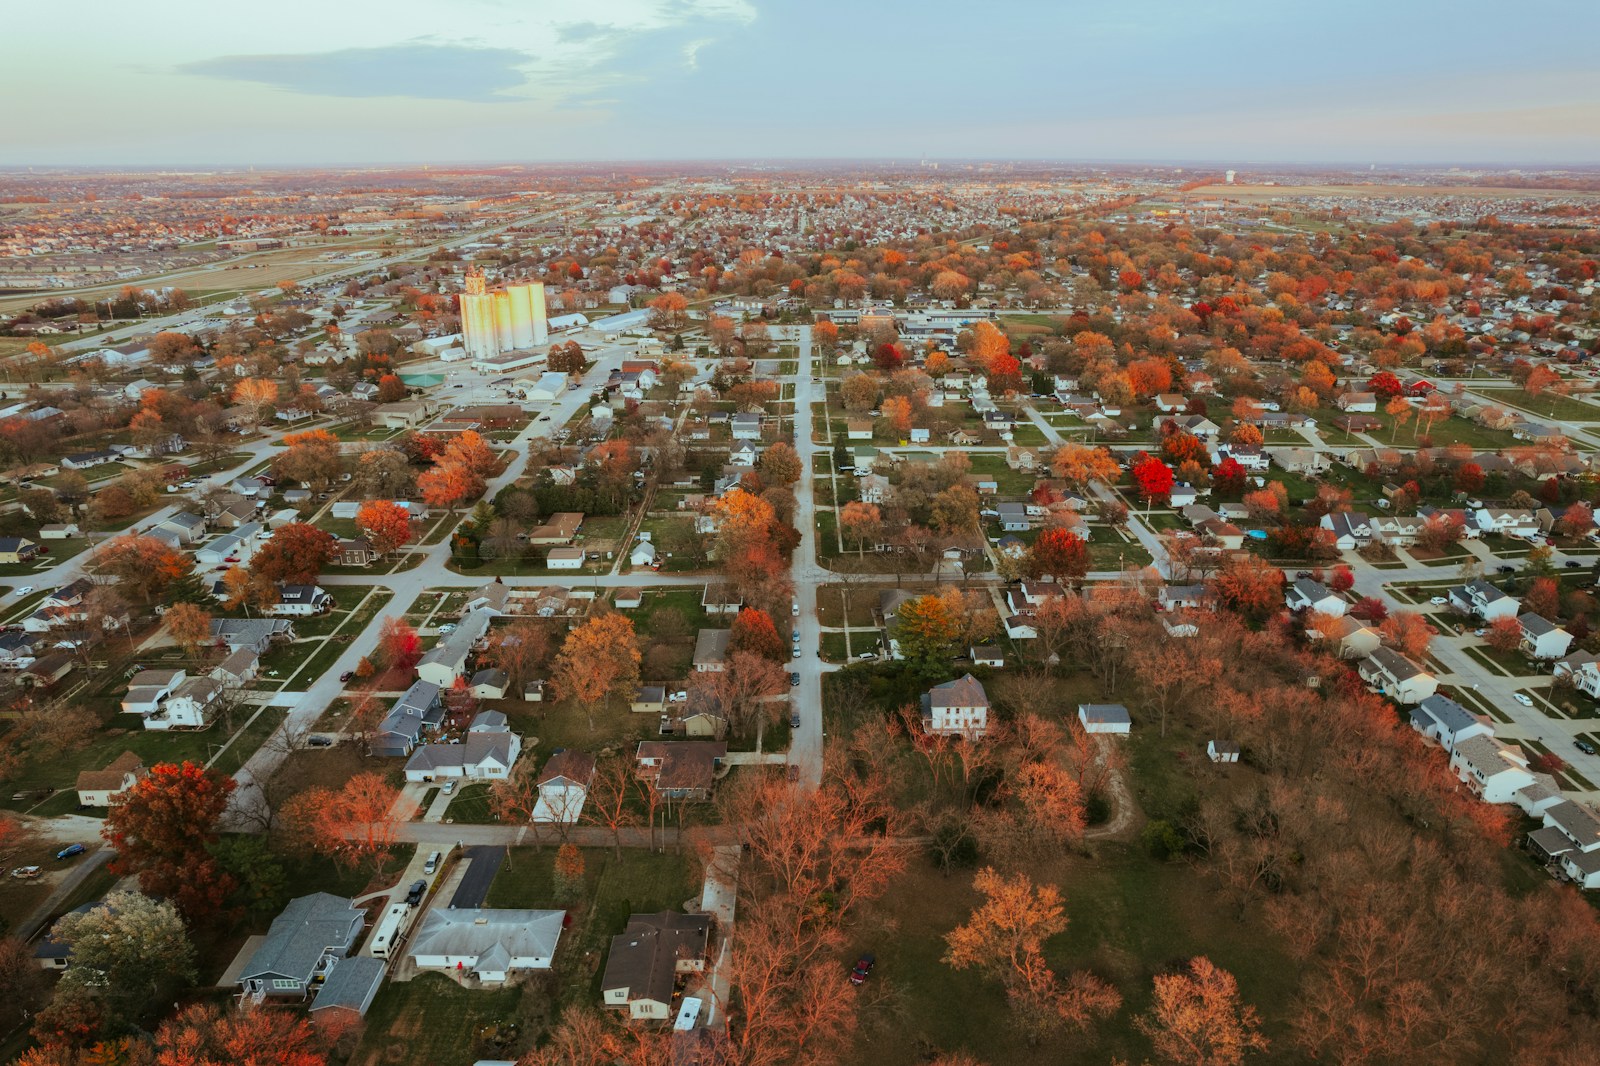
- Forecast maximum, July 4th, 2025: 90.9°F (+9.8°F above climate normal)
- Normal July 4th maximum, 2006-2020: 81.1°F
- Total population: 67,223
22. Schaumburg, IL

- Forecast maximum, July 4th, 2025: 90.9°F (+9.8°F above climate normal)
- Normal July 4th maximum, 2006-2020: 81.1°F
- Total population: 77,571
21. Walnut Creek, CA

- Forecast maximum, July 4th, 2025: 82.8°F (+9.9°F above climate normal)
- Normal July 4th maximum, 2006-2020: 72.9°F
- Total population: 69,809
20. Waltham, MA
- Forecast maximum, July 4th, 2025: 91.3°F (+10.0°F above climate normal)
- Normal July 4th maximum, 2006-2020: 81.3°F
- Total population: 64,711
19. Arlington, MA

- Forecast maximum, July 4th, 2025: 91.5°F (+10.2°F above climate normal)
- Normal July 4th maximum, 2006-2020: 81.3°F
- Total population: 45,906
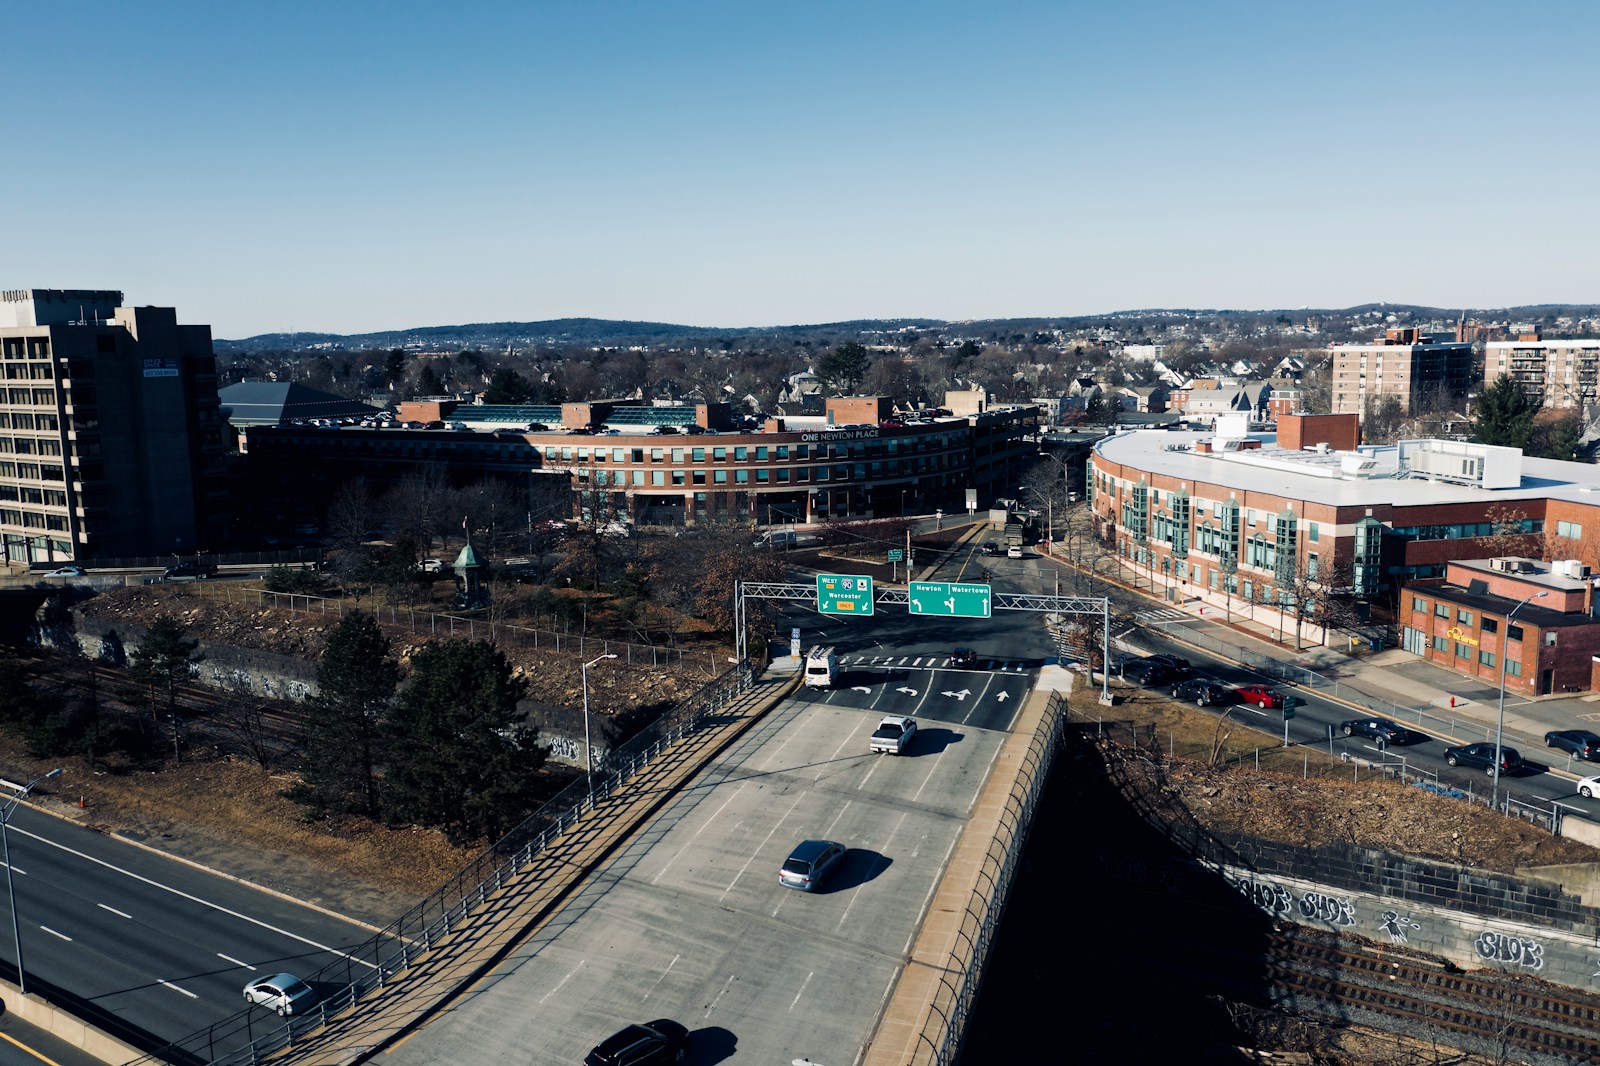
18. Newton, MA
- Forecast maximum, July 4th, 2025: 91.5°F (+10.2°F above climate normal)
- Normal July 4th maximum, 2006-2020: 81.3°F
- Total population: 88,453
17. Malden, MA

- Forecast maximum, July 4th, 2025: 90.9°F (+10.4°F above climate normal)
- Normal July 4th maximum, 2006-2020: 80.5°F
- Total population: 65,463
16. Woburn, MA

- Forecast maximum, July 4th, 2025: 90.9°F (+10.4°F above climate normal)
- Normal July 4th maximum, 2006-2020: 80.5°F
- Total population: 40,992
15. Everett, MA

- Forecast maximum, July 4th, 2025: 91.0°F (+10.5°F above climate normal)
- Normal July 4th maximum, 2006-2020: 80.5°F
- Total population: 48,685
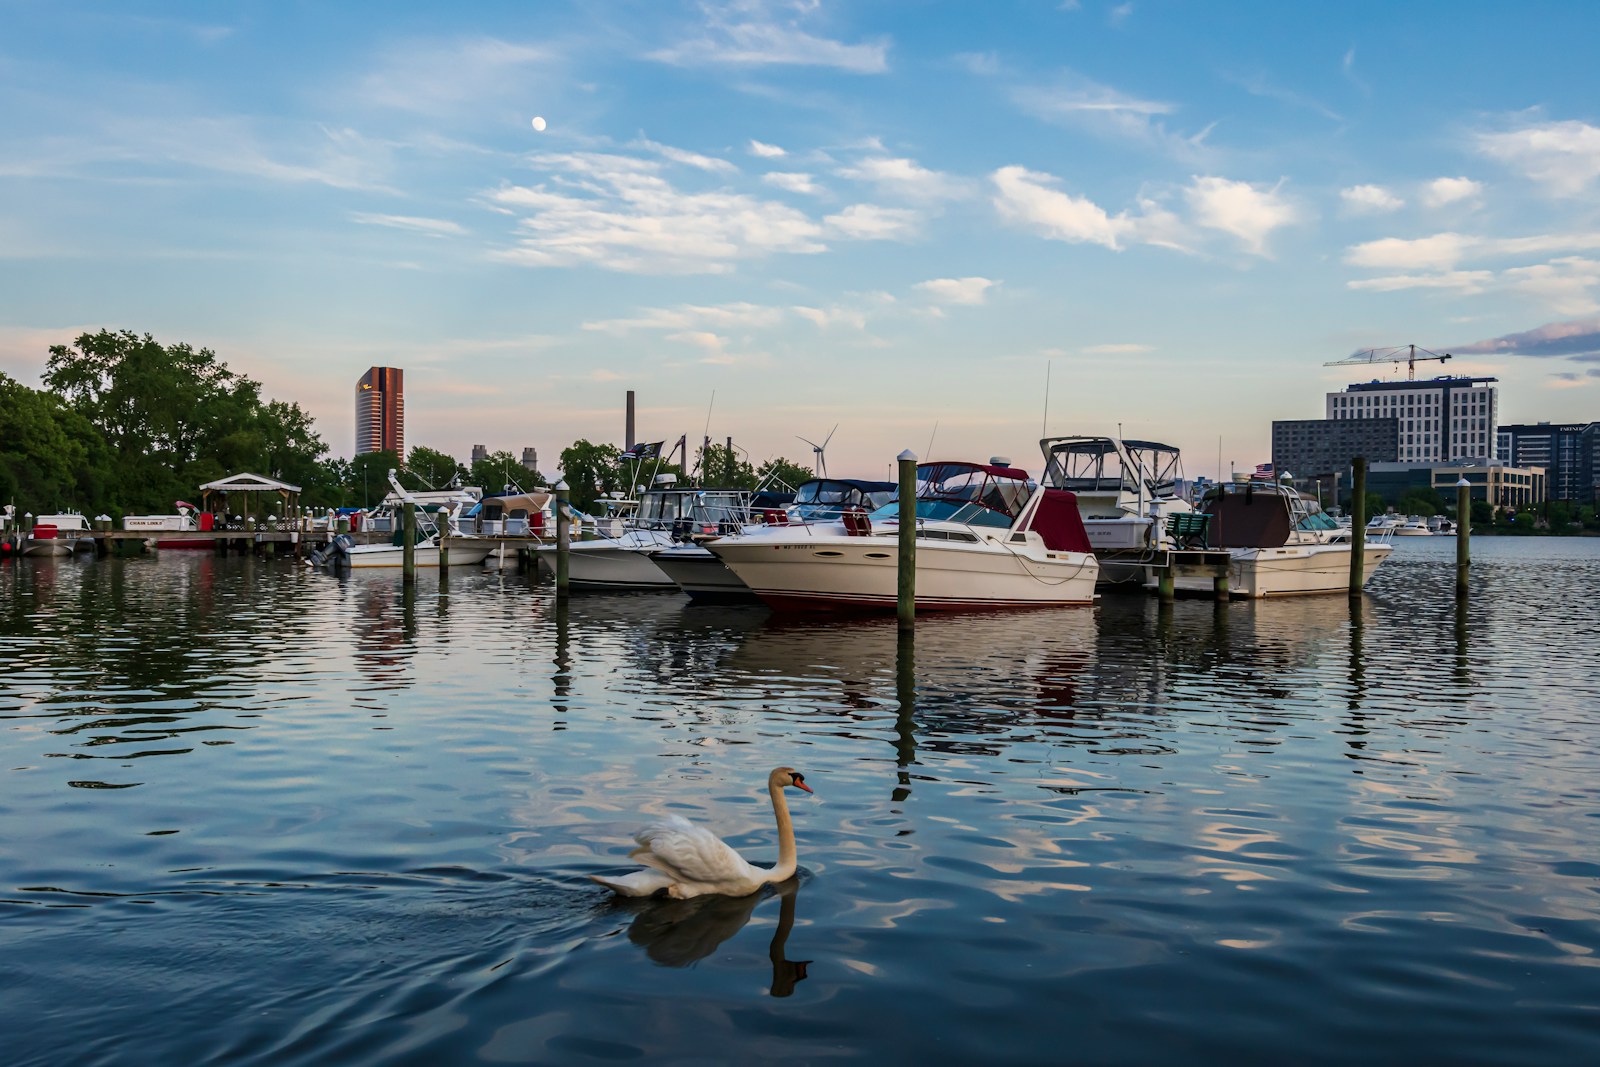
14. Brockton, MA
- Forecast maximum, July 4th, 2025: 91.9°F (+10.6°F above climate normal)
- Normal July 4th maximum, 2006-2020: 81.3°F
- Total population: 104,713
13. Somerville, MA

- Forecast maximum, July 4th, 2025: 92.0°F (+10.7°F above climate normal)
- Normal July 4th maximum, 2006-2020: 81.3°F
- Total population: 80,464
12. Cambridge, MA
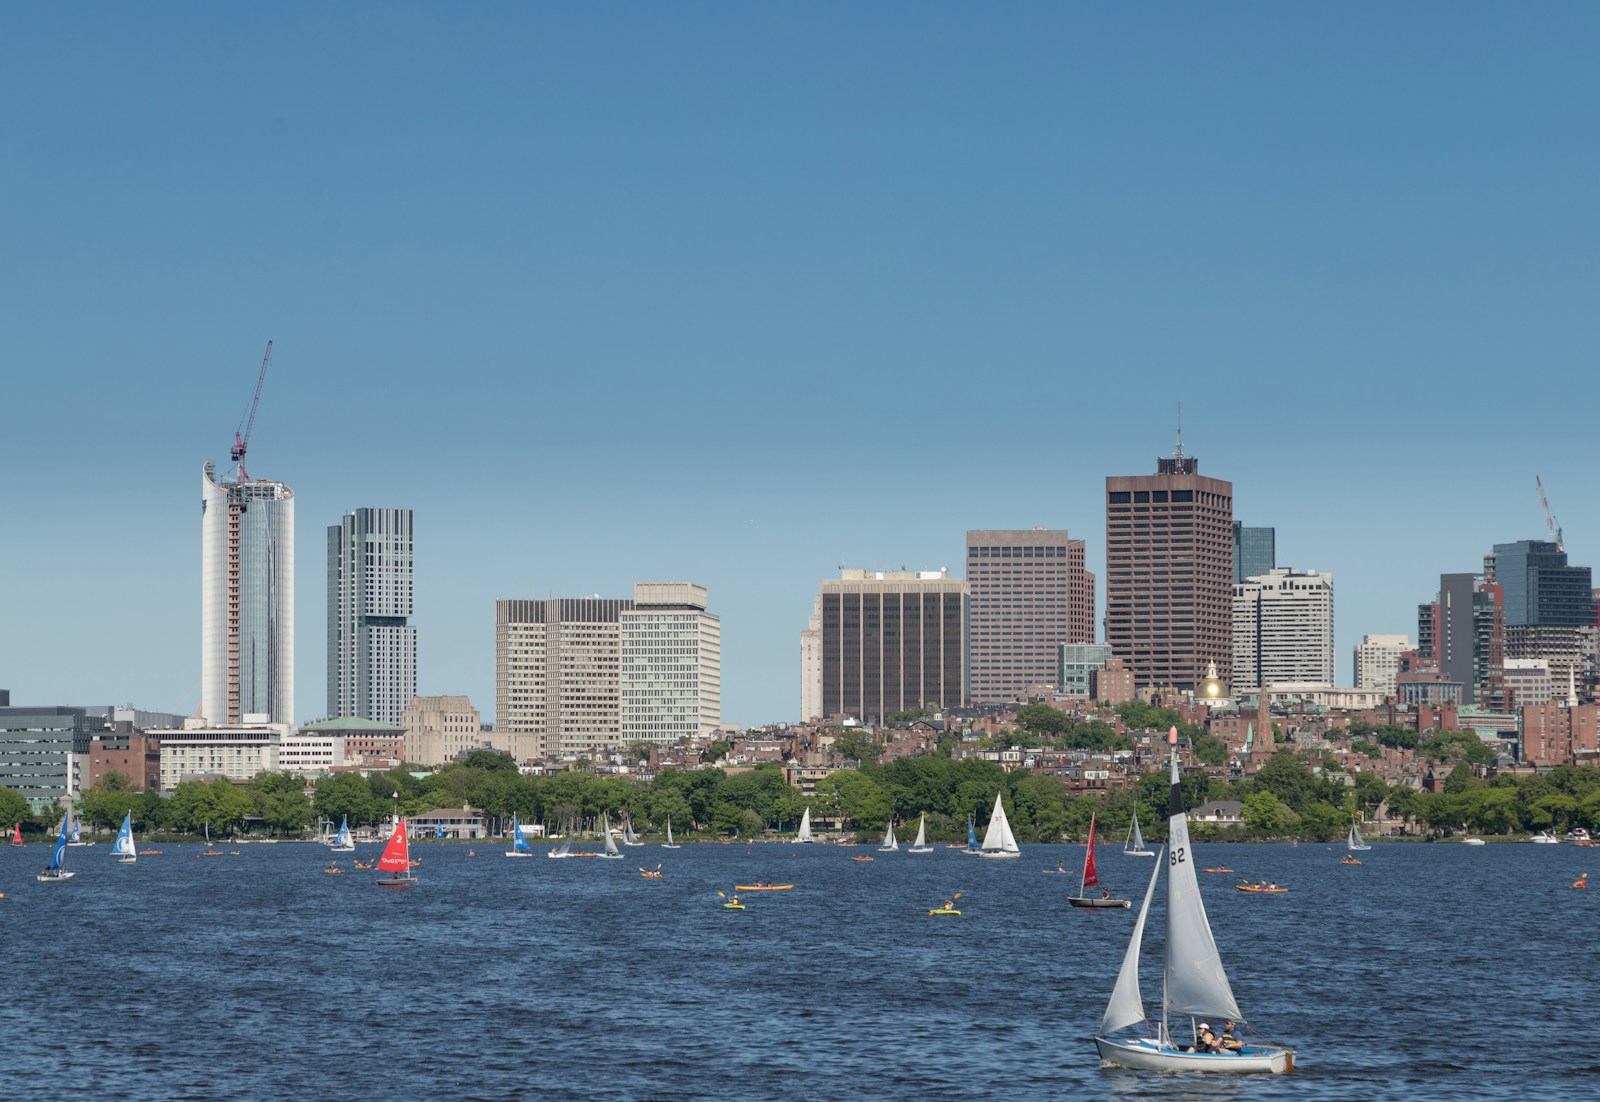
- Forecast maximum, July 4th, 2025: 92.0°F (+10.7°F above climate normal)
- Normal July 4th maximum, 2006-2020: 81.3°F
- Total population: 117,962
11. Medford, MA
- Forecast maximum, July 4th, 2025: 91.7°F (+11.2°F above climate normal)
- Normal July 4th maximum, 2006-2020: 80.5°F
- Total population: 61,748
10. Tracy, CA
- Forecast maximum, July 4th, 2025: 90.3°F (+11.3°F above climate normal)
- Normal July 4th maximum, 2006-2020: 79.0°F
- Total population: 94,027
9. Colorado Springs, CO
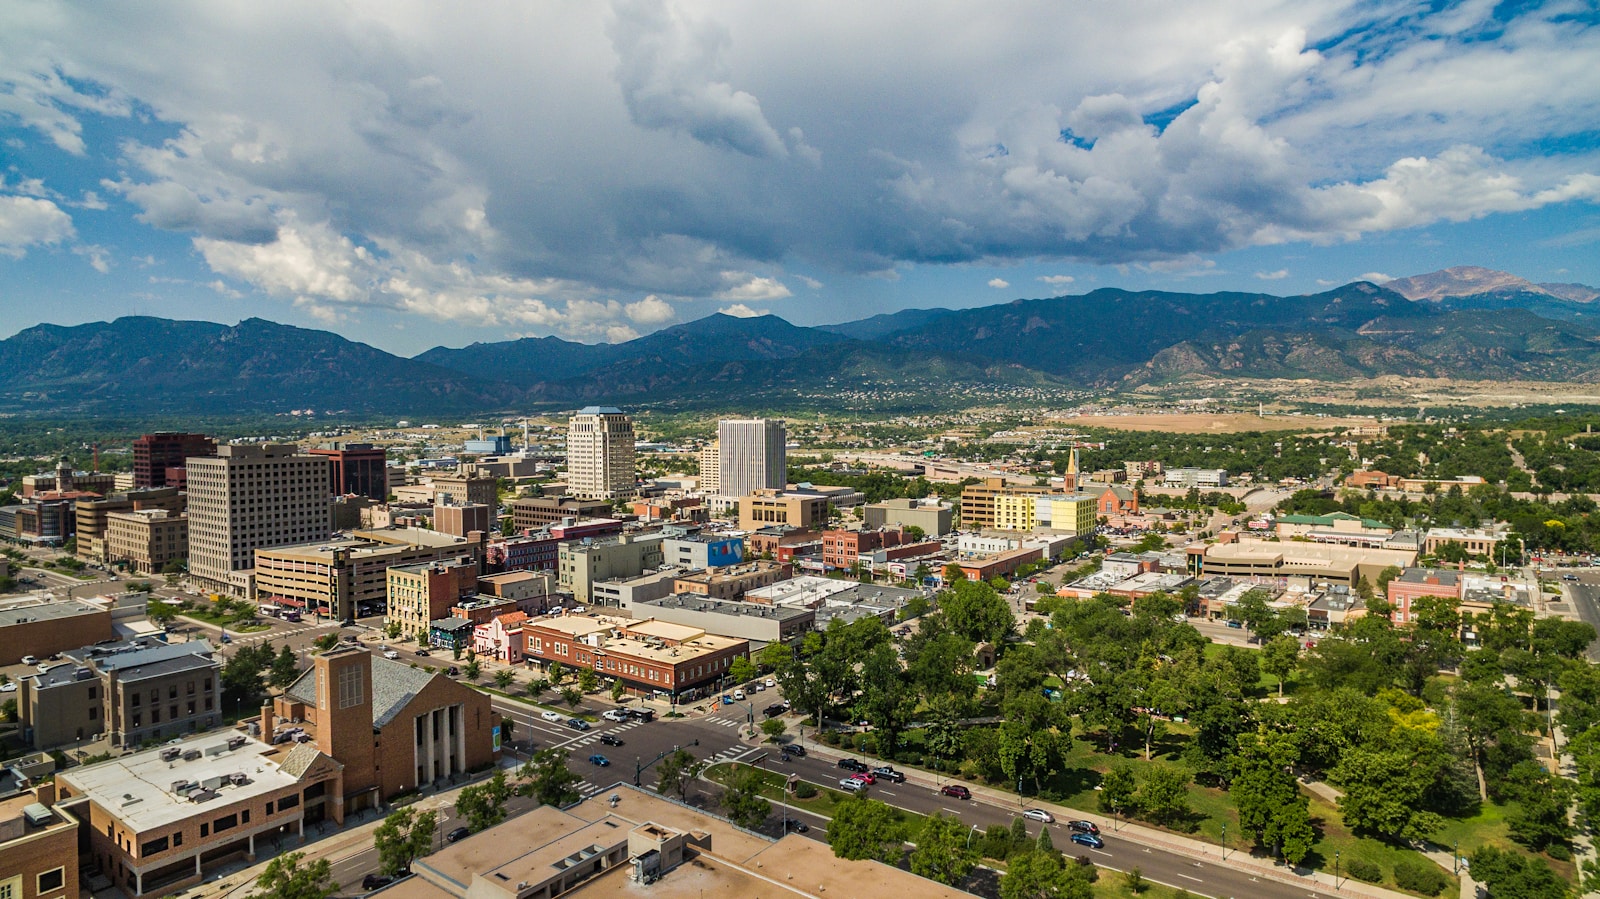
- Forecast maximum, July 4th, 2025: 85.2°F (+11.4°F above climate normal)
- Normal July 4th maximum, 2006-2020: 73.8°F
- Total population: 479,612
8. Pittsburg, CA

- Forecast maximum, July 4th, 2025: 84.3°F (+11.4°F above climate normal)
- Normal July 4th maximum, 2006-2020: 72.9°F
- Total population: 76,419
7. Bismarck, ND

- Forecast maximum, July 4th, 2025: 93.5°F (+11.5°F above climate normal)
- Normal July 4th maximum, 2006-2020: 82.0°F
- Total population: 73,694
6. Concord, CA

- Forecast maximum, July 4th, 2025: 84.9°F (+12.0°F above climate normal)
- Normal July 4th maximum, 2006-2020: 72.9°F
- Total population: 125,007
5. Brentwood, CA

- Forecast maximum, July 4th, 2025: 90.2°F (+12.7°F above climate normal)
- Normal July 4th maximum, 2006-2020: 77.5°F
- Total population: 64,443
4. Victorville, CA

- Forecast maximum, July 4th, 2025: 94.0°F (+12.8°F above climate normal)
- Normal July 4th maximum, 2006-2020: 81.2°F
- Total population: 134,417
3. Apple Valley, CA

- Forecast maximum, July 4th, 2025: 94.1°F (+12.9°F above climate normal)
- Normal July 4th maximum, 2006-2020: 81.2°F
- Total population: 75,603
2. Rapid City, SD

- Forecast maximum, July 4th, 2025: 98.2°F (+14.2°F above climate normal)
- Normal July 4th maximum, 2006-2020: 84.0°F
- Total population: 75,632
1. Antioch, CA

- Forecast maximum, July 4th, 2025: 87.2°F (+14.3°F above climate normal)
- Normal July 4th maximum, 2006-2020: 72.9°F
- Total population: 115,016