These 20 Fast-Growing Cities Are Annexing New Land in High-Risk Fire Zones
 https://climate-crisis-247-bucket.nyc3.digitaloceanspaces.com/wp-content/uploads/2025/10/08224757/Wildfire-Risk-And-Major-Municipal-Boundary-Expansions-150x150.png
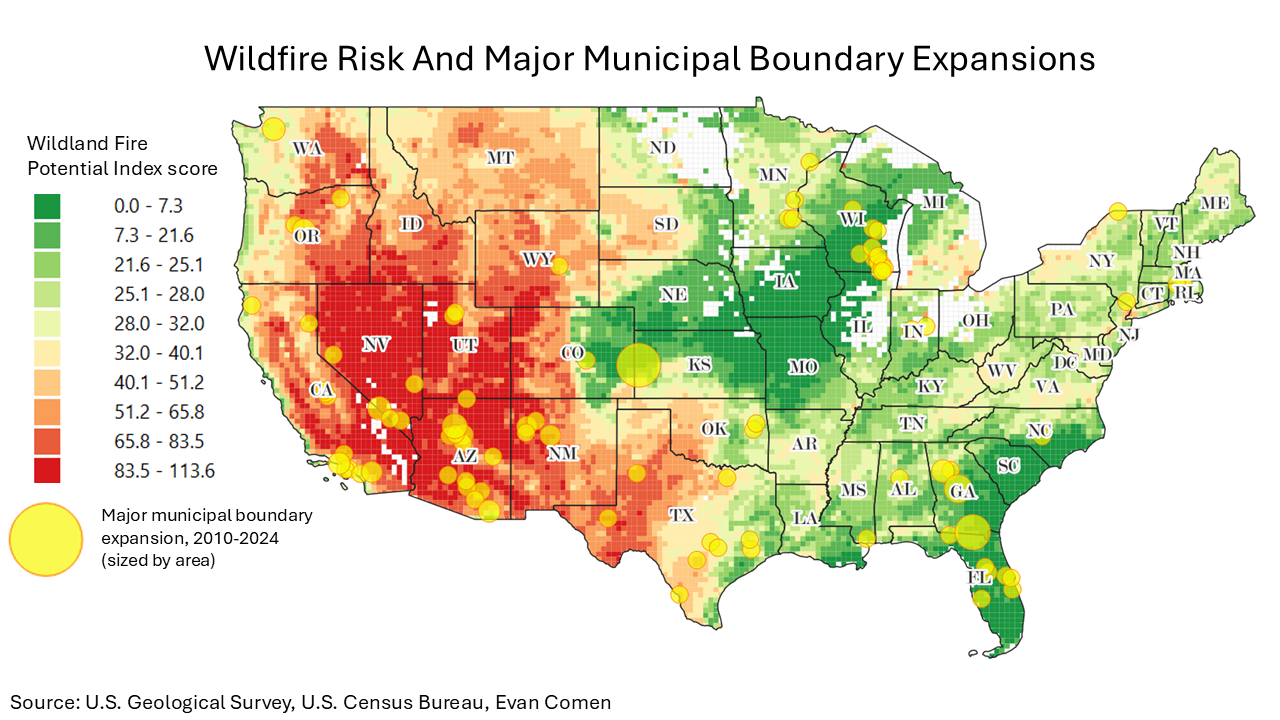
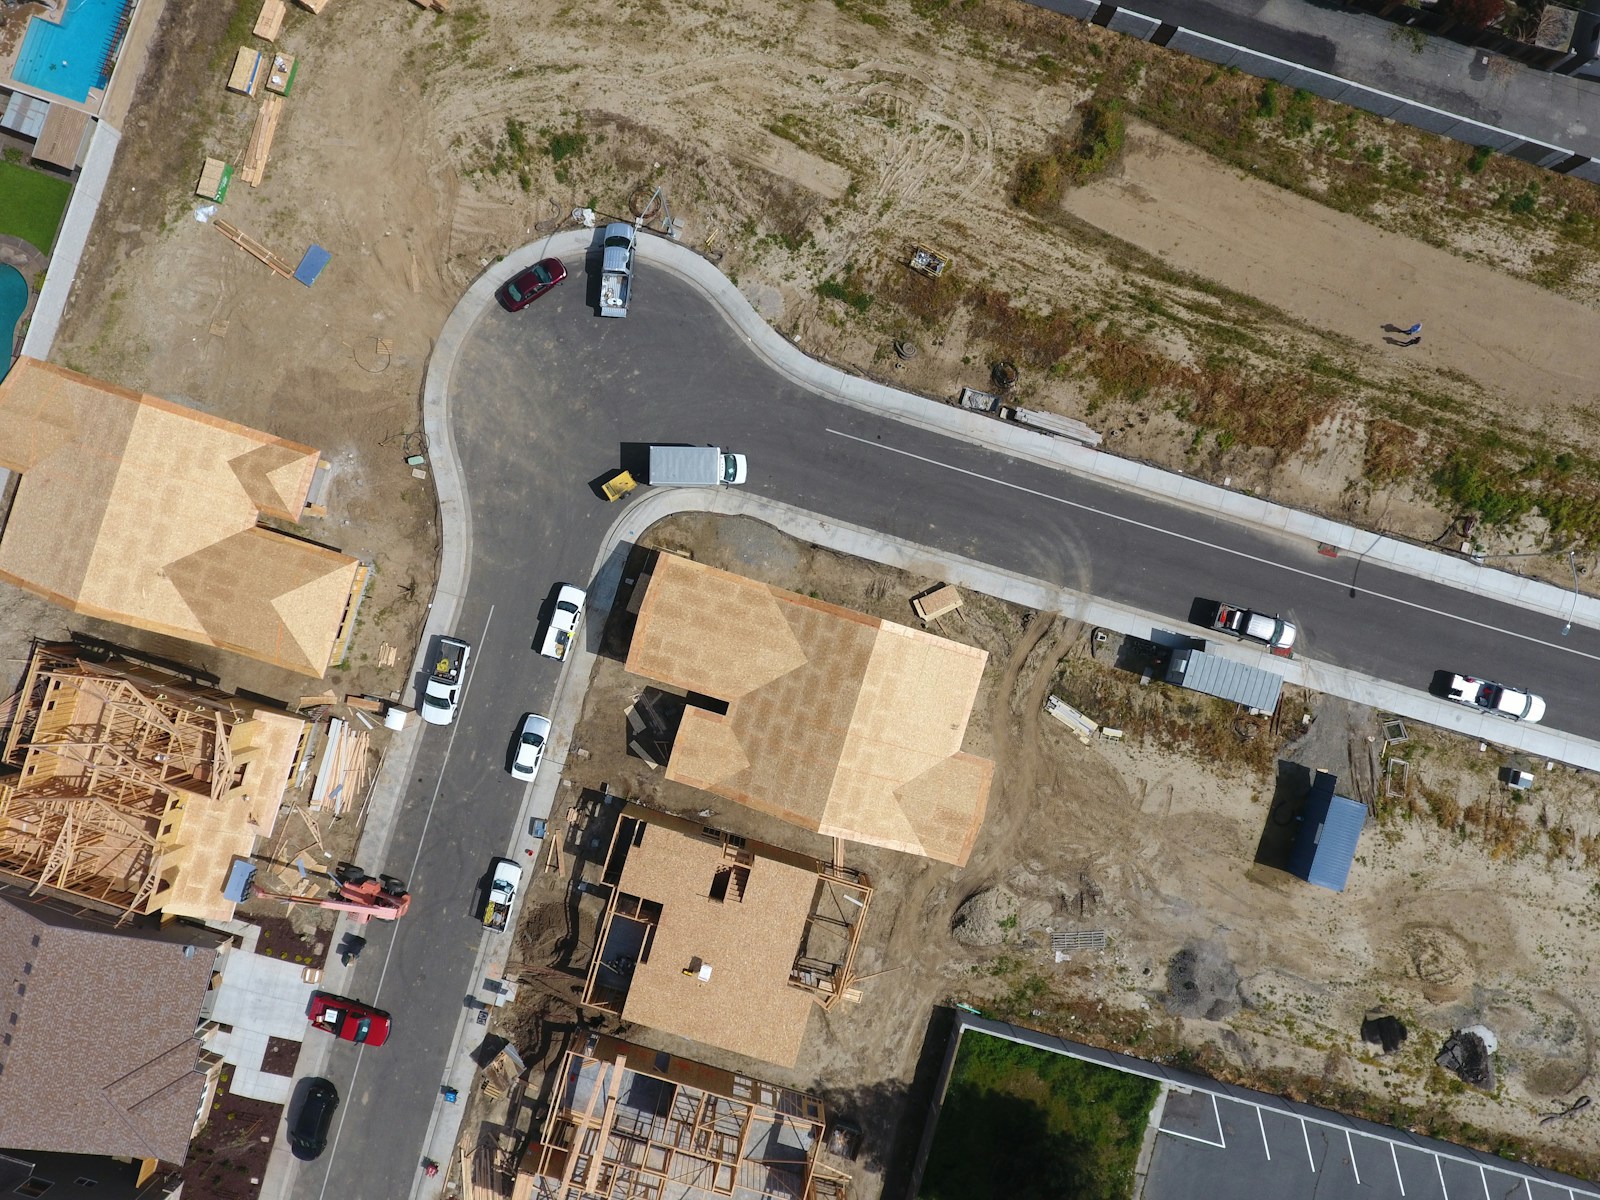
As America’s urban megaregions continue to grow, high-demand suburbs are expanding deeper into flammable forests and grasslands. Excessive development along the wildland urban interface is putting billions of dollars of new-build homes at risk of fire, and is raising the risk of injury and death for large populations.
Hot property? From Maui to Malibu, These Affluent Enclaves Are Becoming Wildfire Hotspots
Whence the next pandemic? Cities Where the Next Pandemic Is Most Likely to Break Out
Cities are annexing new land to accommodate population growth and rising housing demand. An analysis of historical municipal boundaries shows that in some parts of the country, cities are overwhelmingly expanding their boundaries into regions classified as high fire risk by the U.S. Geological Survey. In some cities, newly acquired land poses a Wildland Fire Potential Index rating more than 50% higher than the rest of the city. While 17 of the 20 cities with the greatest expansions into wildfire risk zones are in the West, two are in the South, and one is in the Midwest. An analysis of the data reveals the cities developing into wildfire risk zones the most.
To determine the cities expanding into wildfire risk zones the most, Climate Crisis 247 reviewed data on historical municipal boundaries from the U.S. Census Bureau and Wildland Fire Potential Index from the U.S. Geological Survey. Cities whose newly annexed land averages a Wildland Fire Potential Index score of 50/150 or greater were ranked based on the total added area of high-fire-risk land from 2010 to 2024. Only cities where newly acquired land carries a Wildland Fire Potential Index Score at least 10% greater than the citywide average were considered. Population data is from the U.S. Census Bureau.
20. Post Falls, ID
- Area of current city boundaries: 19.1 sq. mi. (+5.0 sq. mi. since 2010)
- Wildland Fire Potential Index of new land: 66.5/150 (11.4% more than rest of city)
- Value of occupied housing units: $3.9 billion
- Total population: 40,002
19. Kent, WA

- Area of current city boundaries: 34.4 sq. mi. (+5.2 sq. mi. since 2010)
- Wildland Fire Potential Index of new land: 70.0/150 (68.0% more than rest of city)
- Value of occupied housing units: $12.8 billion
- Total population: 135,169
18. North Laurel, MD
- Area of current city boundaries: 6.5 sq. mi. (+5.3 sq. mi. since 2010)
- Wildland Fire Potential Index of new land: 55.9/150 (82.4% more than rest of city)
- Value of occupied housing units: $2.8 billion
- Total population: 24,414
17. Sammamish, WA
- Area of current city boundaries: 24.0 sq. mi. (+5.6 sq. mi. since 2010)
- Wildland Fire Potential Index of new land: 64.8/150 (64.9% more than rest of city)
- Value of occupied housing units: $24.4 billion
- Total population: 66,586
16. Folsom, CA
- Area of current city boundaries: 30.2 sq. mi. (+5.8 sq. mi. since 2010)
- Wildland Fire Potential Index of new land: 87.5/150 (34.9% more than rest of city)
- Value of occupied housing units: $13.4 billion
- Total population: 81,077
15. Reno, NV
- Area of current city boundaries: 111.8 sq. mi. (+5.9 sq. mi. since 2010)
- Wildland Fire Potential Index of new land: 81.5/150 (10.5% more than rest of city)
- Value of occupied housing units: $27.9 billion
- Total population: 265,196
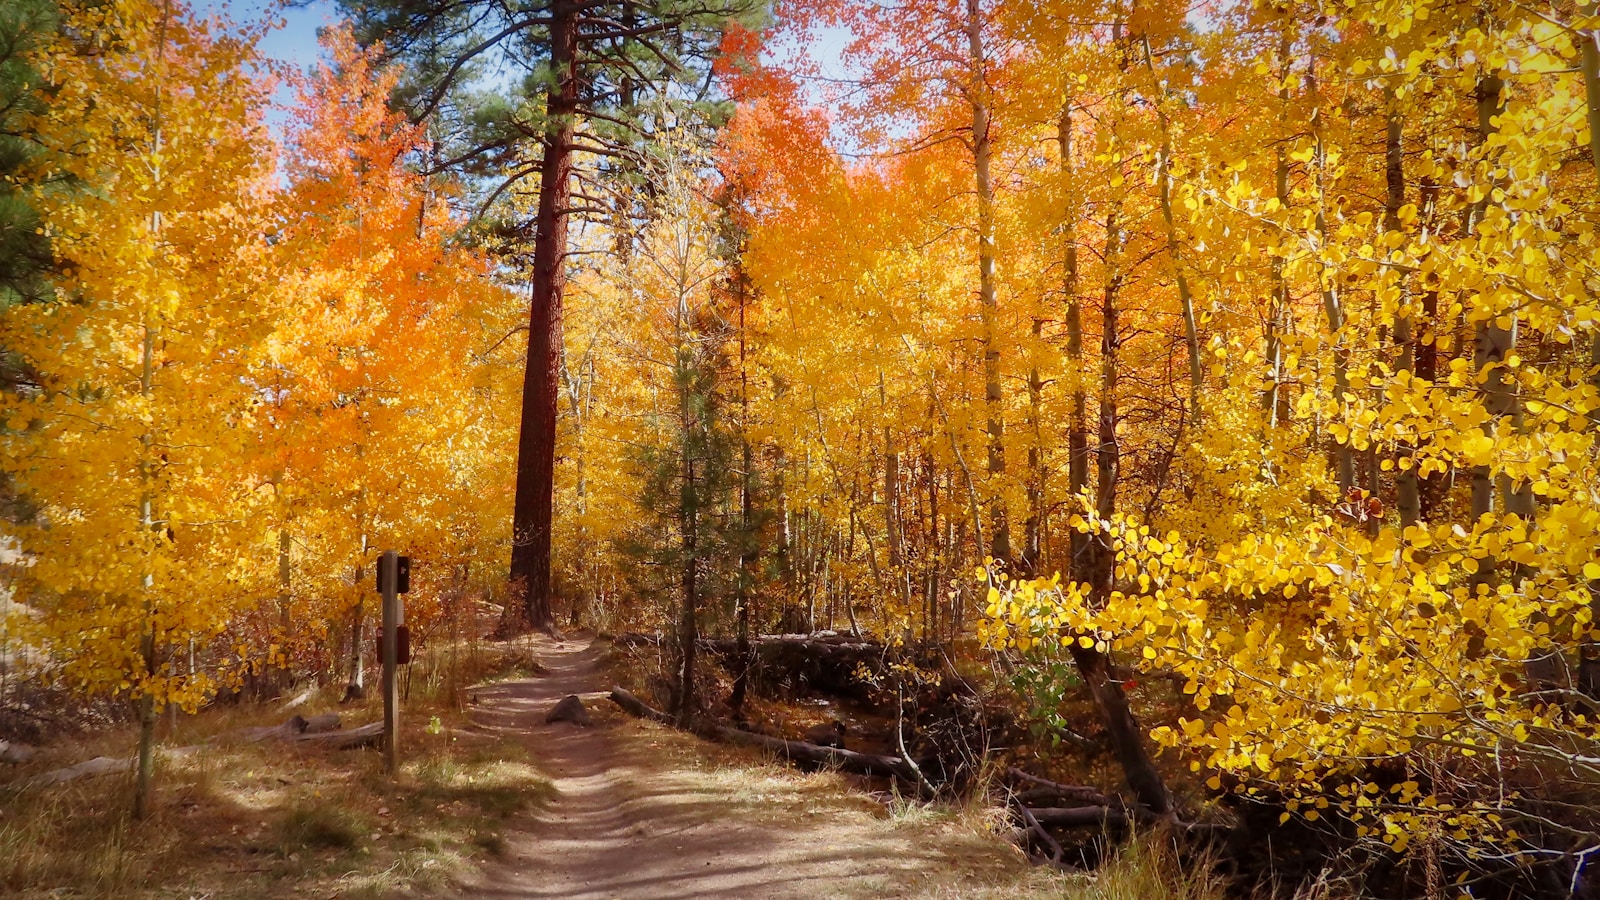
14. West Lafayette, IN
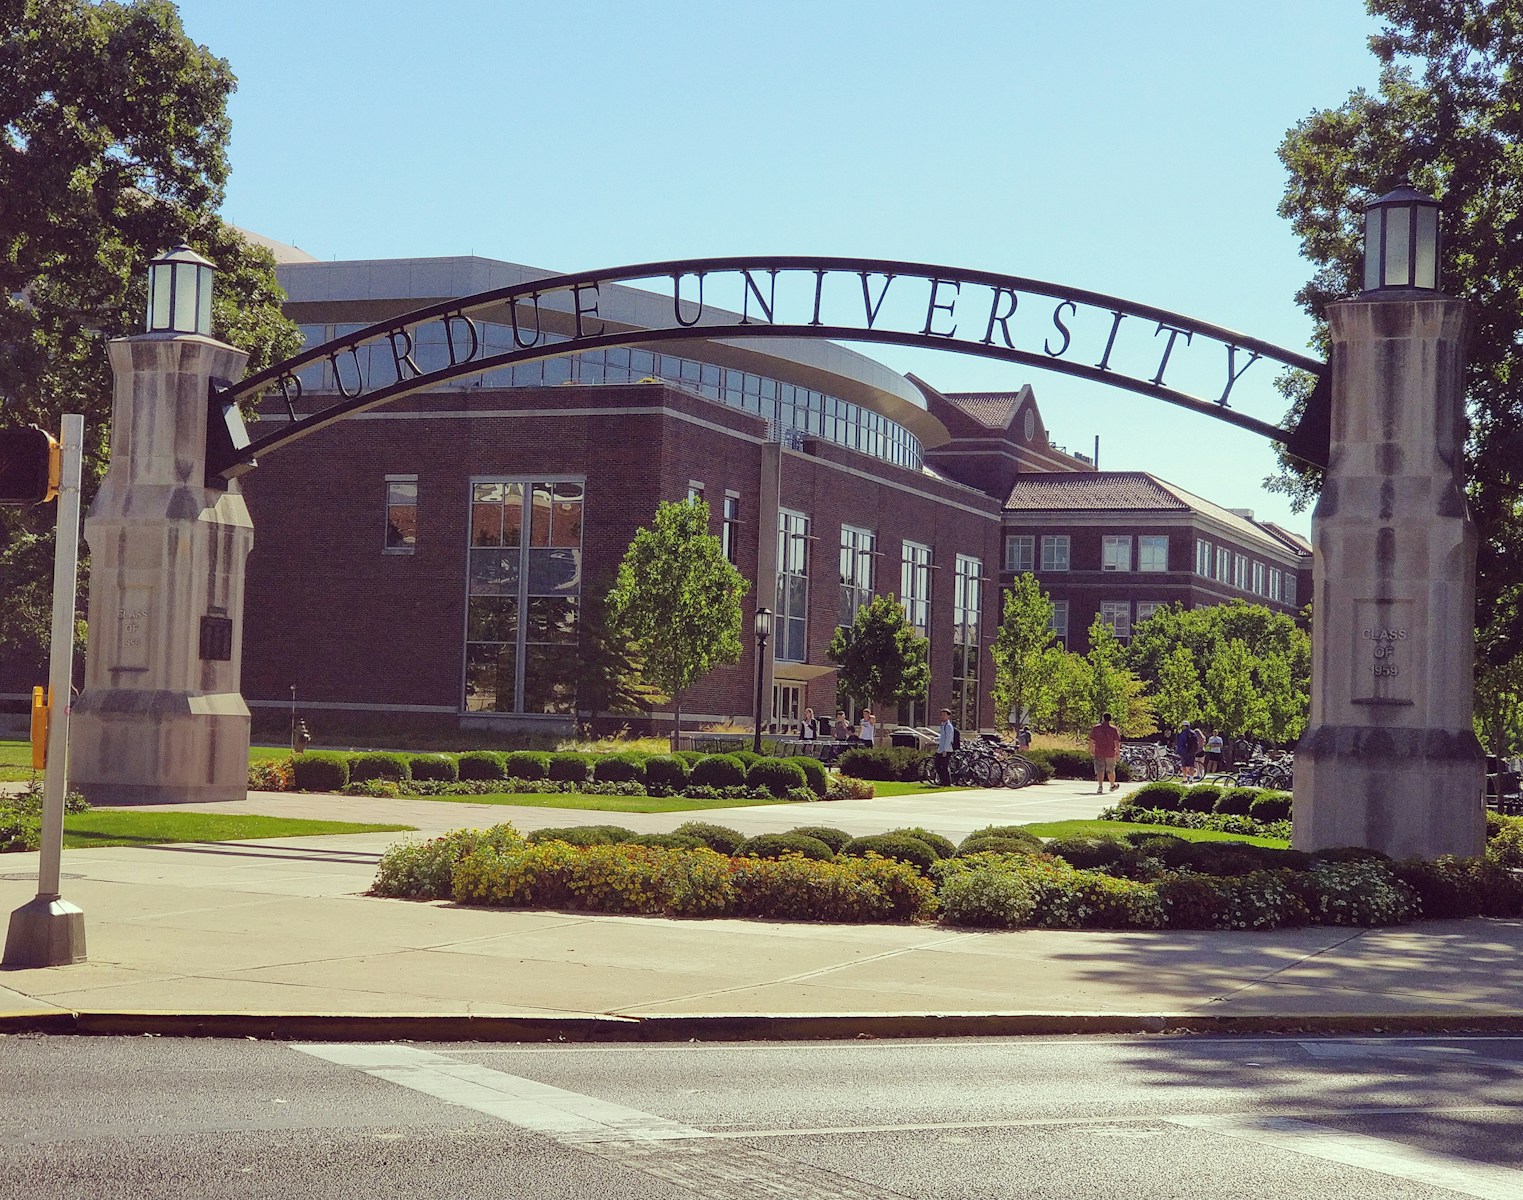
- Area of current city boundaries: 13.8 sq. mi. (+6.2 sq. mi. since 2010)
- Wildland Fire Potential Index of new land: 75.9/150 (46.0% more than rest of city)
- Value of occupied housing units: $1.3 billion
- Total population: 44,861
13. McKinney, TX

- Area of current city boundaries: 69.1 sq. mi. (+6.2 sq. mi. since 2010)
- Wildland Fire Potential Index of new land: 59.8/150 (23.0% more than rest of city)
- Value of occupied housing units: $19.0 billion
- Total population: 196,160
12. St. George, UT
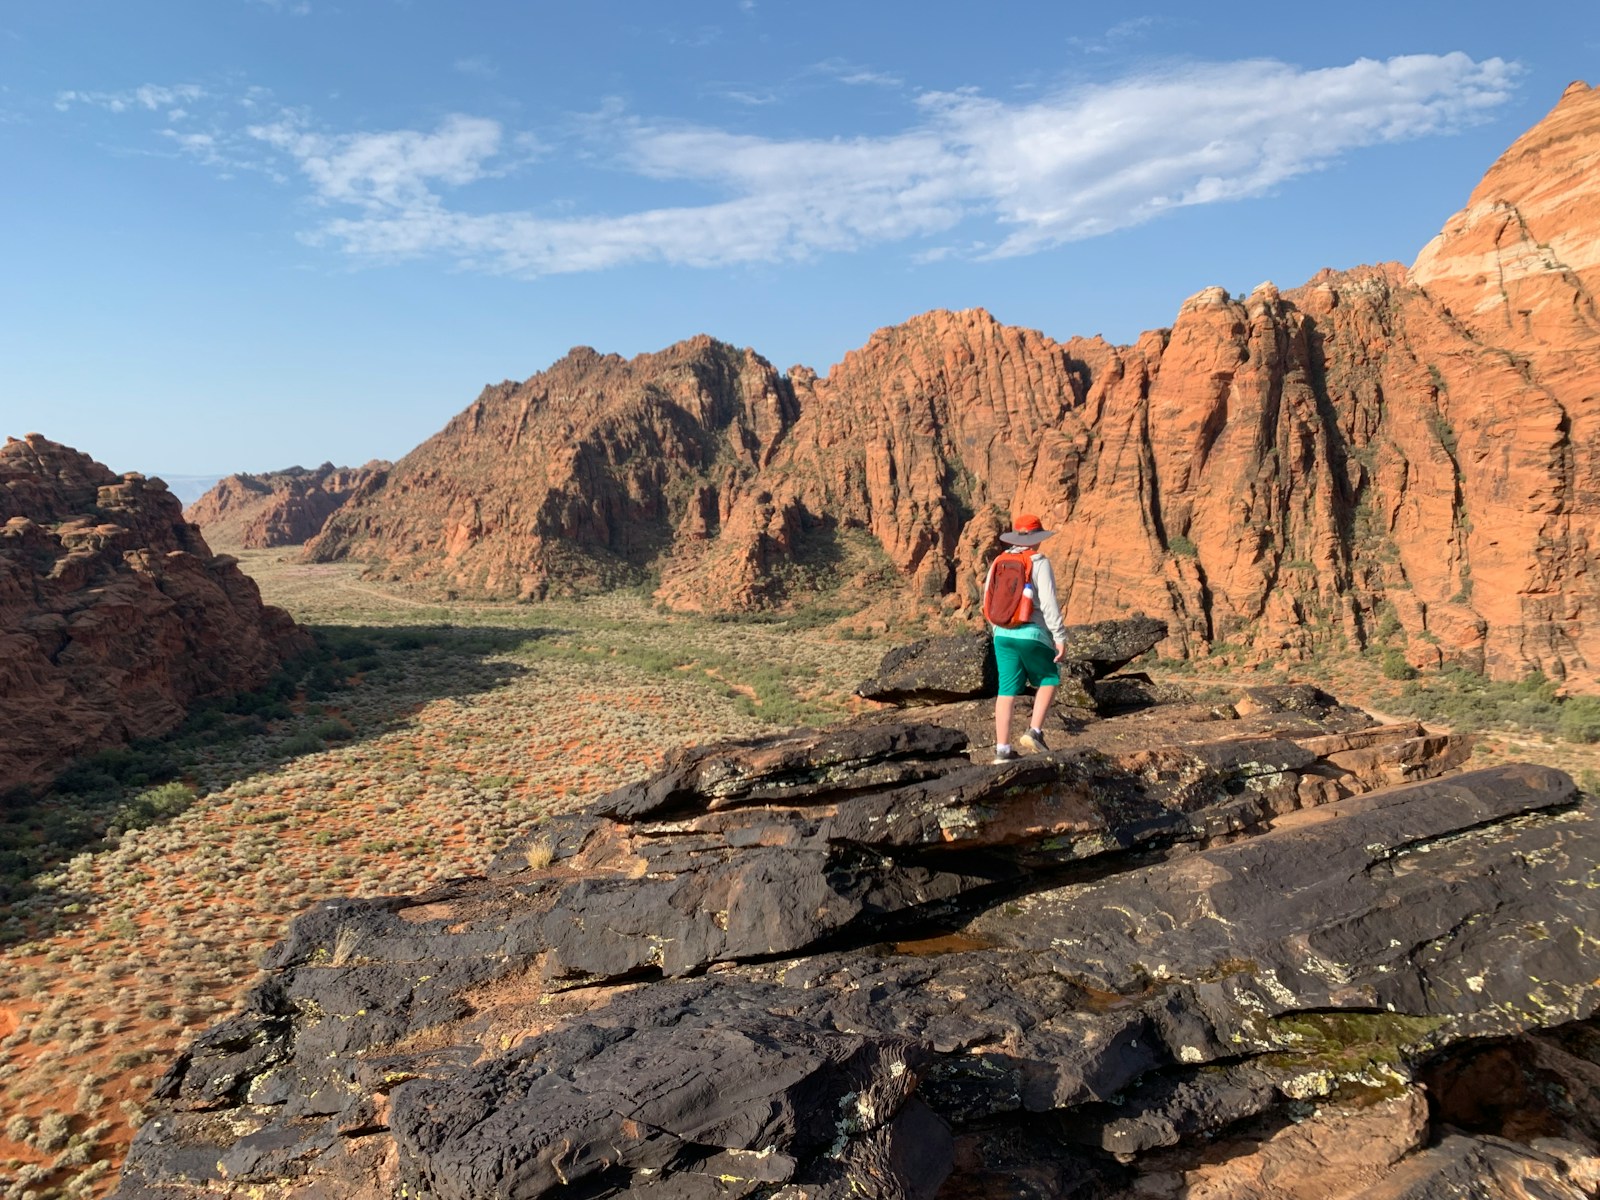
- Area of current city boundaries: 77.4 sq. mi. (+6.5 sq. mi. since 2010)
- Wildland Fire Potential Index of new land: 111.7/150 (18.4% more than rest of city)
- Value of occupied housing units: $11.1 billion
- Total population: 96,174
11. Richland, WA

- Area of current city boundaries: 45.9 sq. mi. (+6.7 sq. mi. since 2010)
- Wildland Fire Potential Index of new land: 72.4/150 (19.7% more than rest of city)
- Value of occupied housing units: $6.1 billion
- Total population: 60,867
10. Missoula, MT
- Area of current city boundaries: 35.2 sq. mi. (+7.5 sq. mi. since 2010)
- Wildland Fire Potential Index of new land: 63.6/150 (27.3% more than rest of city)
- Value of occupied housing units: $6.6 billion
- Total population: 74,627
9. Roseville, CA
- Area of current city boundaries: 44.1 sq. mi. (+7.9 sq. mi. since 2010)
- Wildland Fire Potential Index of new land: 81.7/150 (23.1% more than rest of city)
- Value of occupied housing units: $23.2 billion
- Total population: 148,879
8. Prescott, AZ
- Area of current city boundaries: 49.5 sq. mi. (+7.9 sq. mi. since 2010)
- Wildland Fire Potential Index of new land: 84.1/150 (13.1% more than rest of city)
- Value of occupied housing units: $7.6 billion
- Total population: 46,054
7. Kuna, ID
- Area of current city boundaries: 26.1 sq. mi. (+7.9 sq. mi. since 2010)
- Wildland Fire Potential Index of new land: 71.6/150 (75.6% more than rest of city)
- Value of occupied housing units: $2.8 billion
- Total population: 24,845
6. Modesto, CA
- Area of current city boundaries: 45.2 sq. mi. (+8.1 sq. mi. since 2010)
- Wildland Fire Potential Index of new land: 78.5/150 (36.8% more than rest of city)
- Value of occupied housing units: $17.1 billion
- Total population: 218,308
5. Spokane, WA
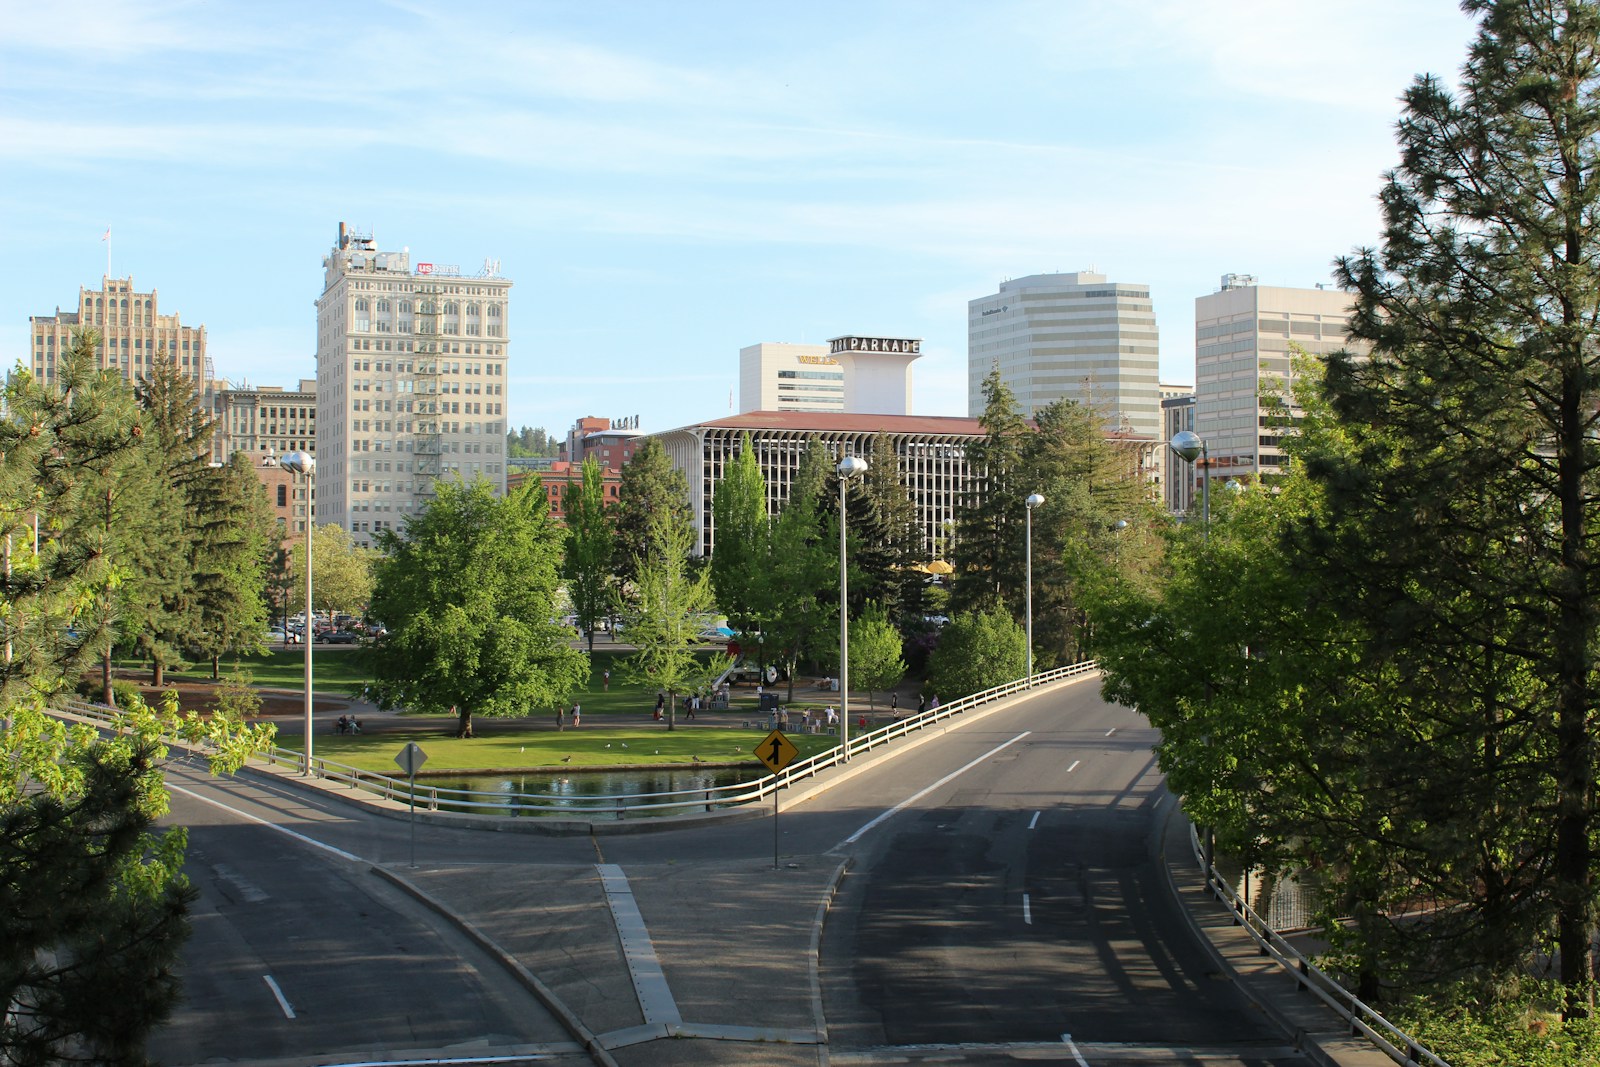
- Area of current city boundaries: 69.5 sq. mi. (+9.5 sq. mi. since 2010)
- Wildland Fire Potential Index of new land: 67.4/150 (22.5% more than rest of city)
- Value of occupied housing units: $18.6 billion
- Total population: 227,922
4. Meridian, ID
- Area of current city boundaries: 37.2 sq. mi. (+10.3 sq. mi. since 2010)
- Wildland Fire Potential Index of new land: 75.8/150 (20.6% more than rest of city)
- Value of occupied housing units: $15.1 billion
- Total population: 119,872
3. Cottonwood, AZ
- Area of current city boundaries: 28.2 sq. mi. (+11.7 sq. mi. since 2010)
- Wildland Fire Potential Index of new land: 74.6/150 (18.1% more than rest of city)
- Value of occupied housing units: $1.0 billion
- Total population: 12,314
2. Henderson, NV

- Area of current city boundaries: 121.5 sq. mi. (+13.8 sq. mi. since 2010)
- Wildland Fire Potential Index of new land: 103.5/150 (13.7% more than rest of city)
- Value of occupied housing units: $40.0 billion
- Total population: 318,063
1. Show Low, AZ
- Area of current city boundaries: 66.0 sq. mi. (+24.8 sq. mi. since 2010)
- Wildland Fire Potential Index of new land: 58.7/150 (10.6% more than rest of city)
- Value of occupied housing units: $1.0 billion
- Total population: 11,767
Sponsor
Find a Vetted Financial Advisor
- Finding a fiduciary financial advisor doesn't have to be hard. SmartAsset's free tool matches you with up to 3 financial advisors that serve your area in 5 minutes.
- Each advisor has been vetted by SmartAsset and is held to a fiduciary standard to act in your best interests. Get on the path toward achieving your financial goals!
More from ClimateCrisis 247
- The 24 Deadliest Heat Waves of the Last 10 Years
- The Counties Where Power Outages Pose the Greatest Health Risk
- The US Cities With The Worst Air to Breathe Right Now
- Counties With the Highest Concentration of Data Centers and Power Vulnerability