These 25 Cities Are Finding Ways to Lower Surface Temperature
 https://climate-crisis-247-bucket.nyc3.cdn.digitaloceanspaces.com/wp-content/uploads/2025/10/10084322/Average-annual-change-in-July-land-surface-temperature-150x150.png
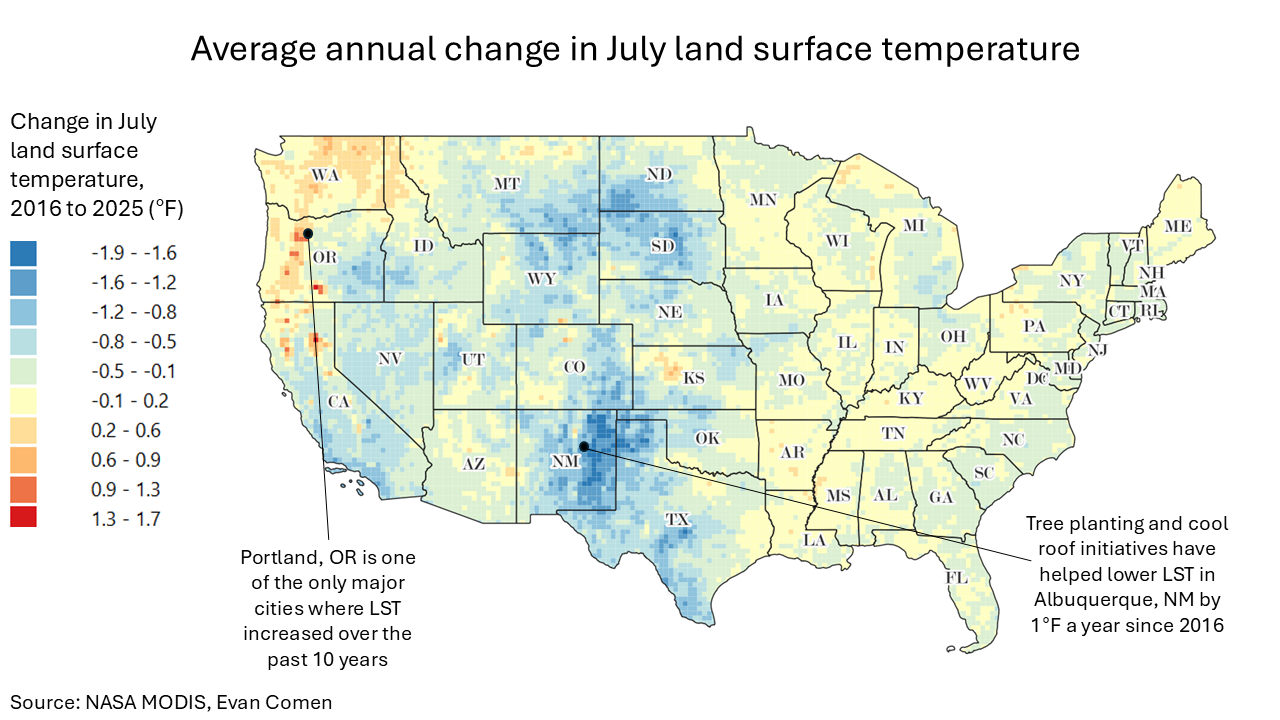
As climate change warms the planet, many cities are heating up faster than the global average. But while there is little city planners can do about ambient air temperature, many municipalities are taking efforts to cool surfaces by adding tree cover and reducing impervious surfaces.
Hot property? From Maui to Malibu, These Affluent Enclaves Are Becoming Wildfire Hotspots
Whence the next pandemic? Cities Where the Next Pandemic Is Most Likely to Break Out
Scientists monitor land surface temperature across the globe using high-resolution satellite data from NASA. In some cities, satellite data shows a downward trend in land surface temperature over the past 10 years, despite increasing air temperatures in almost every corner of the country.
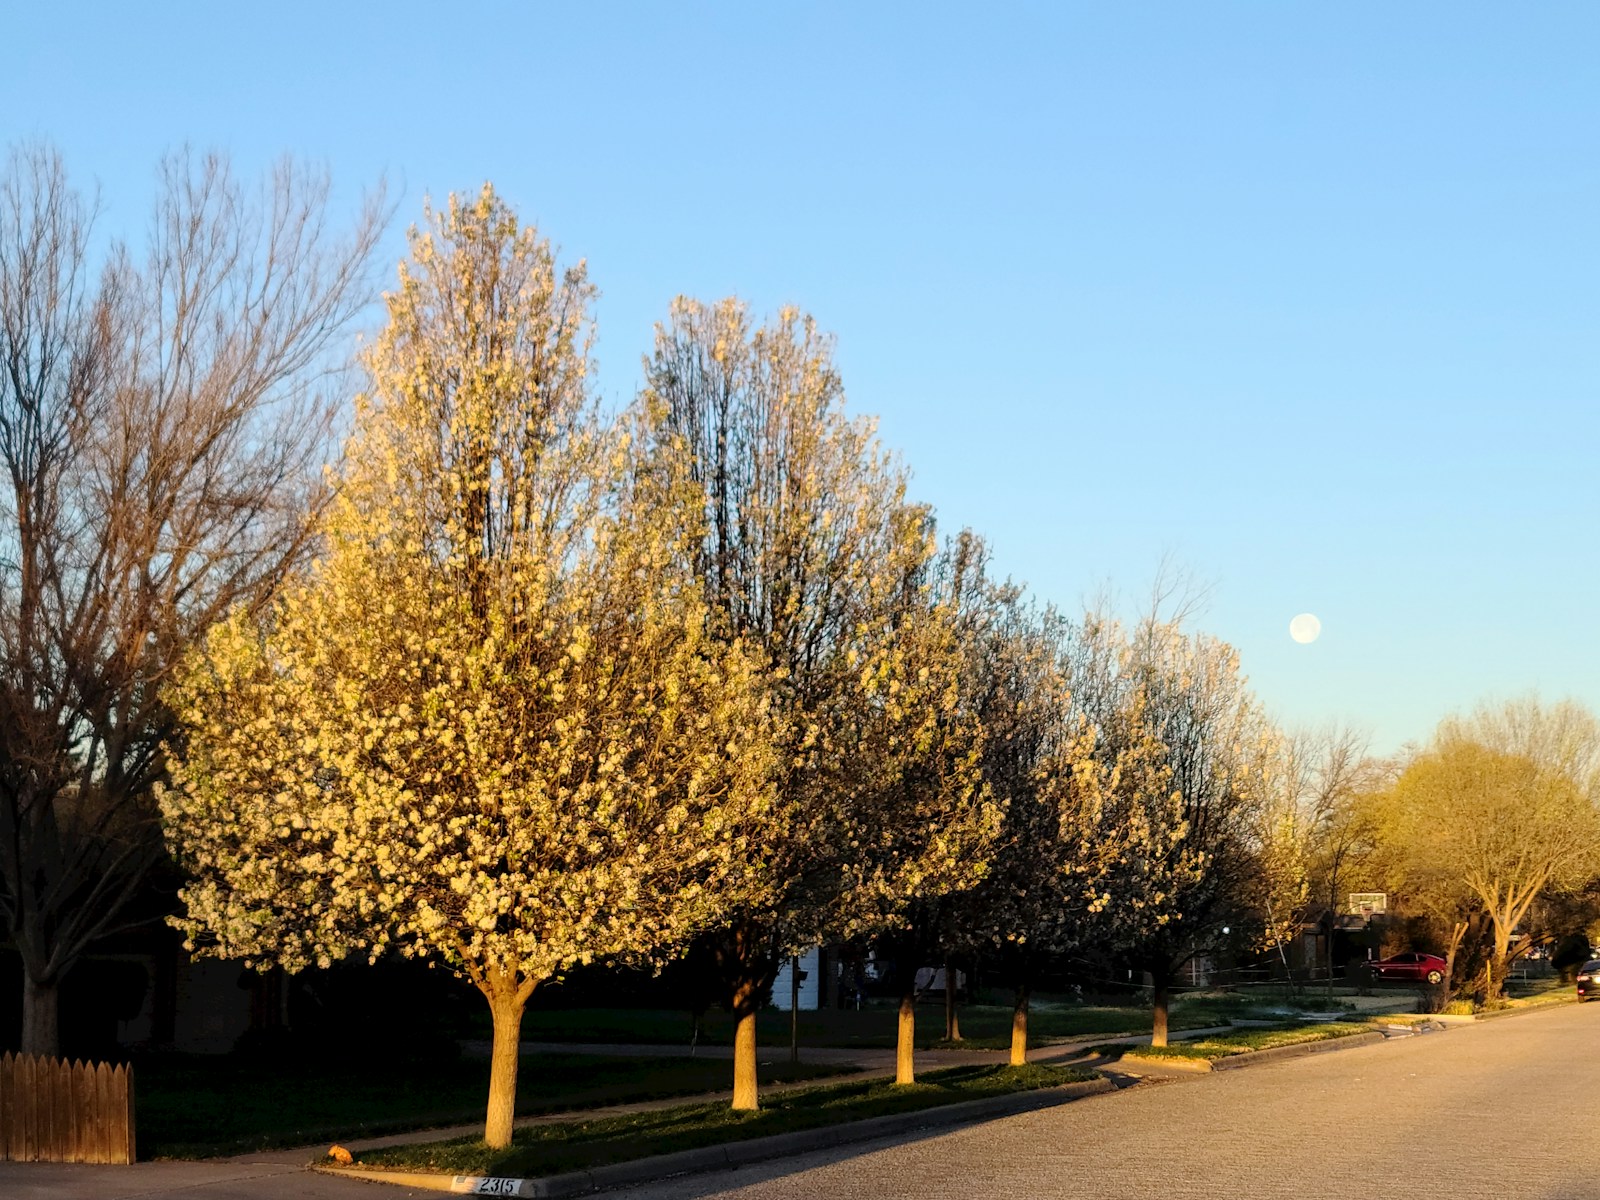
Many of the places where surface temperatures are cooling have implemented citywide tree planting programs and green roof initiatives that absorb radiant heat. More than half of the 25 cooling cities are in California, while just a handful are in the Northeast or Midwest. A closer look at the data reveals the cities where surface temperatures are decreasing.
To determine the cities where surface temperatures are decreasing, Climate Crisis 247 reviewed data on monthly land surface temperatures from NASA’s MODIS program. Cities were ranked based on the slope of a linear regression between year and average July land surface temperature from 2016 to 2025. Raster data was averaged across Census place boundaries using QGIS zonal statistics. Only cities with at least 250,000 residents were considered.
25. Detroit, MI

- Average decrease in July land surface temperature, 2016-2025: -0.5°F per year
- Average July land surface temperature, 2025: 92.0°F
- Average July land surface temperature, 2016: 94.6°F
- Total population: 636,787
24. Toledo, OH
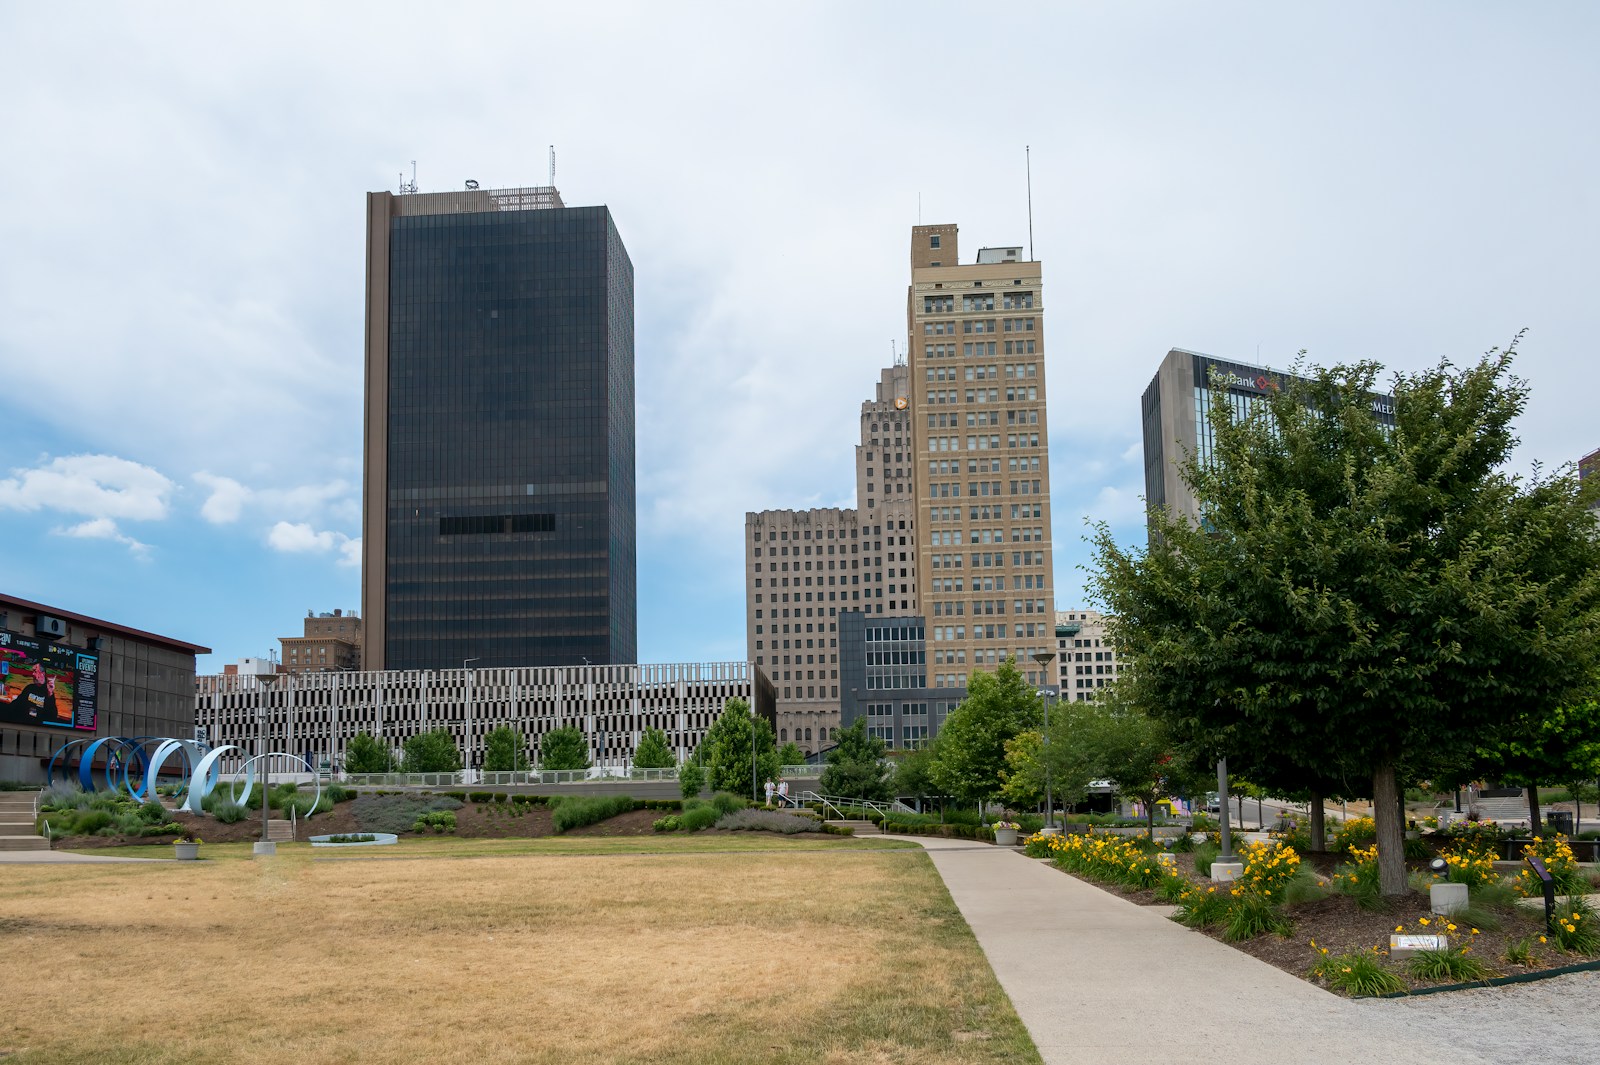
- Average decrease in July land surface temperature, 2016-2025: -0.6°F per year
- Average July land surface temperature, 2025: 87.0°F
- Average July land surface temperature, 2016: 89.6°F
- Total population: 269,962
23. Jersey City, NJ

- Average decrease in July land surface temperature, 2016-2025: -0.6°F per year
- Average July land surface temperature, 2025: 90.8°F
- Average July land surface temperature, 2016: 95.8°F
- Total population: 287,899
22. Oakland, CA

- Average decrease in July land surface temperature, 2016-2025: -0.6°F per year
- Average July land surface temperature, 2025: 83.6°F
- Average July land surface temperature, 2016: 91.8°F
- Total population: 437,825
21. Miami, FL
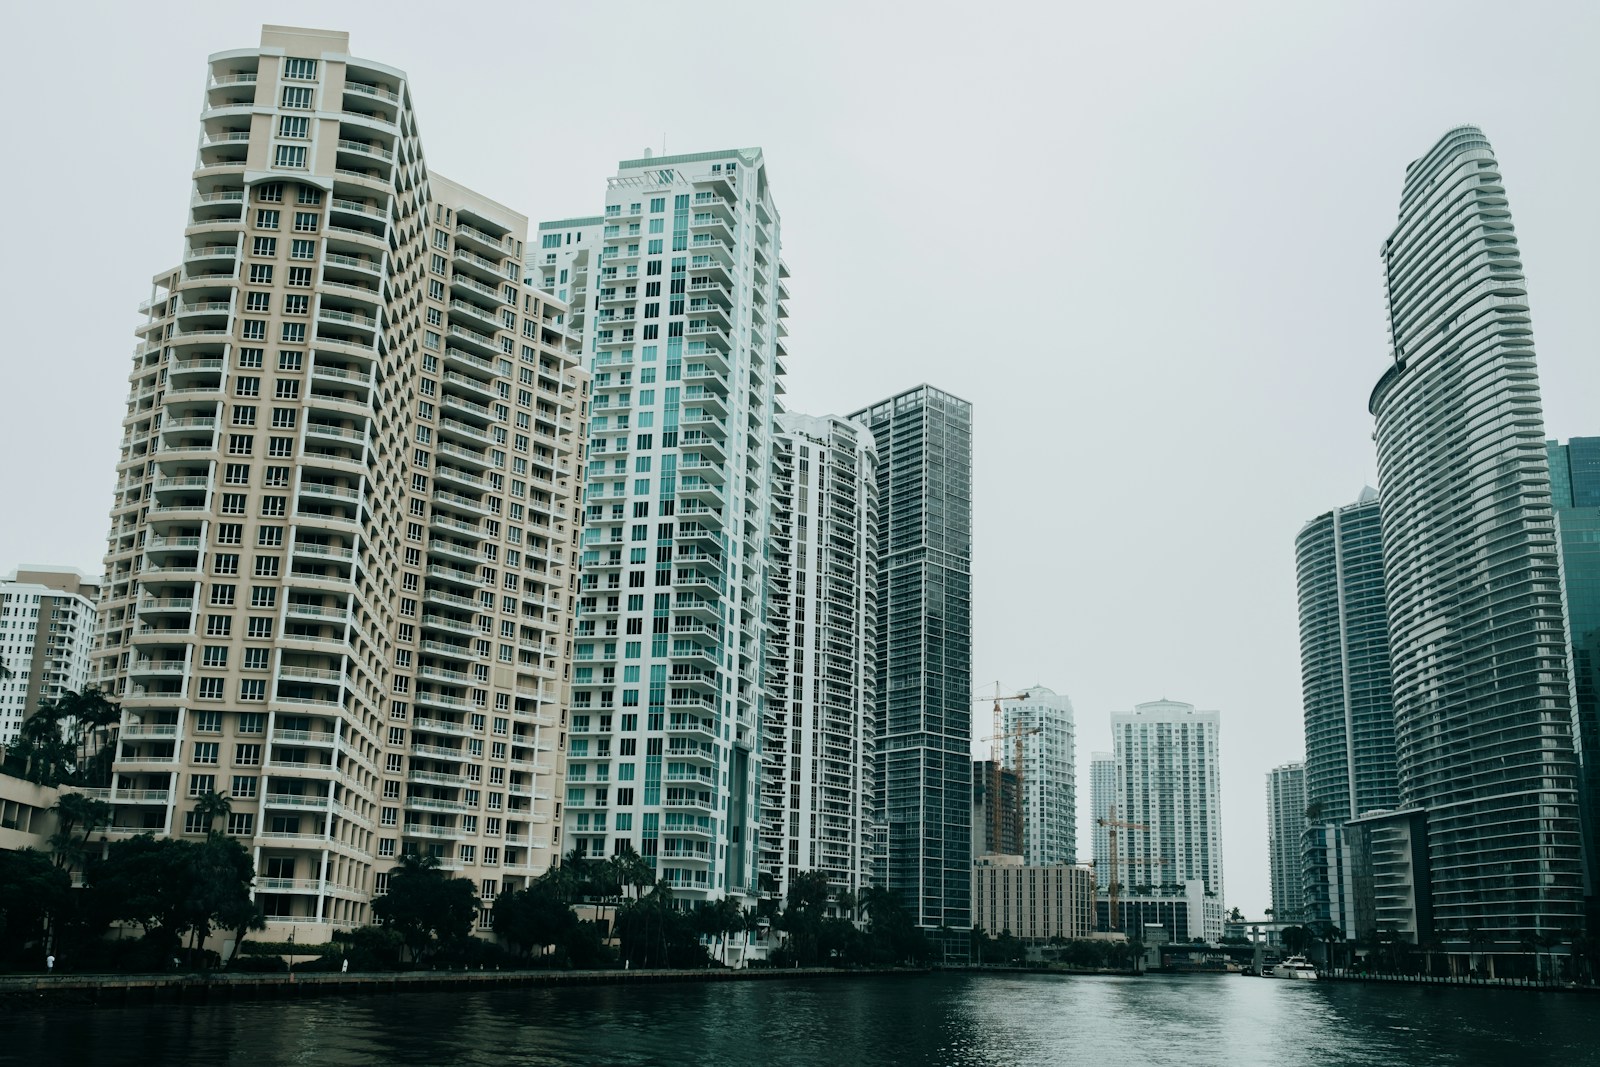
- Average decrease in July land surface temperature, 2016-2025: -0.6°F per year
- Average July land surface temperature, 2025: 89.8°F
- Average July land surface temperature, 2016: 96.3°F
- Total population: 443,665
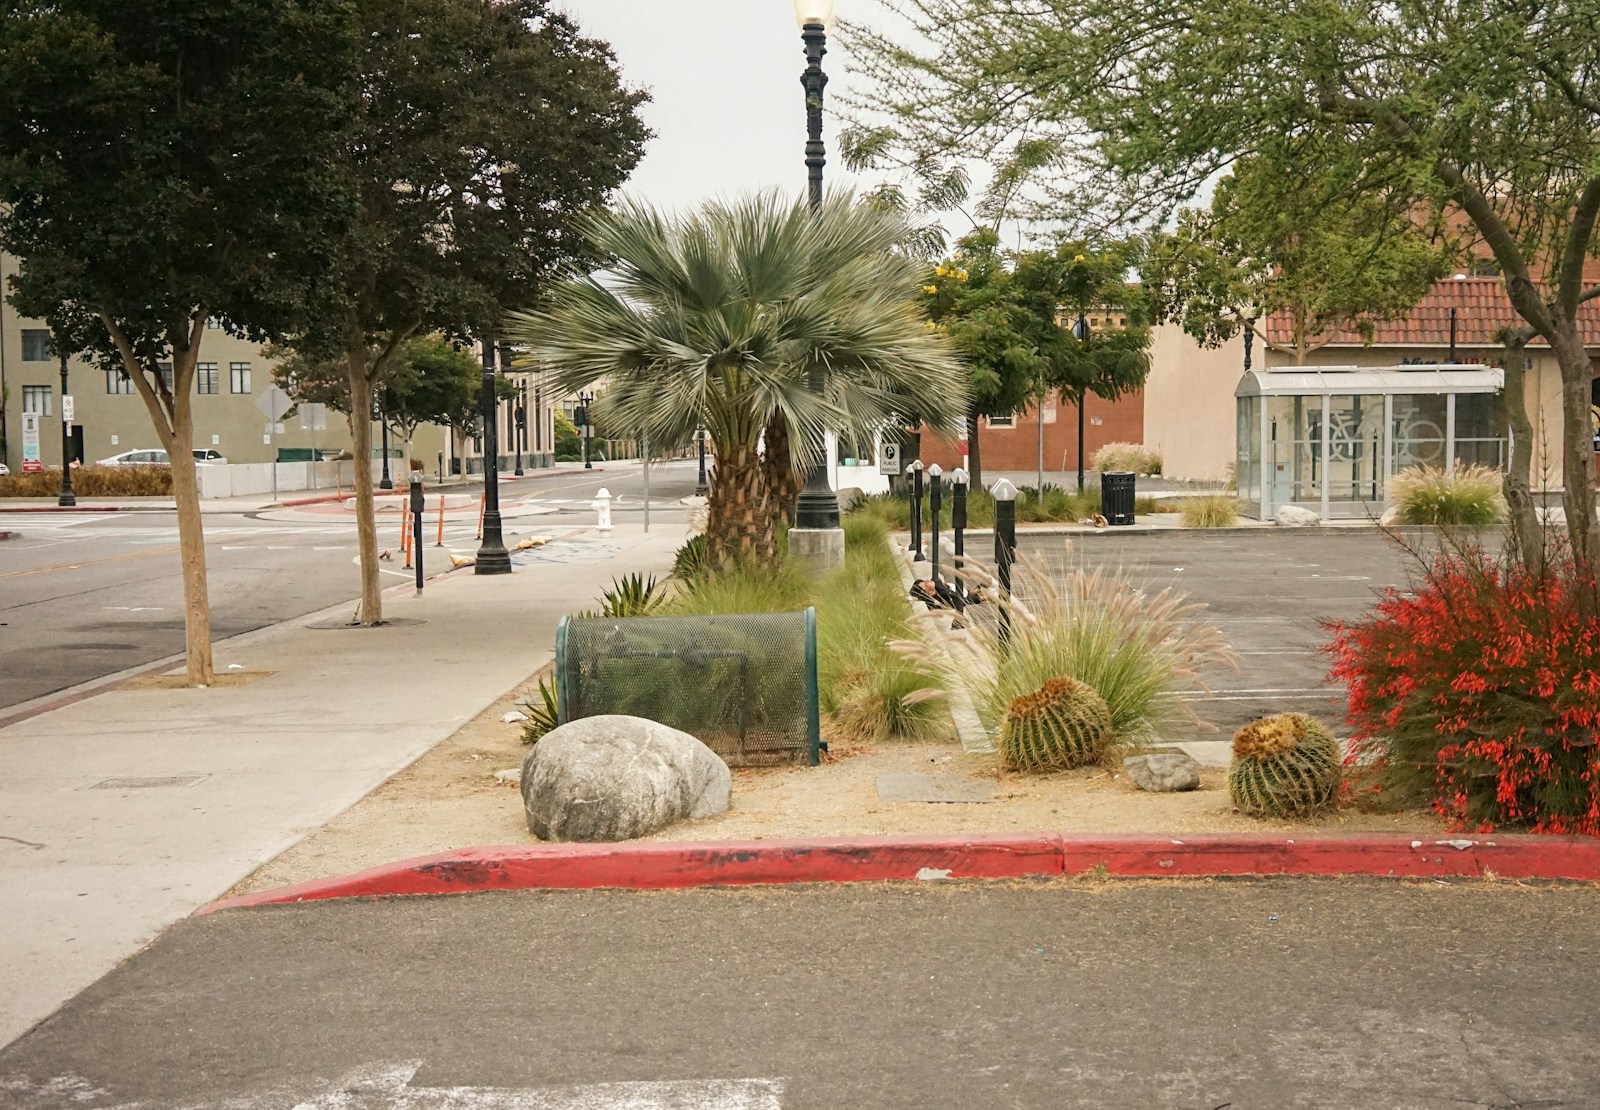
20. Bakersfield, CA

- Average decrease in July land surface temperature, 2016-2025: -0.7°F per year
- Average July land surface temperature, 2025: 108.1°F
- Average July land surface temperature, 2016: 118.2°F
- Total population: 404,321
19. Anchorage, AK

- Average decrease in July land surface temperature, 2016-2025: -0.7°F per year
- Average July land surface temperature, 2025: 56.1°F
- Average July land surface temperature, 2016: 59.8°F
- Total population: 290,674
18. Fresno, CA

- Average decrease in July land surface temperature, 2016-2025: -0.7°F per year
- Average July land surface temperature, 2025: 106.0°F
- Average July land surface temperature, 2016: 116.1°F
- Total population: 541,528
17. Sacramento, CA

- Average decrease in July land surface temperature, 2016-2025: -0.7°F per year
- Average July land surface temperature, 2025: 96.0°F
- Average July land surface temperature, 2016: 106.4°F
- Total population: 523,600
16. San Jose, CA
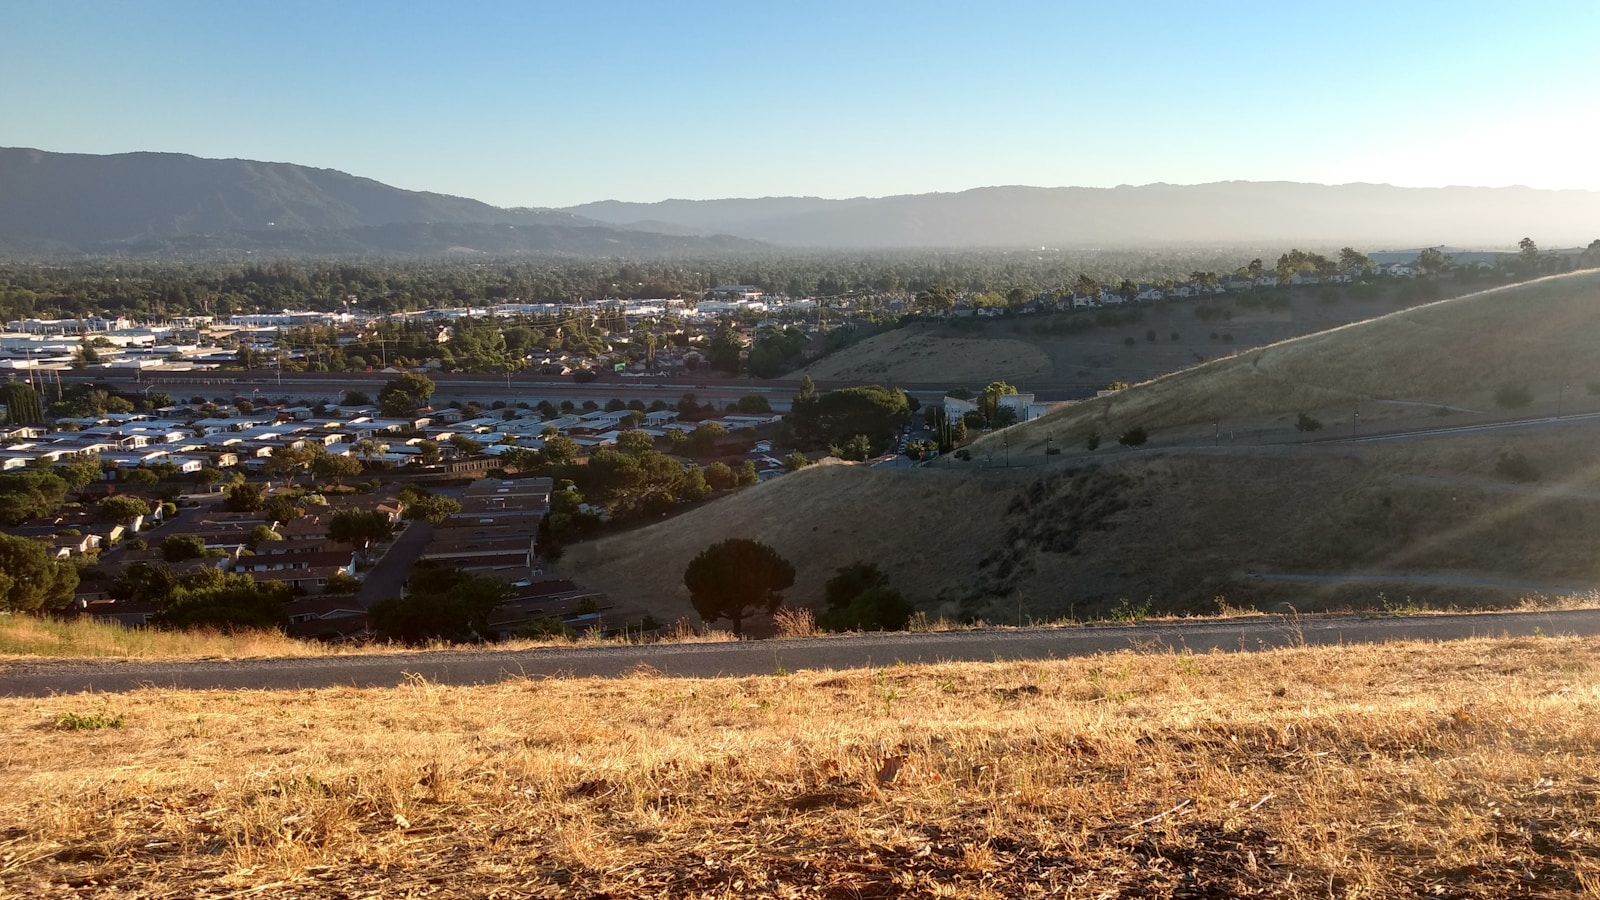
- Average decrease in July land surface temperature, 2016-2025: -0.7°F per year
- Average July land surface temperature, 2025: 94.1°F
- Average July land surface temperature, 2016: 104.2°F
- Total population: 1,001,176
15. Denver, CO
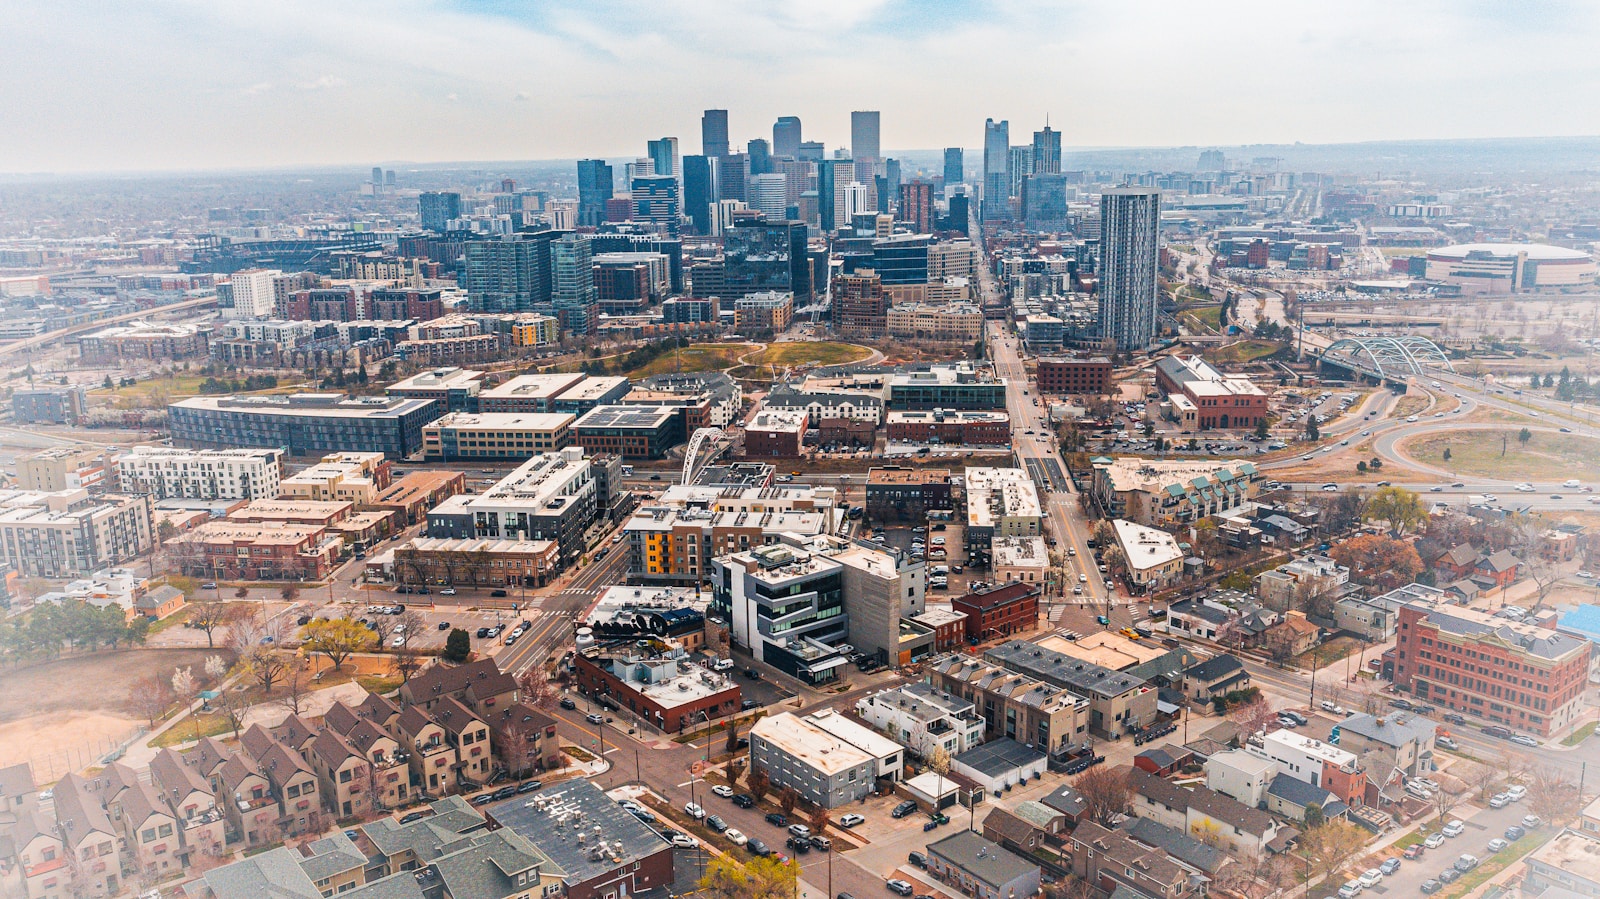
- Average decrease in July land surface temperature, 2016-2025: -0.7°F per year
- Average July land surface temperature, 2025: 100.9°F
- Average July land surface temperature, 2016: 106.1°F
- Total population: 710,800
14. Stockton, CA

- Average decrease in July land surface temperature, 2016-2025: -0.7°F per year
- Average July land surface temperature, 2025: 94.6°F
- Average July land surface temperature, 2016: 104.8°F
- Total population: 320,030
13. Aurora, CO

- Average decrease in July land surface temperature, 2016-2025: -0.8°F per year
- Average July land surface temperature, 2025: 100.2°F
- Average July land surface temperature, 2016: 105.4°F
- Total population: 387,349
12. Laredo, TX

- Average decrease in July land surface temperature, 2016-2025: -0.8°F per year
- Average July land surface temperature, 2025: 98.3°F
- Average July land surface temperature, 2016: 105.1°F
- Total population: 255,293
11. Lubbock, TX
- Average decrease in July land surface temperature, 2016-2025: -0.8°F per year
- Average July land surface temperature, 2025: 97.2°F
- Average July land surface temperature, 2016: 111.6°F
- Total population: 258,190
10. San Diego, CA

- Average decrease in July land surface temperature, 2016-2025: -0.8°F per year
- Average July land surface temperature, 2025: 90.3°F
- Average July land surface temperature, 2016: 99.8°F
- Total population: 1,383,987
9. Chula Vista, CA

- Average decrease in July land surface temperature, 2016-2025: -0.8°F per year
- Average July land surface temperature, 2025: 93.3°F
- Average July land surface temperature, 2016: 102.8°F
- Total population: 276,103
8. Los Angeles, CA

- Average decrease in July land surface temperature, 2016-2025: -0.9°F per year
- Average July land surface temperature, 2025: 95.1°F
- Average July land surface temperature, 2016: 105.3°F
- Total population: 3,881,041
7. Long Beach, CA
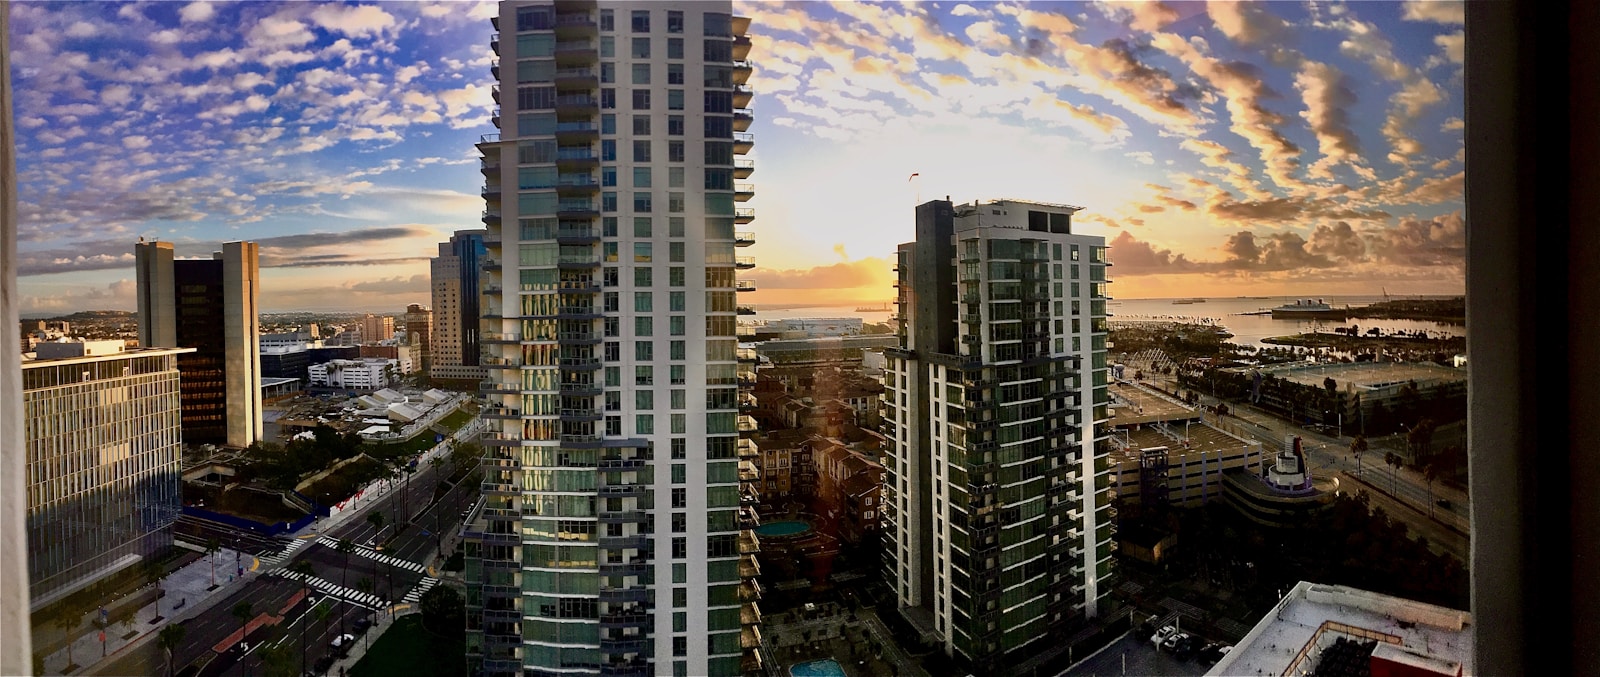
- Average decrease in July land surface temperature, 2016-2025: -0.9°F per year
- Average July land surface temperature, 2025: 93.6°F
- Average July land surface temperature, 2016: 103.4°F
- Total population: 462,293
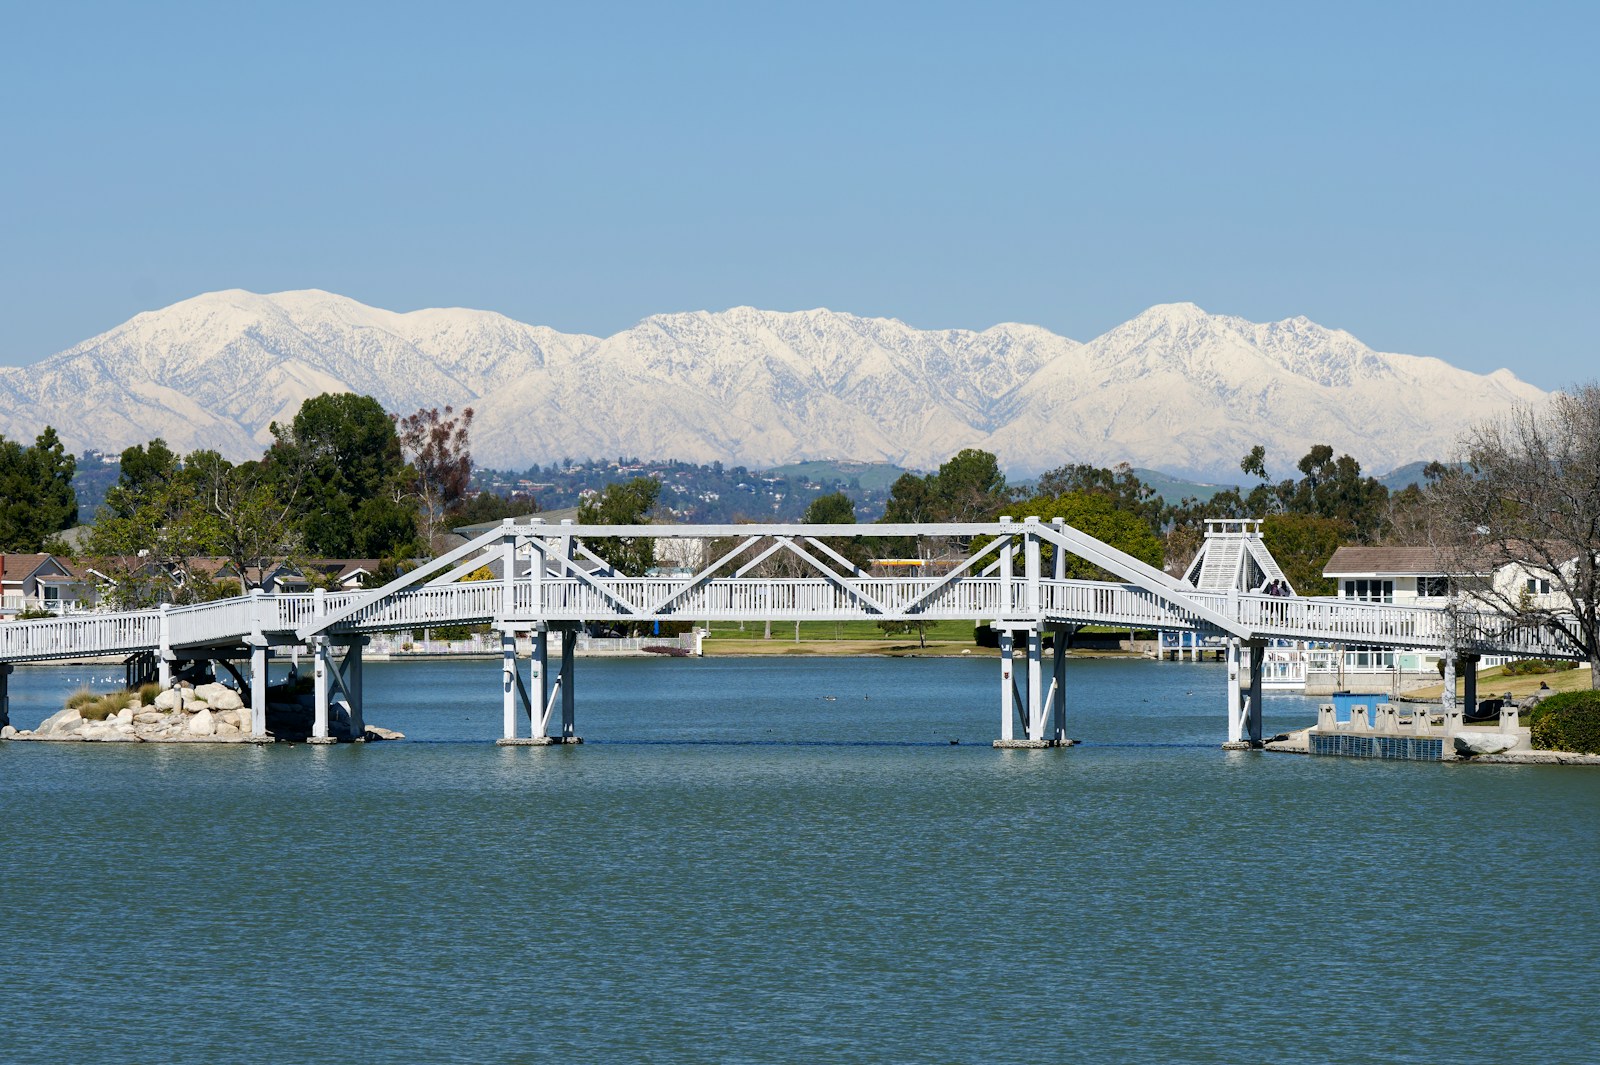
6. Riverside, CA

- Average decrease in July land surface temperature, 2016-2025: -0.9°F per year
- Average July land surface temperature, 2025: 101.9°F
- Average July land surface temperature, 2016: 113.7°F
- Total population: 316,076
5. El Paso, TX
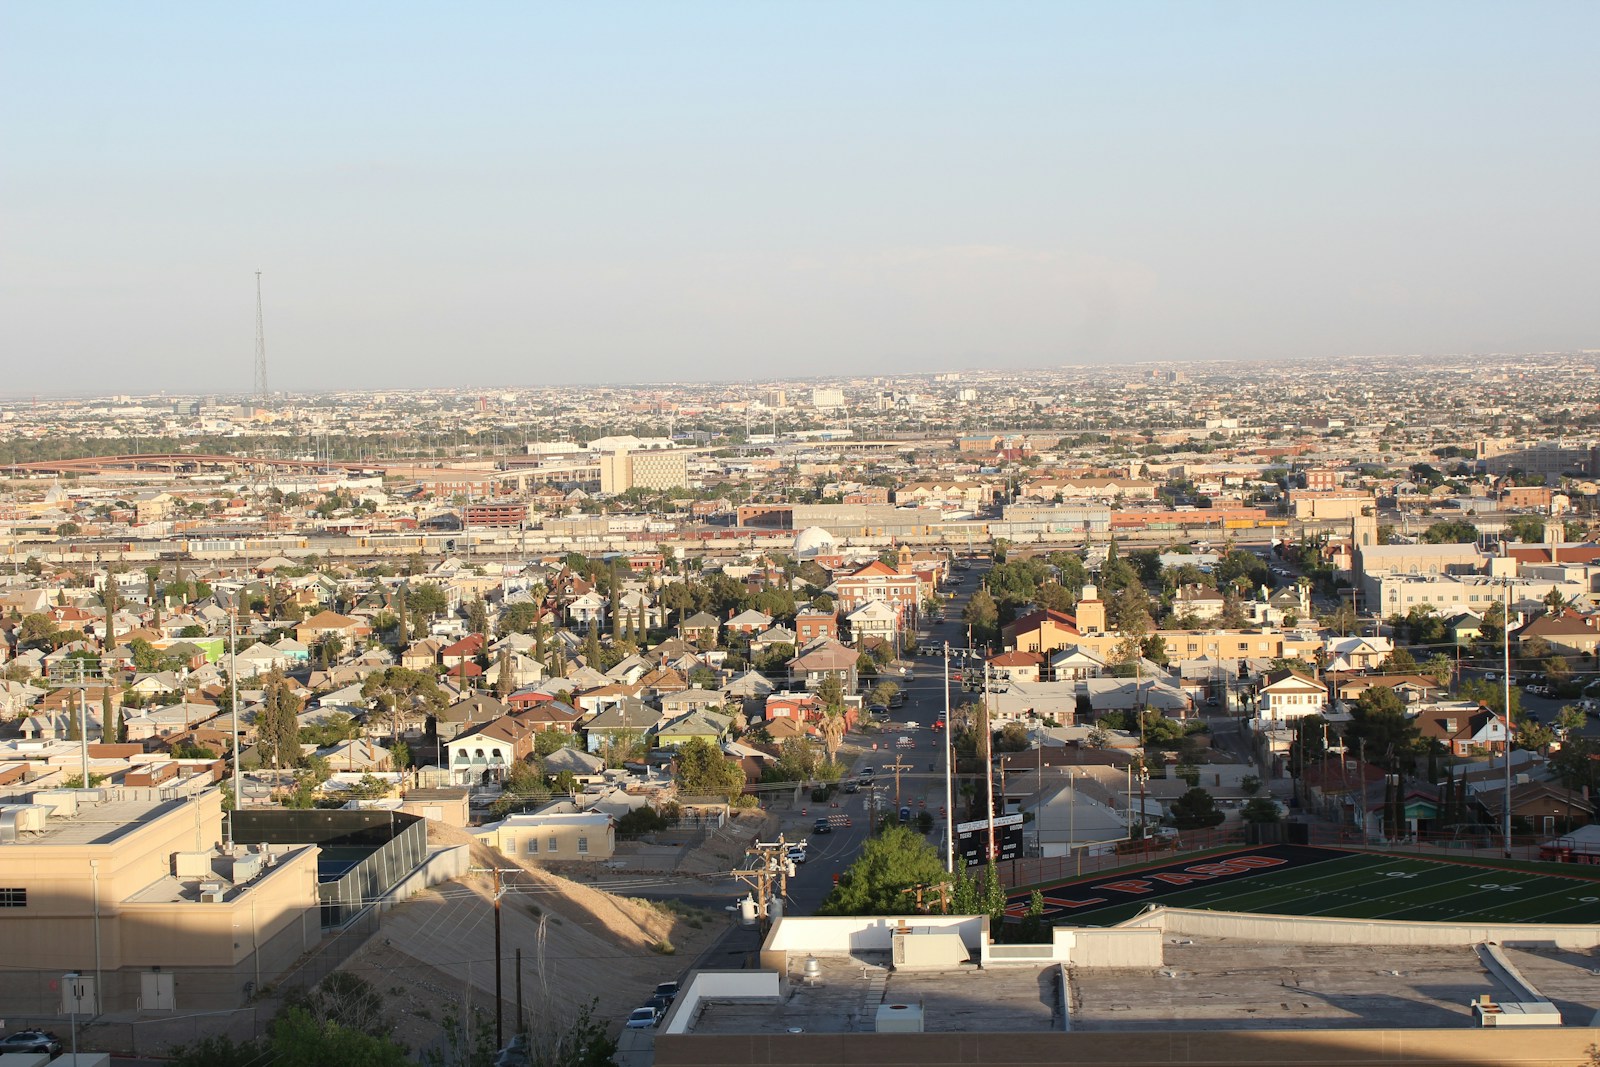
- Average decrease in July land surface temperature, 2016-2025: -0.9°F per year
- Average July land surface temperature, 2025: 101.1°F
- Average July land surface temperature, 2016: 118.6°F
- Total population: 677,181
4. Albuquerque, NM
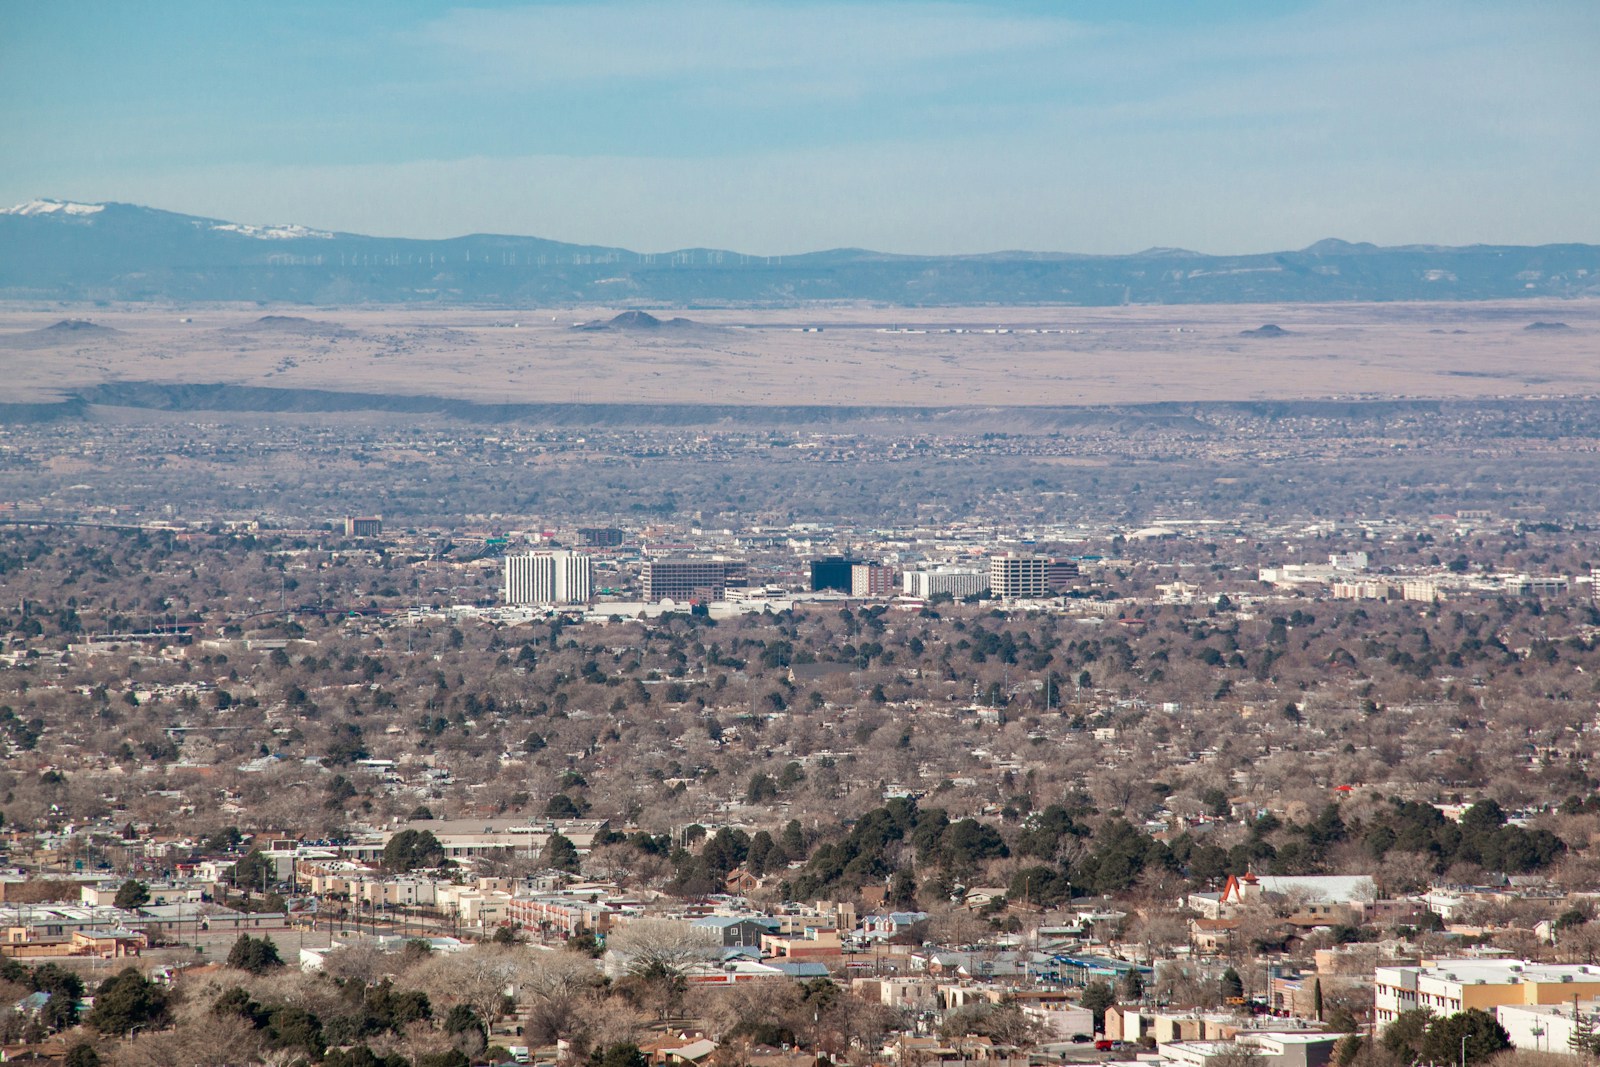
- Average decrease in July land surface temperature, 2016-2025: -1.0°F per year
- Average July land surface temperature, 2025: 103.4°F
- Average July land surface temperature, 2016: 117.7°F
- Total population: 562,551
3. Anaheim, CA

- Average decrease in July land surface temperature, 2016-2025: -1.0°F per year
- Average July land surface temperature, 2025: 98.5°F
- Average July land surface temperature, 2016: 110.8°F
- Total population: 347,111
2. Santa Ana, CA
- Average decrease in July land surface temperature, 2016-2025: -1.1°F per year
- Average July land surface temperature, 2025: 97.2°F
- Average July land surface temperature, 2016: 109.7°F
- Total population: 311,379
1. Irvine, CA
- Average decrease in July land surface temperature, 2016-2025: -1.1°F per year
- Average July land surface temperature, 2025: 92.3°F
- Average July land surface temperature, 2016: 105.2°F
- Total population: 304,527