Triple-Digit Heat to Scorch The West in First Major Heat Event of 2025
 https://climate-crisis-247-bucket.nyc3.cdn.digitaloceanspaces.com/wp-content/uploads/2025/05/07221028/1431822-1-150x150.jpeg
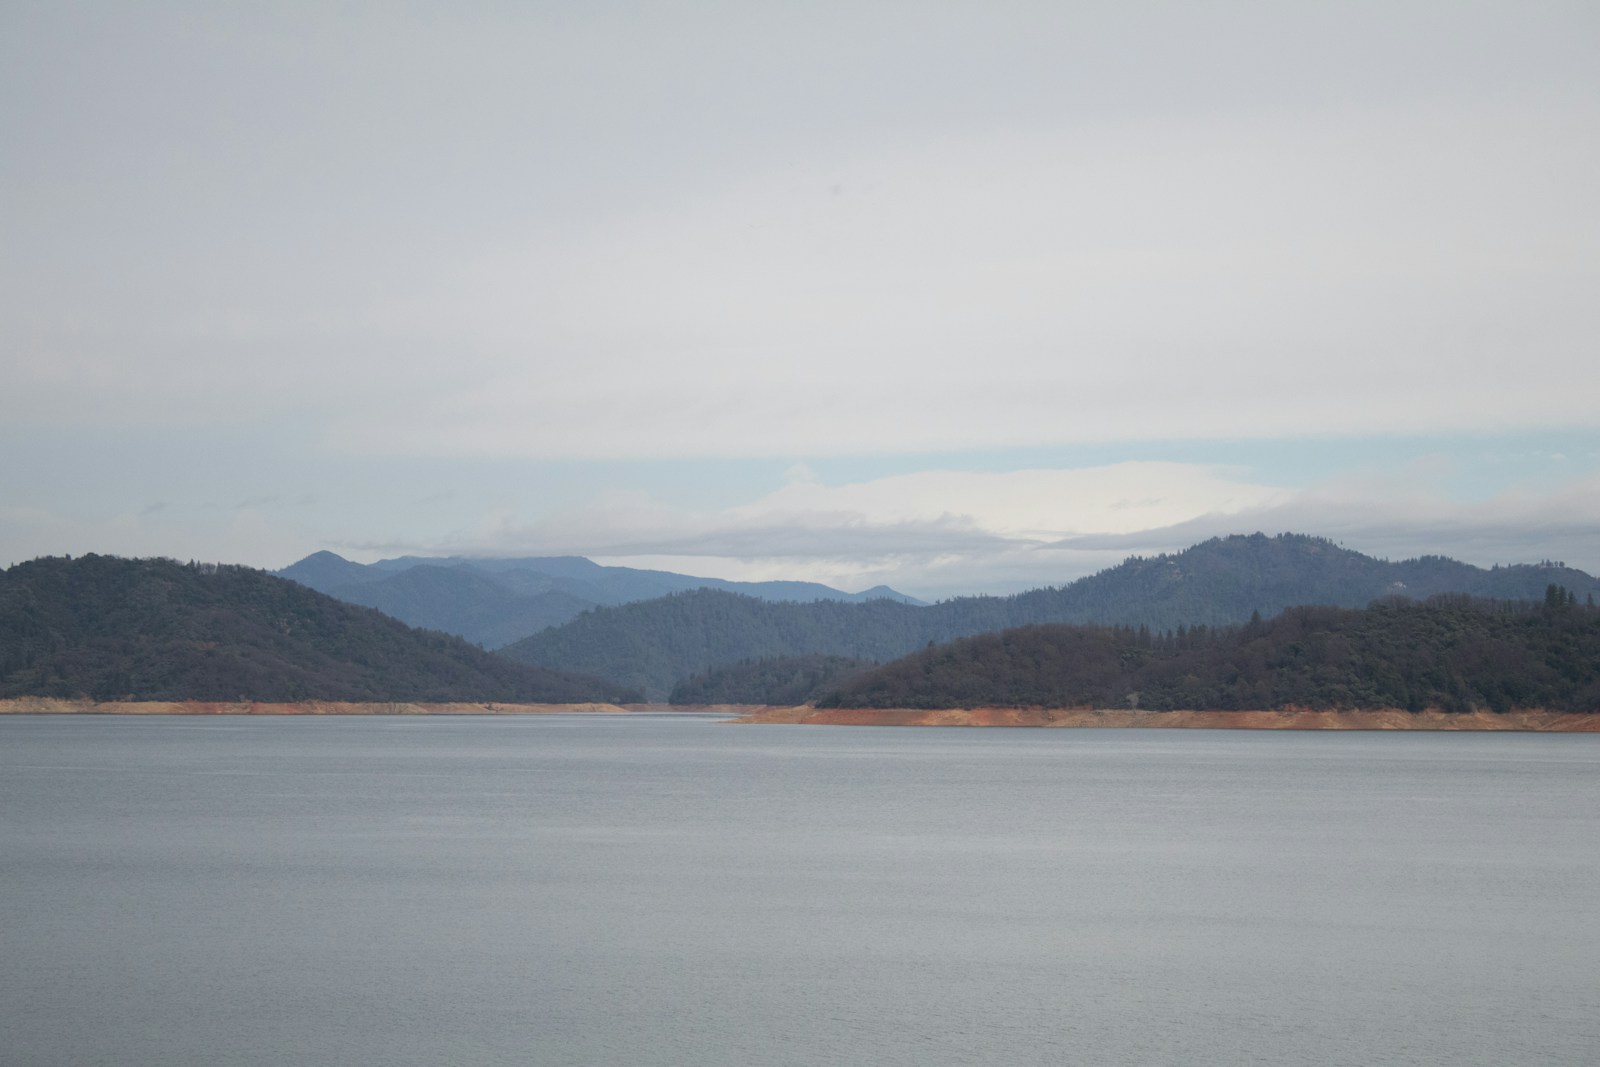
While some parts of the country are still shivering from an abnormally cold Memorial Day weekend, California is heading into its first widespread heat event of 2025. A sprawling ridge of high pressure is forecast to park itself over the western U.S. later this week, sending temperatures soaring and fire risk spiking, especially across the Central Valley and interior Northern California.
DOGE backlash? The Federal Departments Americans Want To Keep
Dying for air? Climate Activism Is Turning Deadly In These Cities
Forecast models show daytime highs over the next six days climbing well into the triple digits in several major cities. The National Weather Service issued a heat advisory stretching from Bakersfield to Redding, and an extreme heat watch covering Las Vegas and the Mojave Desert. The high in Redding is forecast to reach 106.9°F on Friday, while dozens of cities are forecast to experience daily highs more than 20 degrees above normal throughout the week. A closer look at the data reveals the cities where the heat wave will be the worst this week.
To determine the cities where it will be abnormally warm this week, Climate Crisis 247 reviewed temperature forecasts and historical station-level daily temperature readings from the NOAA. Cities were ranked based on the difference between the forecast maximum temperature for May 28-June 2, 2025, and the average observed minimum temperature for May 28-June 2 from 2006 to 2020. Gridded forecast data are from the National Digital Forecast Database, while historical temperature normals are from the Global Historical Climatology Network daily program of the National Centers for Environmental Information. Weather stations were matched to places using nearest neighbor analysis and were limited to cities within 50 miles of the city centroid. Only cities with at least 25,000 residents were considered.
25. Clovis, CA

- Forecast average maximum, May 28 to June 2: 96.2°F (+13.8°F above normal)
- Normal average maximum, May 28 to June 2: 82.4°F (2006-2020)
- Total population: 120,607
24. Bozeman, MT
- Forecast average maximum, May 28 to June 2: 76.8°F (+14.5°F above normal)
- Normal average maximum, May 28 to June 2: 62.3°F (2006-2020)
- Total population: 53,500
23. Bountiful, UT

- Forecast average maximum, May 28 to June 2: 87.3°F (+14.9°F above normal)
- Normal average maximum, May 28 to June 2: 72.4°F (2006-2020)
- Total population: 45,353
22. Roy, UT

- Forecast average maximum, May 28 to June 2: 87.7°F (+15.0°F above normal)
- Normal average maximum, May 28 to June 2: 72.7°F (2006-2020)
- Total population: 39,064
21. Arvada, CO
- Forecast average maximum, May 28 to June 2: 75.5°F (+15.7°F above normal)
- Normal average maximum, May 28 to June 2: 59.8°F (2006-2020)
- Total population: 123,066
20. Reedley, CA

- Forecast average maximum, May 28 to June 2: 95.9°F (+15.8°F above normal)
- Normal average maximum, May 28 to June 2: 80.1°F (2006-2020)
- Total population: 25,248
19. Eagle, ID

- Forecast average maximum, May 28 to June 2: 87.3°F (+15.9°F above normal)
- Normal average maximum, May 28 to June 2: 71.5°F (2006-2020)
- Total population: 30,635
18. Nampa, ID

- Forecast average maximum, May 28 to June 2: 87.9°F (+16.1°F above normal)
- Normal average maximum, May 28 to June 2: 71.8°F (2006-2020)
- Total population: 102,598
17. Alamogordo, NM
- Forecast average maximum, May 28 to June 2: 88.9°F (+16.5°F above normal)
- Normal average maximum, May 28 to June 2: 72.4°F (2006-2020)
- Total population: 30,996
16. Merced, CA
- Forecast average maximum, May 28 to June 2: 94.7°F (+16.6°F above normal)
- Normal average maximum, May 28 to June 2: 78.1°F (2006-2020)
- Total population: 87,686
15. Helena, MT
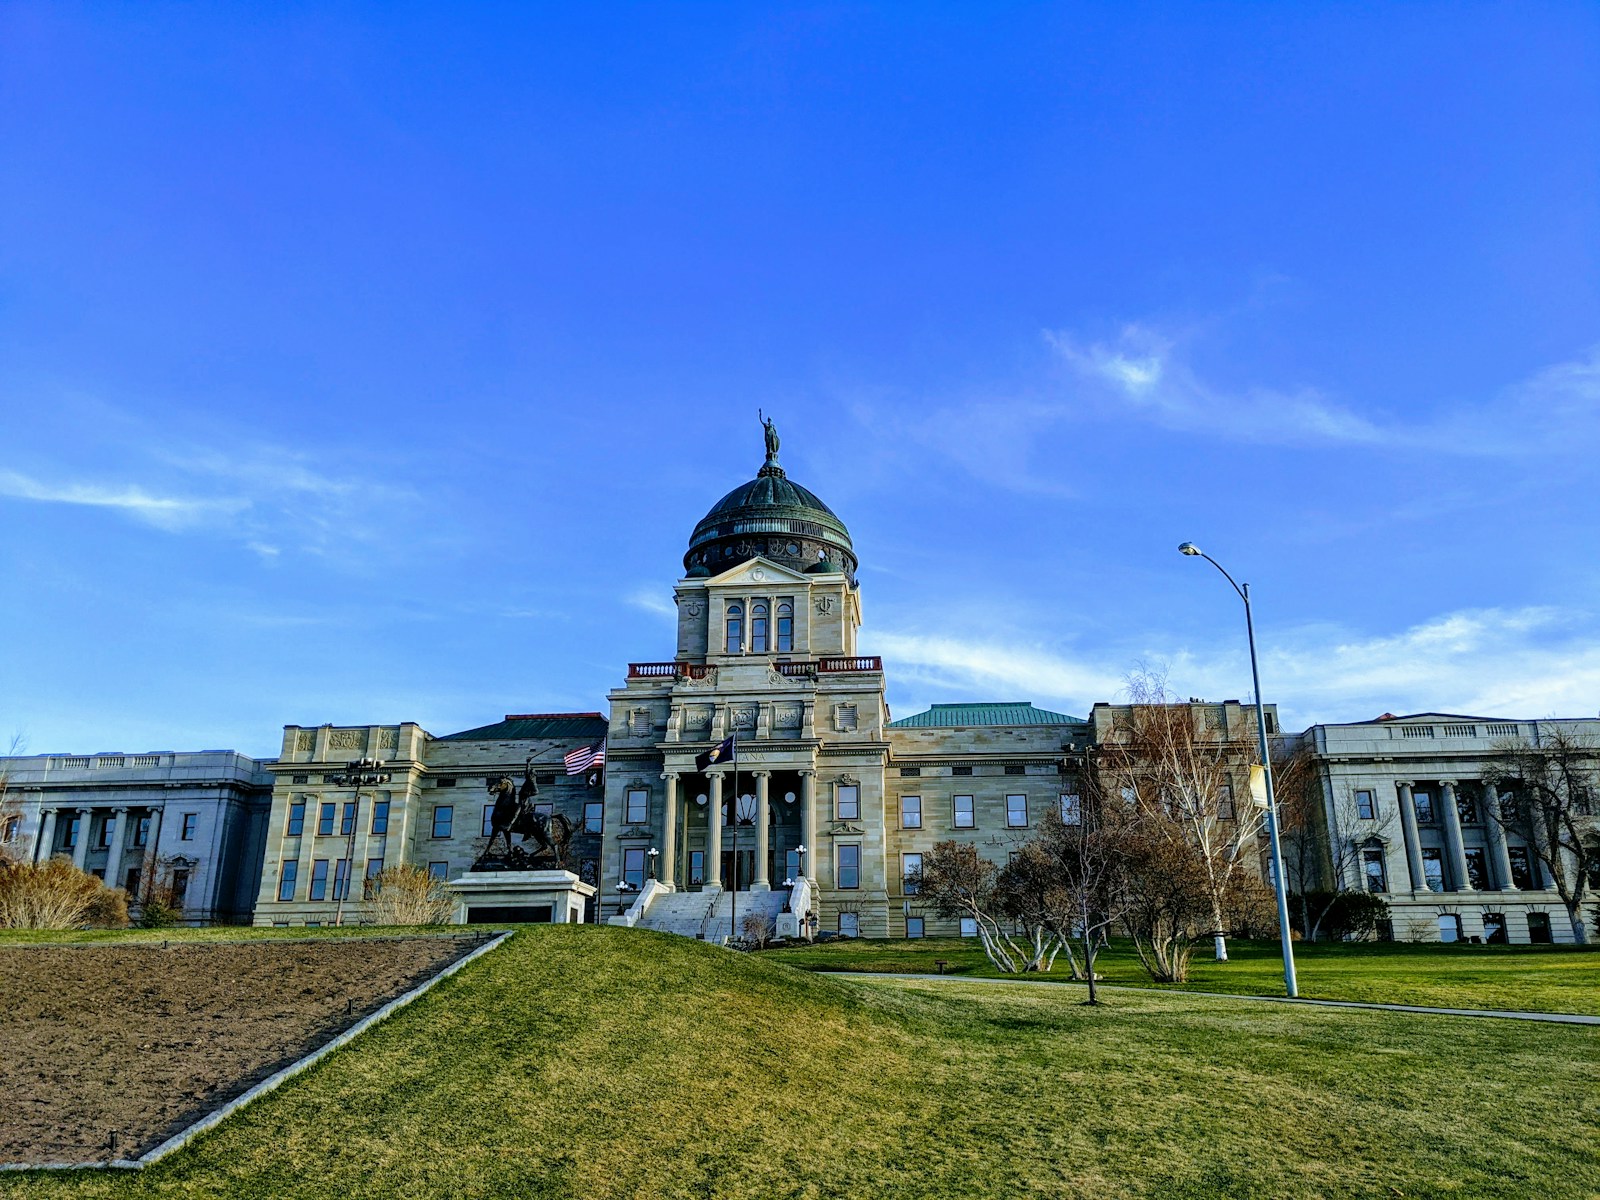
- Forecast average maximum, May 28 to June 2: 79.0°F (+16.6°F above normal)
- Normal average maximum, May 28 to June 2: 62.4°F (2006-2020)
- Total population: 32,529
14. Logan, UT

- Forecast average maximum, May 28 to June 2: 85.6°F (+16.8°F above normal)
- Normal average maximum, May 28 to June 2: 68.8°F (2006-2020)
- Total population: 53,246
13. Lincoln, CA

- Forecast average maximum, May 28 to June 2: 94.7°F (+16.9°F above normal)
- Normal average maximum, May 28 to June 2: 77.7°F (2006-2020)
- Total population: 50,131
12. Ogden, UT

- Forecast average maximum, May 28 to June 2: 88.5°F (+17.0°F above normal)
- Normal average maximum, May 28 to June 2: 71.5°F (2006-2020)
- Total population: 86,754
11. Reno, NV
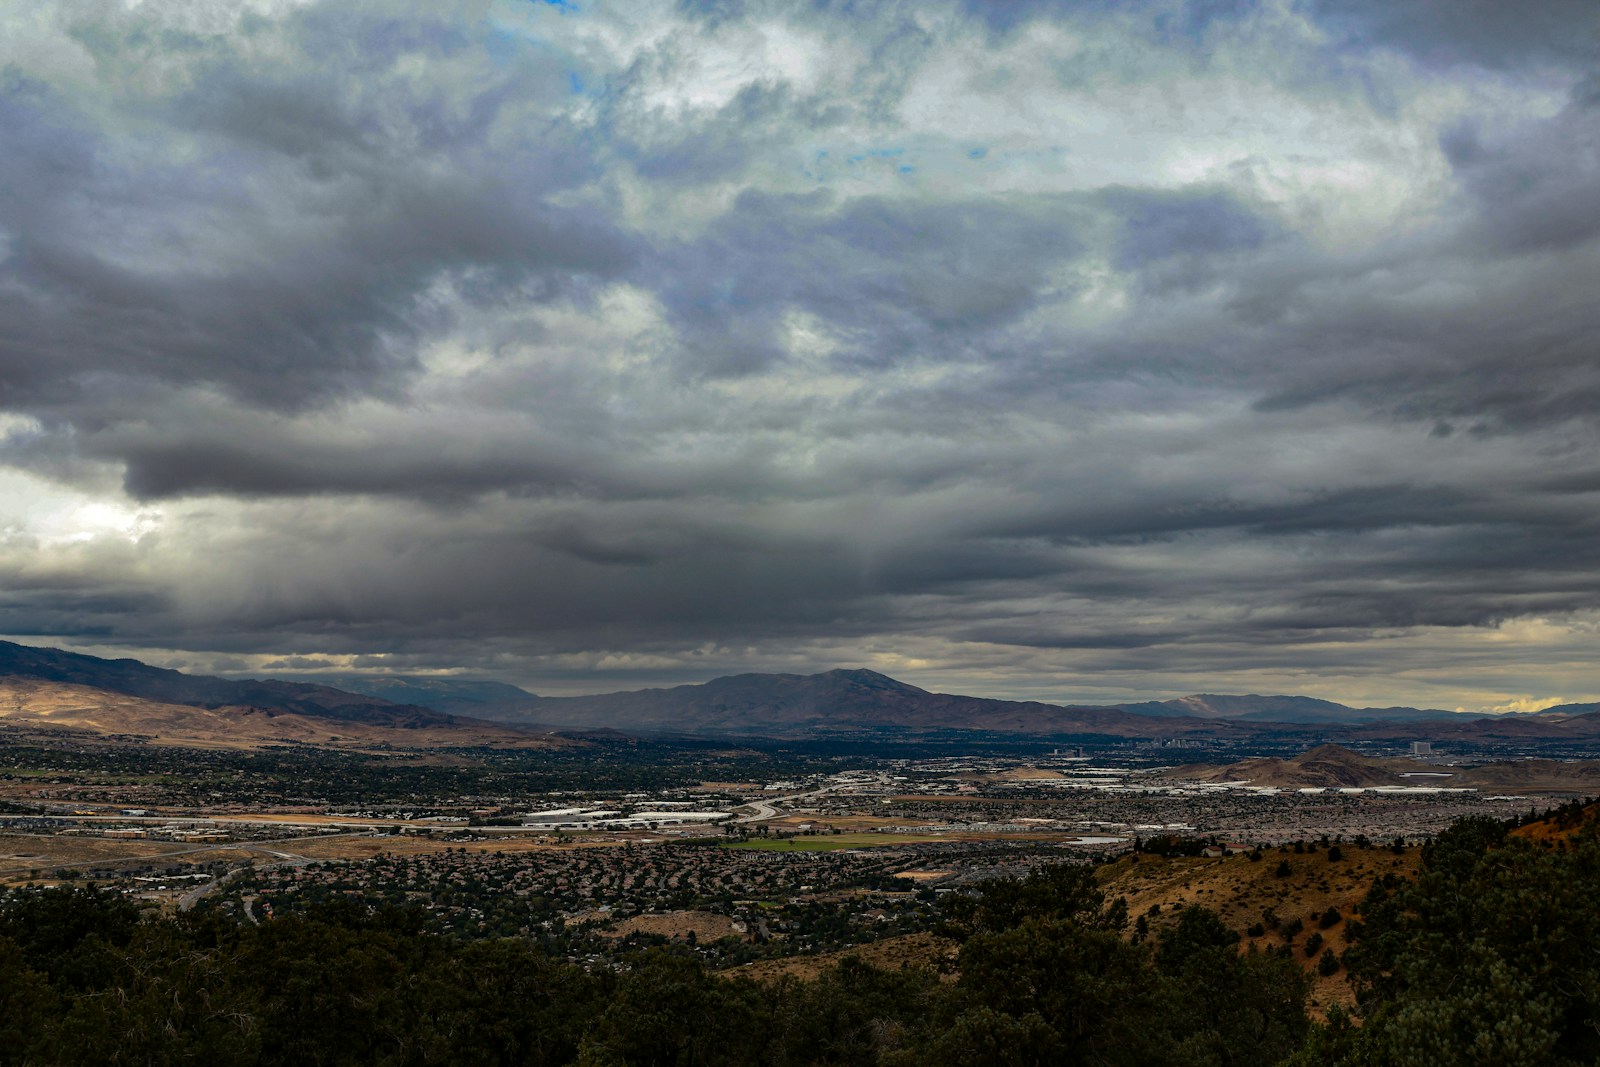
- Forecast average maximum, May 28 to June 2: 87.9°F (+17.7°F above normal)
- Normal average maximum, May 28 to June 2: 70.3°F (2006-2020)
- Total population: 265,196
10. Lewiston, ID

- Forecast average maximum, May 28 to June 2: 84.2°F (+17.8°F above normal)
- Normal average maximum, May 28 to June 2: 66.4°F (2006-2020)
- Total population: 34,270
9. Carson City, NV
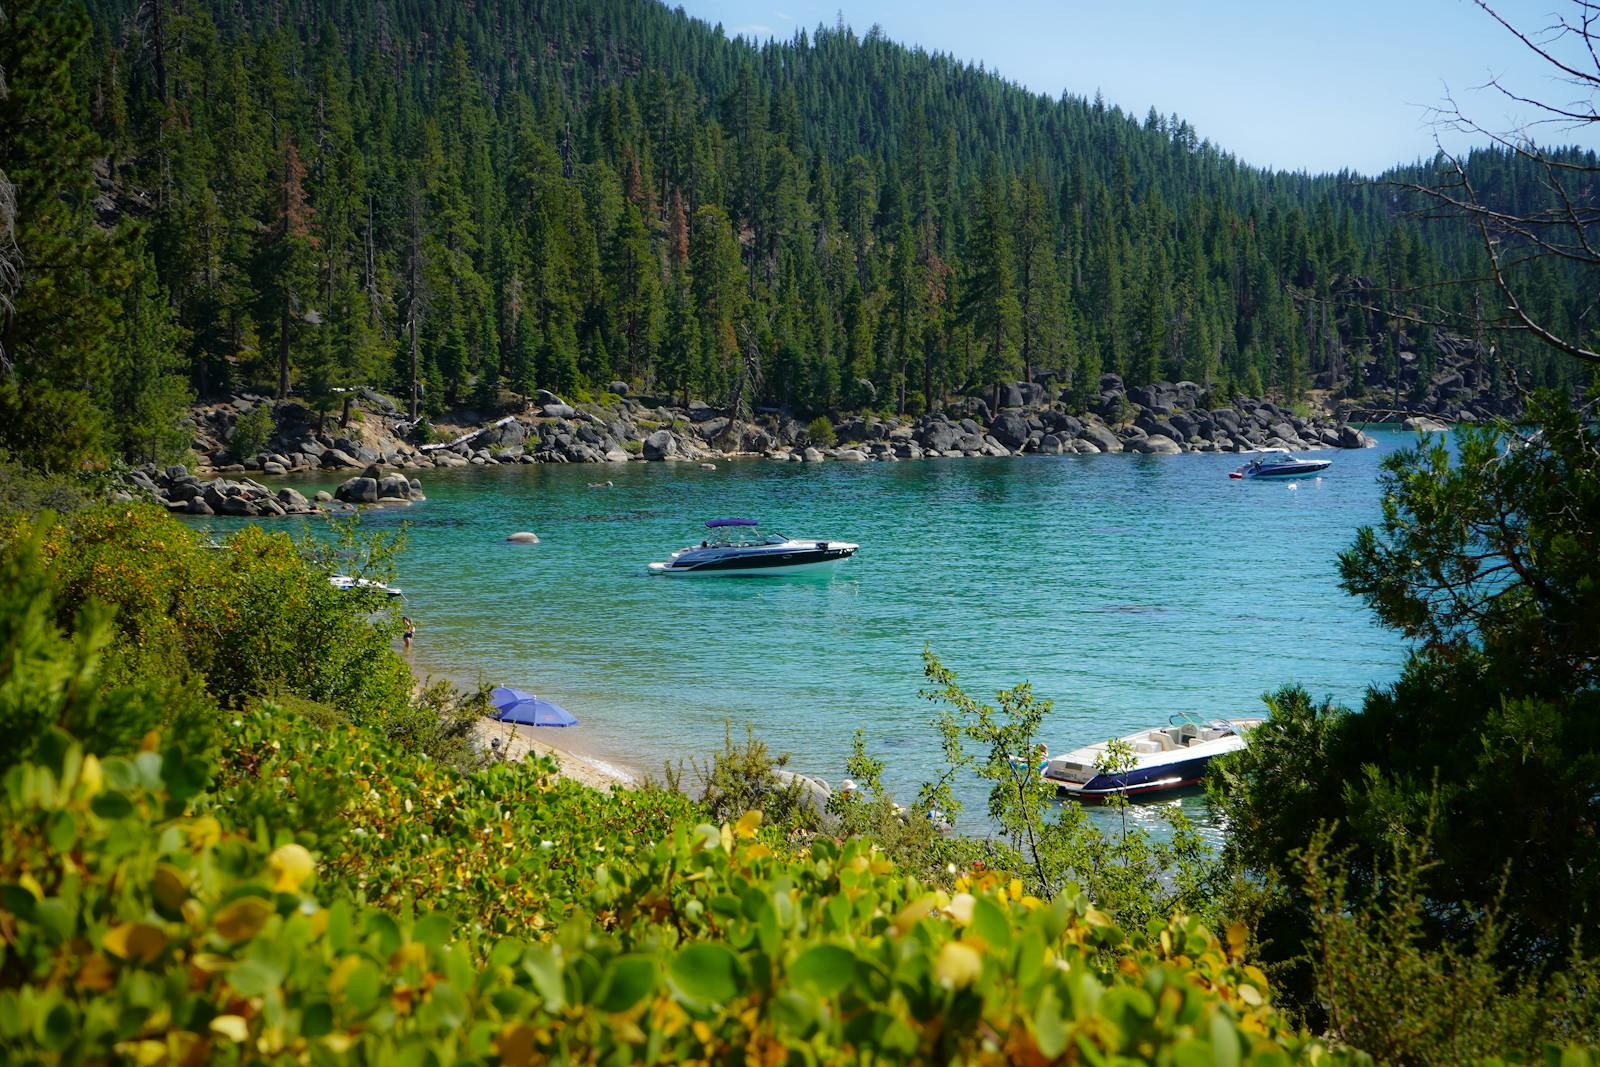
- Forecast average maximum, May 28 to June 2: 81.9°F (+18.3°F above normal)
- Normal average maximum, May 28 to June 2: 63.6°F (2006-2020)
- Total population: 58,249
8. Marana, AZ
- Forecast average maximum, May 28 to June 2: 96.5°F (+19.8°F above normal)
- Normal average maximum, May 28 to June 2: 76.7°F (2006-2020)
- Total population: 52,542
7. Palm Springs, CA

- Forecast average maximum, May 28 to June 2: 95.2°F (+20.0°F above normal)
- Normal average maximum, May 28 to June 2: 75.2°F (2006-2020)
- Total population: 44,935
6. Redding, CA
- Forecast average maximum, May 28 to June 2: 97.0°F (+20.7°F above normal)
- Normal average maximum, May 28 to June 2: 76.3°F (2006-2020)
- Total population: 93,327
5. El Dorado Hills, CA

- Forecast average maximum, May 28 to June 2: 91.0°F (+23.6°F above normal)
- Normal average maximum, May 28 to June 2: 67.4°F (2006-2020)
- Total population: 49,082
4. Chico, CA

- Forecast average maximum, May 28 to June 2: 96.0°F (+23.6°F above normal)
- Normal average maximum, May 28 to June 2: 72.4°F (2006-2020)
- Total population: 102,790
3. Pahrump, NV

- Forecast average maximum, May 28 to June 2: 96.2°F (+27.6°F above normal)
- Normal average maximum, May 28 to June 2: 68.7°F (2006-2020)
- Total population: 44,711
2. Sandy, UT

- Forecast average maximum, May 28 to June 2: 88.0°F (+29.4°F above normal)
- Normal average maximum, May 28 to June 2: 58.7°F (2006-2020)
- Total population: 95,635
1. Visalia, CA
- Forecast average maximum, May 28 to June 2: 96.5°F (+33.0°F above normal)
- Normal average maximum, May 28 to June 2: 63.5°F (2006-2020)
- Total population: 141,466
Sponsor
Find a Vetted Financial Advisor
- Finding a fiduciary financial advisor doesn't have to be hard. SmartAsset's free tool matches you with up to 3 financial advisors that serve your area in 5 minutes.
- Each advisor has been vetted by SmartAsset and is held to a fiduciary standard to act in your best interests. Get on the path toward achieving your financial goals!