Where the Most Americans Are at Risk of Power Plant Emissions
 https://climate-crisis-247-bucket.nyc3.digitaloceanspaces.com/wp-content/uploads/2025/10/19202819/jbfhnrpq_dw-150x150.jpg
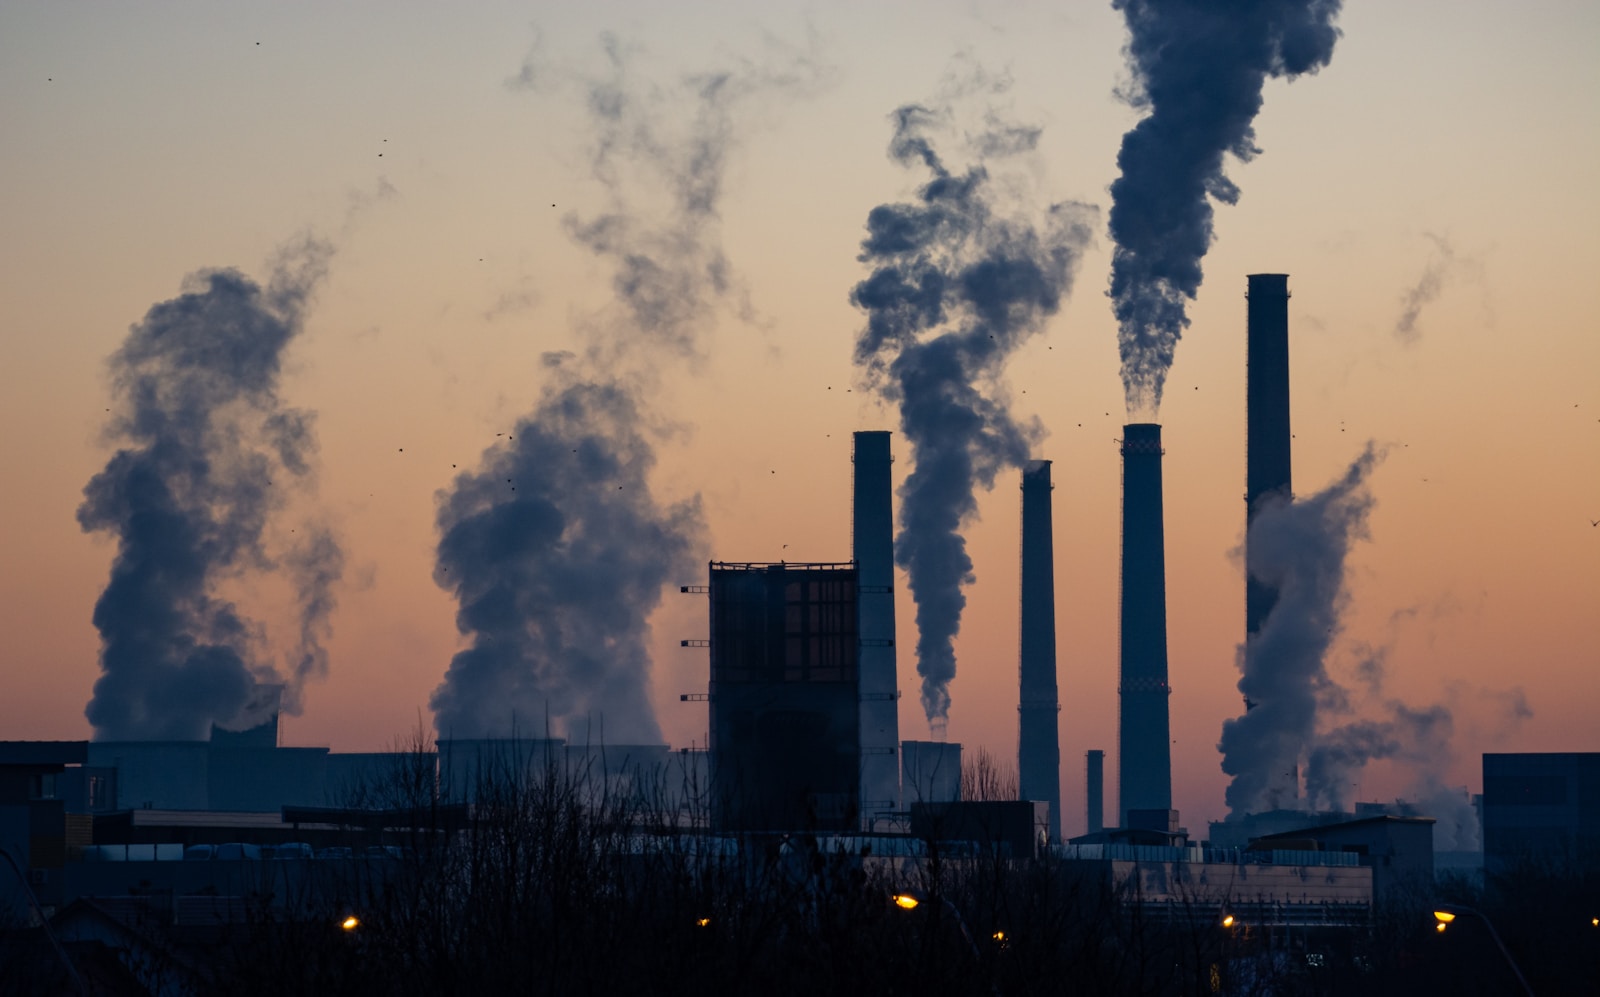
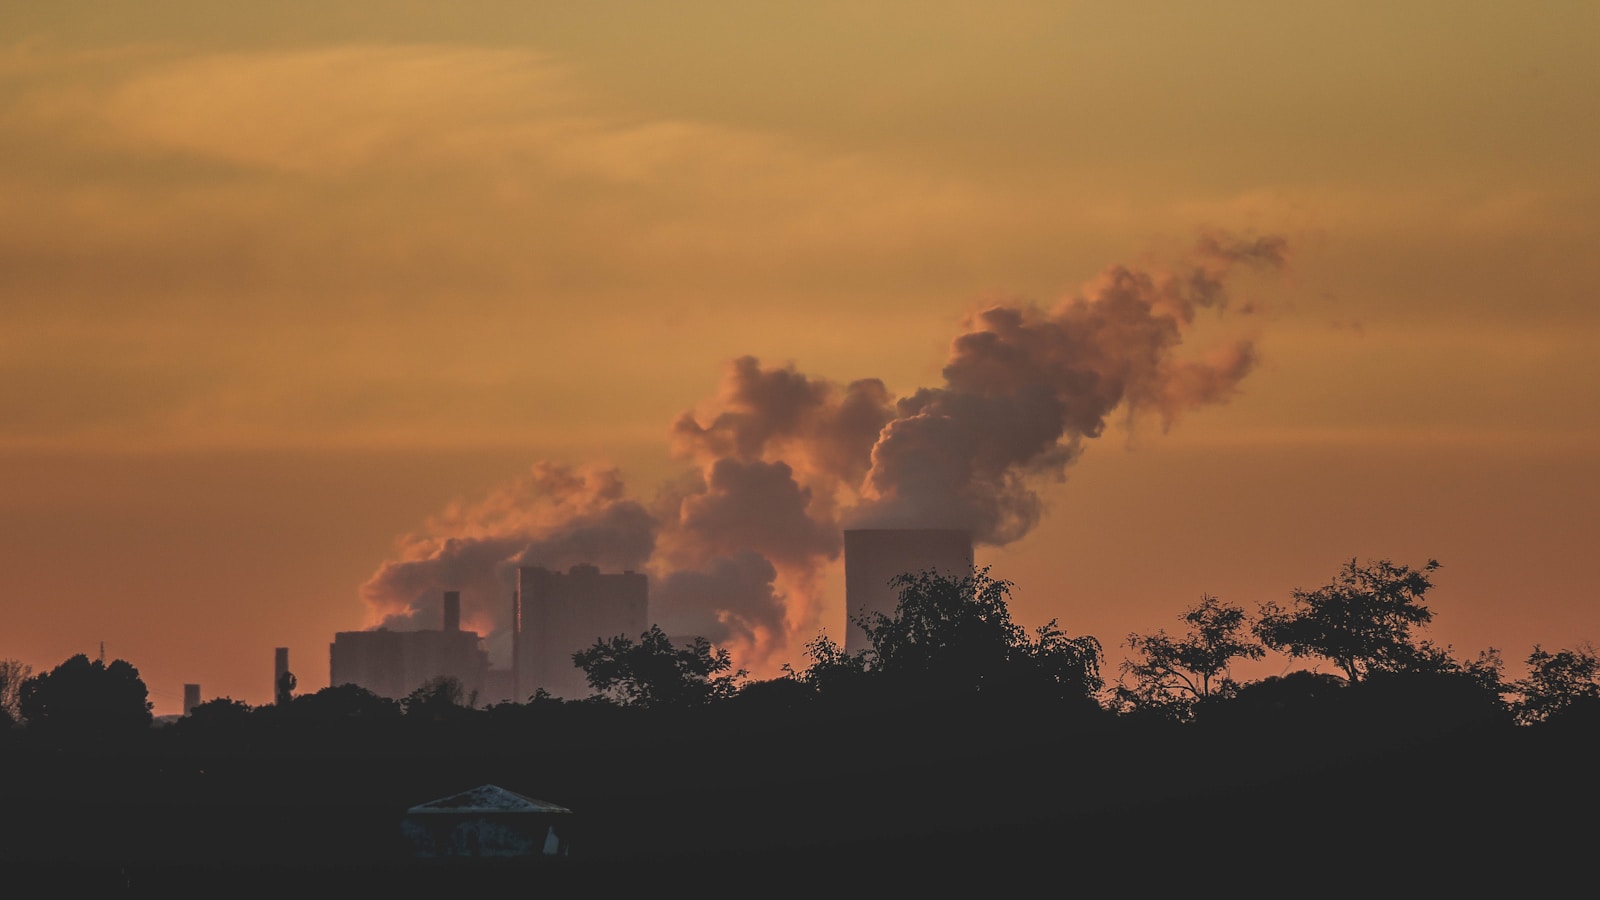
Across the United States, a handful of coal- and gas-fired power plants account for a disproportionate share of the nation’s air pollution. These facilities release millions of tons of carbon dioxide every year, along with harmful particulate matter and nitrogen oxides that drift downwind into surrounding communities.
Hot property? From Maui to Malibu, These Affluent Enclaves Are Becoming Wildfire Hotspots
Whence the next pandemic? Cities Where the Next Pandemic Is Most Likely to Break Out
While the health risks of air pollution are national in scope, certain counties sit directly in the path of the country’s largest and dirtiest power plants. As the EPA works to roll back dozens of regulations on emitters, downwind communities are particularly at risk of respiratory illness, heart disease, and premature death. A closer look at the data reveals where the most Americans are at risk from power plant emissions.
To determine where the most Americans are at risk from power plant emissions, Climate Crisis 247 reviewed data on power plant emissions from the EPA. Power plants were ranked based on total annual carbon dioxide emissions. Supplemental data on annual particulate matter emissions, nitrogen oxides emissions, and downstream population impacted by each power plant are also from the EPA. Estimates for the downstream population impacted by each power plant’s emissions are based on the EPA’s Power Plants and Neighboring Communities Mapping Tool.
10. Sweetwater County, WY (Jim Bridger Power Plant)

- Annual CO2 emissions: 12.2 million tons
- Annual PM2.5 emissions: 726 tons
- Annual nitrogen oxides emissions: 6,552 tons
- Total downstream population impacted by power plant: 6.2 million
9. Gallia County, OH (General James M. Gavin Power Plant)

- Annual CO2 emissions: 12.3 million tons
- Annual PM2.5 emissions: 624 tons
- Annual nitrogen oxides emissions: 5,571 tons
- Total downstream population impacted by power plant: 69.1 million
8. Platte County, WY (Laramie River Station)

- Annual CO2 emissions: 12.6 million tons
- Annual PM2.5 emissions: 83 tons
- Annual nitrogen oxides emissions: 7,077 tons
- Total downstream population impacted by power plant: 7.2 million
7. Harrison County, WV (Harrison Power Station)

- Annual CO2 emissions: 12.8 million tons
- Annual PM2.5 emissions: 1,432 tons
- Annual nitrogen oxides emissions: 4,492 tons
- Total downstream population impacted by power plant: 59.4 million
6. Thompsons, TX (W.A. Parish Generating Station)

- Annual CO2 emissions: 13.6 million tons
- Annual PM2.5 emissions: 1,321 tons
- Annual nitrogen oxides emissions: 5,232 tons
- Total downstream population impacted by power plant: 63.3 million
5. Robertson County, TX (Oak Grove Power Plant)

- Annual CO2 emissions: 13.9 million tons
- Annual PM2.5 emissions: 1,890 tons
- Annual nitrogen oxides emissions: 4,591 tons
- Total downstream population impacted by power plant: 37.8 million
4. Rusk County, TX (Martin Lake Power Plant)

- Annual CO2 emissions: 14.6 million tons
- Annual PM2.5 emissions: 995 tons
- Annual nitrogen oxides emissions: 9,000 tons
- Total downstream population impacted by power plant: 38.8 million
3. Monroe County, MI (Monroe Power Plant)

- Annual CO2 emissions: 16.3 million tons
- Annual PM2.5 emissions: 63 tons
- Annual nitrogen oxides emissions: 4,900 tons
- Total downstream population impacted by power plant: 77.9 million
2. Franklin County, MO (Labadie Power Plant)

- Annual CO2 emissions: 17.3 million tons
- Annual PM2.5 emissions: 1,476 tons
- Annual nitrogen oxides emissions: 7,763 tons
- Total downstream population impacted by power plant: 58.5 million
1. Jefferson County, AL (James H. Miller Jr. Electric Generating Plant)

- Annual CO2 emissions: 23.8 million tons
- Annual PM2.5 emissions: 218 tons
- Annual nitrogen oxides emissions: 7,538 tons
- Total downstream population impacted by power plant: 68.5 million
Sponsor
Find a Vetted Financial Advisor
- Finding a fiduciary financial advisor doesn't have to be hard. SmartAsset's free tool matches you with up to 3 financial advisors that serve your area in 5 minutes.
- Each advisor has been vetted by SmartAsset and is held to a fiduciary standard to act in your best interests. Get on the path toward achieving your financial goals!
More from ClimateCrisis 247
- The Jobs With the Most Workers Exposed to the Outdoors
- Countries With the Most Ambitious Climate Goals
- These 25 Cities Are Finding Ways to Lower Surface Temperature
- 16 Cities With Over 100 Days of Triple-Digit Temperatures Every Year
