Which States Are Ramping Up Nuclear Energy The Most?
 https://climate-crisis-247-bucket.nyc3.cdn.digitaloceanspaces.com/wp-content/uploads/2025/06/07214731/lwnd8u2oreu-150x150.jpg
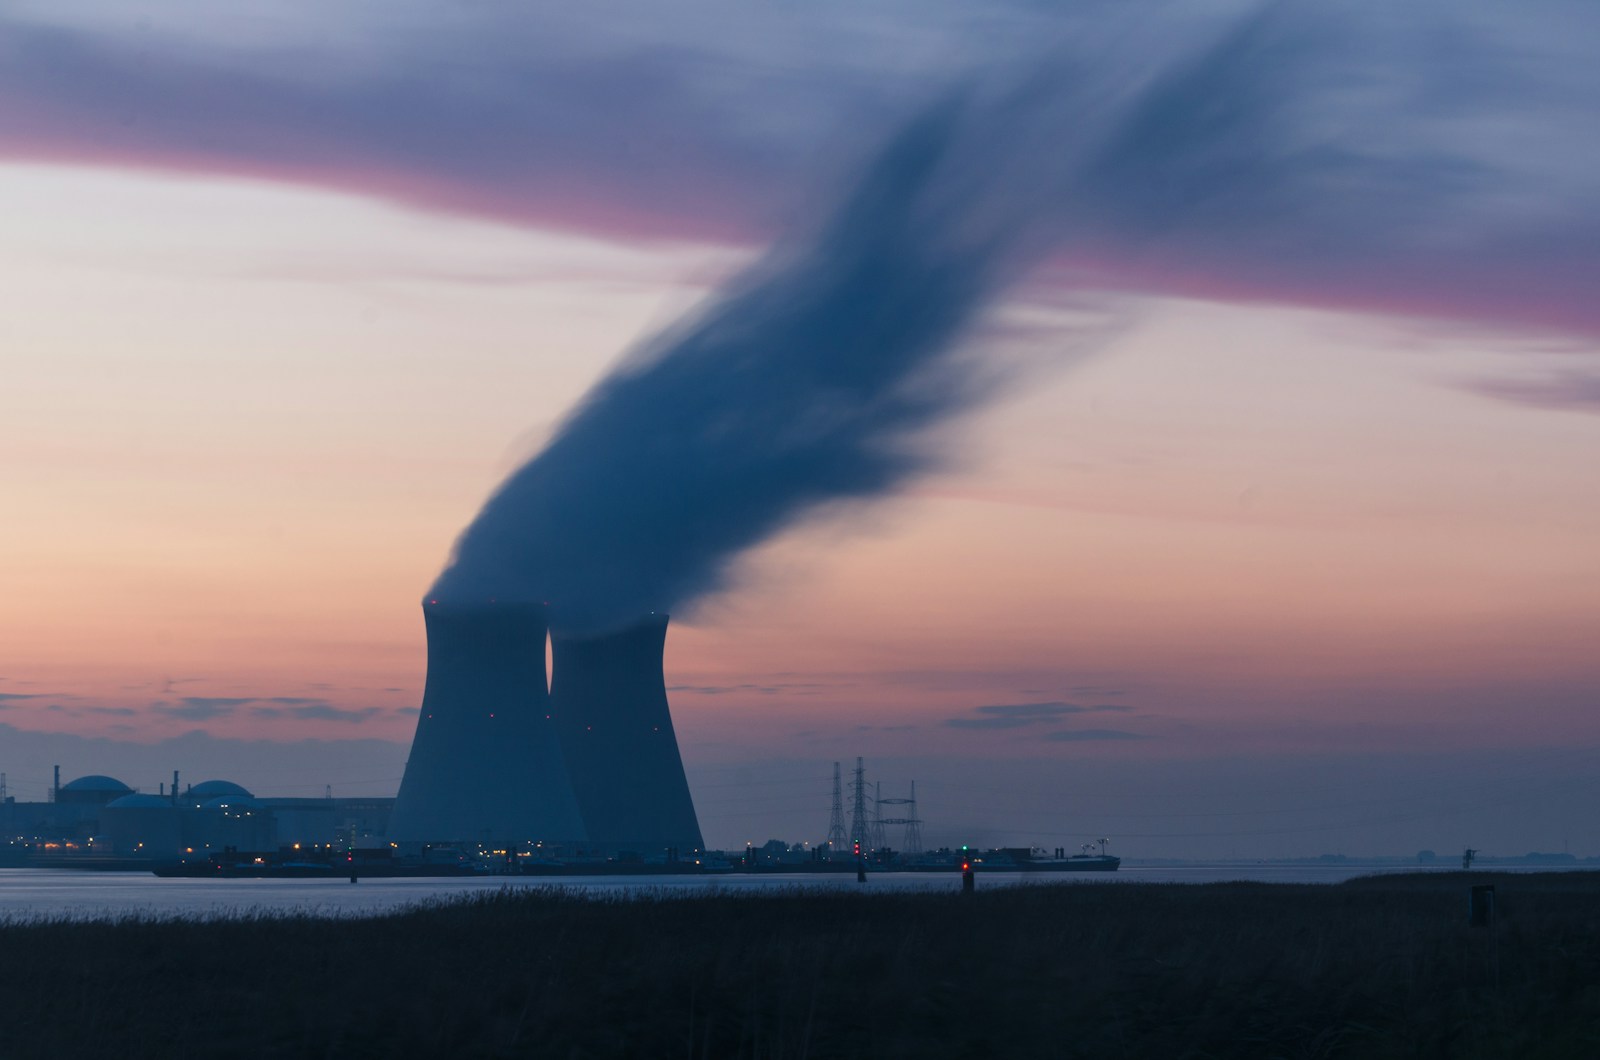
President Donald Trump recently signed a series of executive orders that will have major implications for U.S. energy policy and America’s power grid. The provisions of the orders include reorganizing the U.S. Nuclear Regulatory Commission, accelerating the nuclear licensing process, and ramping up support for nuclear infrastructure. The stated goal of these policies is to facilitate and incentivise the construction of new nuclear power plants and to quadruple America’s nuclear energy capacity by 2050.
According to the White House, these initiatives are necessary to maintain American energy independence in the face of growing demand, partially driven by technological advances – particularly those related to artificial intelligence. But regardless of whether these policies are sufficient to realize the president’s goals, increased reliance on nuclear power will confer several ancillary benefits.
Currently, the energy sector is one of the heaviest polluters in the United States. Data from the Environmental Protection Agency shows that 25% of the more than 6.3 billion metric tons of greenhouse gas emissions in 2022 were generated by electricity production. Air pollution generated by the U.S. energy sector is largely attributable to the power grid’s reliance on fossil fuels, like natural gas and coal – two sources which, together, currently account for nearly 60% of all electricity production in the United States.
Unlike coal and natural gas, however, nuclear reactors do not release harmful emissions into the atmosphere. Nuclear power plants are also far more reliable than intermittent clean energy sources, like wind and solar. Nuclear power is also more efficient, as a solar plant requires 46 times the amount of land area to produce the same amount of energy as a nuclear facility, according to the International Atomic Energy Agency.
The recent measures taken by the Trump administration will present a break from the longer-term trend of stagnation in U.S. nuclear energy production. Over the course of the 21st century so far, nuclear energy production has increased nationwide by a marginal 1.7%. Notably, American nuclear energy production has also fallen by 1% in the last five years, and by 1.9% in the last decade.
Still, it is important to note that each state has its own unique energy mix, and despite the broader national trend, many states have meaningfully ramped up nuclear energy production in recent years.
Using data from the U.S. Energy Information Administration, Climate Crisis 247 identified the states that have ramped up nuclear energy production the most so far this century. States are ranked on the relative change in the total amount of nuclear power generated from 2001 to 2024. Only the 16 states where the change in nuclear power generation in the 21st century exceeds the 1.7% national increase were considered.
Among the states on this list, nuclear energy production has increased by anywhere from 2.3% to 46.5% between 2001 and 2024. The states on this list include New York, which is home to Nine Mile Point’s Unit 1, the oldest nuclear reactor still in operation, as well as Georgia, where the Alvin W. Vogtle plant houses the newest nuclear reactor to come online in the United States.
16. Pennsylvania

- Change in nuclear power generation; 2001-2024: +2.3% (+1.7 million megawatt hours)
- Nuclear power generation by year: 75.4 million megawatt hours in 2024; 73.7 million megawatt hours in 2021
- Peak nuclear energy production in 21st century: 83.5 million megawatt hours in 2018Nuclear power plants in state include: Beaver Valley, Limerick, Peach Bottom, TalenEnergy Susquehanna
15. Illinois

- Change in nuclear power generation; 2001-2024: +7.4% (+6.9 million megawatt hours)
- Nuclear power generation by year: 99.2 million megawatt hours in 2024; 92.4 million megawatt hours in 2021
- Peak nuclear energy production in 21st century: 100.2 million megawatt hours in 2020
- Nuclear power plants in state include: Braidwood Generation Station, Byron Generating Station, Clinton Power Station, Dresden Generating Station, LaSalle Generating Station, Quad Cities Generating Station
14. Mississippi

- Change in nuclear power generation; 2001-2024: +7.7% (+0.8 million megawatt hours)
- Nuclear power generation by year: 10.7 million megawatt hours in 2024; 9.9 million megawatt hours in 2021
- Peak nuclear energy production in 21st century: 11.8 million megawatt hours in 2021
- Nuclear power plants in state include: Grand Gulf
13. South Carolina

- Change in nuclear power generation; 2001-2024: +7.8% (+3.9 million megawatt hours)
- Nuclear power generation by year: 53.8 million megawatt hours in 2024; 49.9 million megawatt hours in 2021
- Peak nuclear energy production in 21st century: 56.1 million megawatt hours in 2019
- Nuclear power plants in state include: Catawba, H B Robinson, Oconee, V C Summer
12. Maryland

- Change in nuclear power generation; 2001-2024: +8.1% (+1.1 million megawatt hours)
- Nuclear power generation by year: 14.8 million megawatt hours in 2024; 13.7 million megawatt hours in 2021
- Peak nuclear energy production in 21st century: 15.1 million megawatt hours in 2017
- Nuclear power plants in state include: Calvert Cliffs Nuclear Power Plant
11. Connecticut

- Change in nuclear power generation; 2001-2024: +9.3% (+1.4 million megawatt hours)
- Nuclear power generation by year: 16.9 million megawatt hours in 2024; 15.4 million megawatt hours in 2021
- Peak nuclear energy production in 21st century: 17.4 million megawatt hours in 2015
- Nuclear power plants in state include: Millstone
10. New Hampshire
- Change in nuclear power generation; 2001-2024: +11.3% (+1.0 million megawatt hours)
- Nuclear power generation by year: 9.7 million megawatt hours in 2024; 8.7 million megawatt hours in 2021
- Peak nuclear energy production in 21st century: 10.9 million megawatt hours in 2013
- Nuclear power plants in state include: Seabrook
9. Virginia

- Change in nuclear power generation; 2001-2024: +12.4% (+3.2 million megawatt hours)
- Nuclear power generation by year: 28.9 million megawatt hours in 2024; 25.8 million megawatt hours in 2021
- Peak nuclear energy production in 21st century: 30.6 million megawatt hours in 2017
- Nuclear power plants in state include: North Anna, Surry
8. Tennessee

- Change in nuclear power generation; 2001-2024: +12.6% (+3.6 million megawatt hours)
- Nuclear power generation by year: 32.2 million megawatt hours in 2024; 28.6 million megawatt hours in 2021
- Peak nuclear energy production in 21st century: 37.9 million megawatt hours in 2023
- Nuclear power plants in state include: Sequoyah, Watts Bar Nuclear Plant
7. Arizona
- Change in nuclear power generation; 2001-2024: +12.8% (+3.7 million megawatt hours)
- Nuclear power generation by year: 32.4 million megawatt hours in 2024; 28.7 million megawatt hours in 2021
- Peak nuclear energy production in 21st century: 32.5 million megawatt hours in 2015
- Nuclear power plants in state include: Palo Verde
6. North Carolina
- Change in nuclear power generation; 2001-2024: +14.8% (+5.6 million megawatt hours)
- Nuclear power generation by year: 43.3 million megawatt hours in 2024; 37.8 million megawatt hours in 2021
- Peak nuclear energy production in 21st century: 43.3 million megawatt hours in 2024
- Nuclear power plants in state include: Harris, McGuire
5. Ohio

- Change in nuclear power generation; 2001-2024: +16.1% (+2.5 million megawatt hours)
- Nuclear power generation by year: 17.9 million megawatt hours in 2024; 15.5 million megawatt hours in 2021
- Peak nuclear energy production in 21st century: 18.3 million megawatt hours in 2018
- Nuclear power plants in state include: Davis Besse, Perry
4. Washington
- Change in nuclear power generation; 2001-2024: +20.8% (+1.7 million megawatt hours)
- Nuclear power generation by year: 10.0 million megawatt hours in 2024; 8.3 million megawatt hours in 2021
- Peak nuclear energy production in 21st century: 10.0 million megawatt hours in 2024
- Nuclear power plants in state include: Columbia Generating Station
3. Missouri

- Change in nuclear power generation; 2001-2024: +25.5% (+2.1 million megawatt hours)
- Nuclear power generation by year: 10.5 million megawatt hours in 2024; 8.4 million megawatt hours in 2021
- Peak nuclear energy production in 21st century: 10.7 million megawatt hours in 2012
- Nuclear power plants in state include: Callaway
2. Georgia

- Change in nuclear power generation; 2001-2024: +42.4% (+14.3 million megawatt hours)
- Nuclear power generation by year: 48.0 million megawatt hours in 2024; 33.7 million megawatt hours in 2021
- Peak nuclear energy production in 21st century: 48.0 million megawatt hours in 2024
- Nuclear power plants in state include: Edwin I Hatch
1. Alabama

- Change in nuclear power generation; 2001-2024: +46.5% (+14.1 million megawatt hours)
- Nuclear power generation by year: 44.5 million megawatt hours in 2024; 30.4 million megawatt hours in 2021
- Peak nuclear energy production in 21st century: 46.0 million megawatt hours in 2021
- Nuclear power plants in state include: Browns Ferry, Joseph M Farley