
World Cities Where Temperatures Soared in 2025
 https://climate-crisis-247-bucket.nyc3.cdn.digitaloceanspaces.com/wp-content/uploads/2025/09/07202441/4767443-150x150.jpg
In the northern hemisphere, the meteorological summer lasts from the beginning of June through the end of August. North of the equator, the last three summers have been the three hottest summers on record, according to climate agencies in the European Union and the United States – and rising summer temperatures in recent years have been largely attributable to human-caused climate change.
Heat is a leading cause of weather-related deaths, and abnormally high temperatures in the summer of 2025 was linked to an estimated 24,400 fatalities across 854 European cities. A recent study covered by Scientific American suggests that, absent the effects of climate change, most of these deaths would likely have been avoided.
Indeed, in cities across the globe, temperatures this past summer exceeded historical norms by several degrees. In many of these same places, climate change is estimated to have pushed temperatures beyond the local 90th percentile norms for several additional weeks during the recent summer months.
Using data from the non-profit research group Climate Central, Climate Crisis 247 identified the cities around the world where temperatures soared in 2025. Cities are ranked on the difference between average temperatures in summer 2025 and average summer temperatures from 1991 to 2020. Only cities where temperature anomalies in summer 2025 exceeded 4°F are listed. All supplemental data, including population, historical temperature norms, and the number of days this summer where temperatures exceeded 90th percentile heat, as well as the number of those days in which excessive heat was linked to climate change, are also from Climate Central.
The 16 cities on this list span six countries in Europe and Asia, and are home to an estimated 76.8 million people.
16. Diyarbakir, Turkey
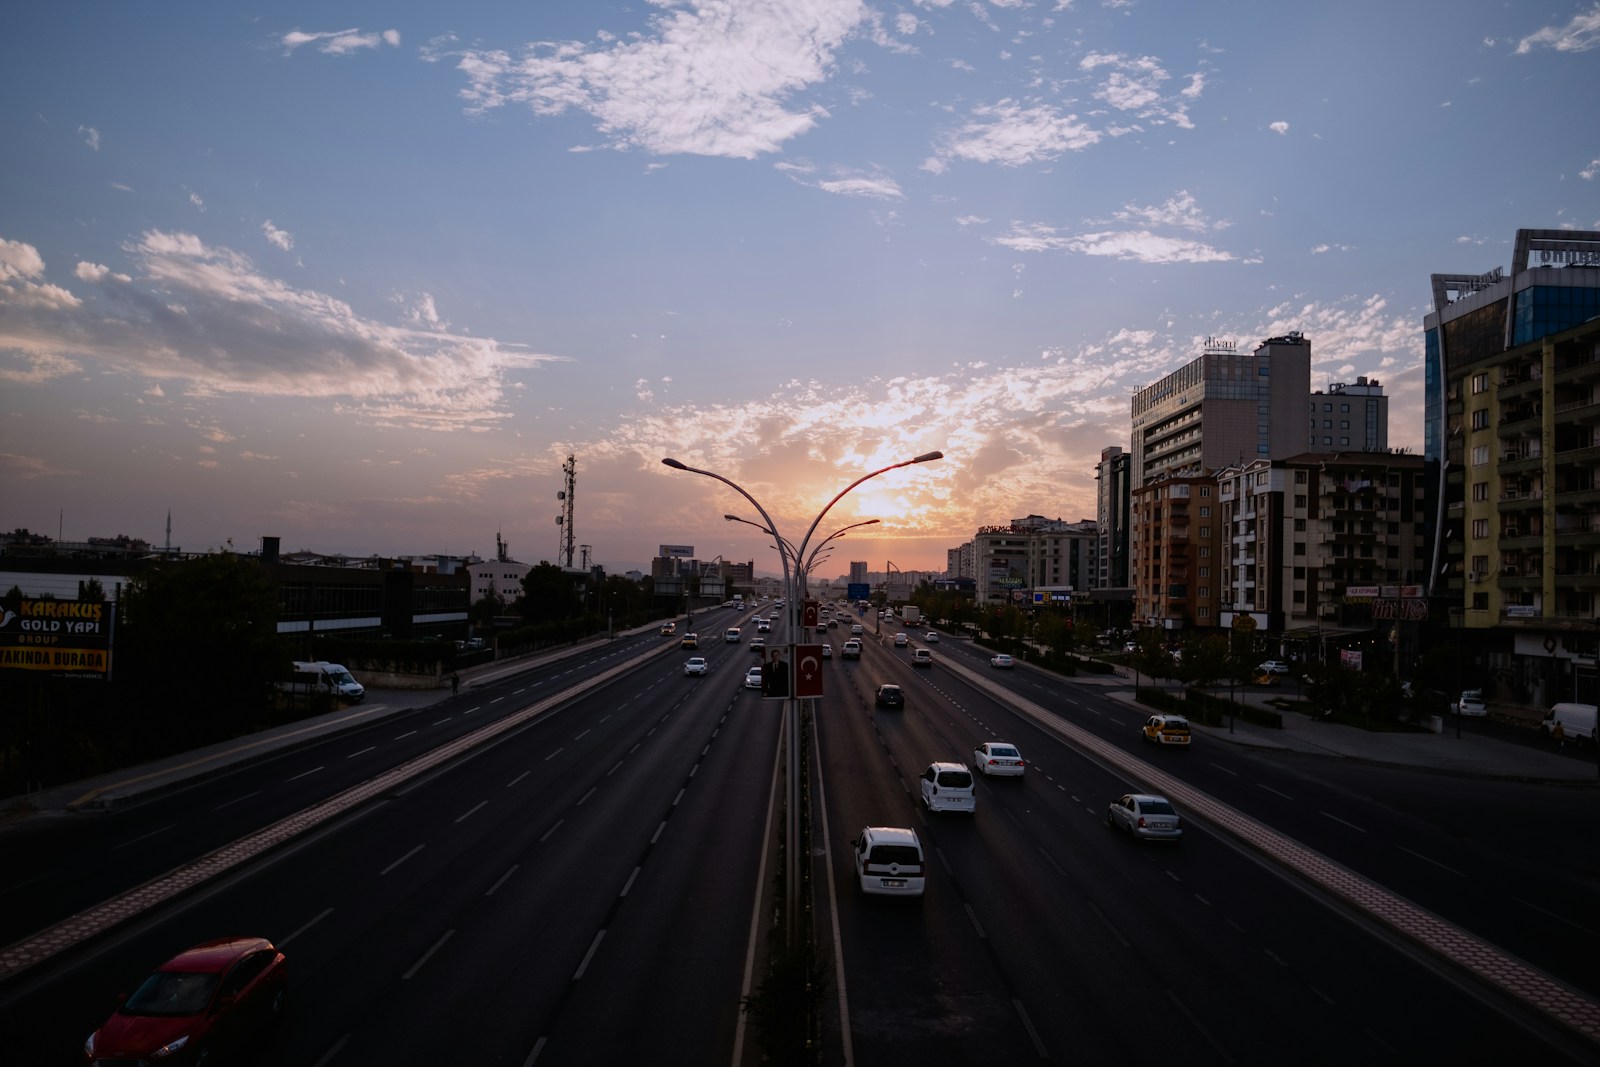
- Avg. temperature in summer 2025 relative to baseline avg.: 4.1°F warmer
- Days in summer 2025 temperatures exceeded 90th percentile norm: 63 days (33 days attributable to climate change)
- 90th percentile summer temperature: 87.0°F
- Est. population: 1,732,396
15. Nagoya, Japan

- Avg. temperature in summer 2025 relative to baseline avg.: 4.1°F warmer
- Days in summer 2025 temperatures exceeded 90th percentile norm: 61 days (16 days attributable to climate change)
- 90th percentile summer temperature: 82.0°F
- Est. population: 9,197,000
14. Kawasaki, Japan
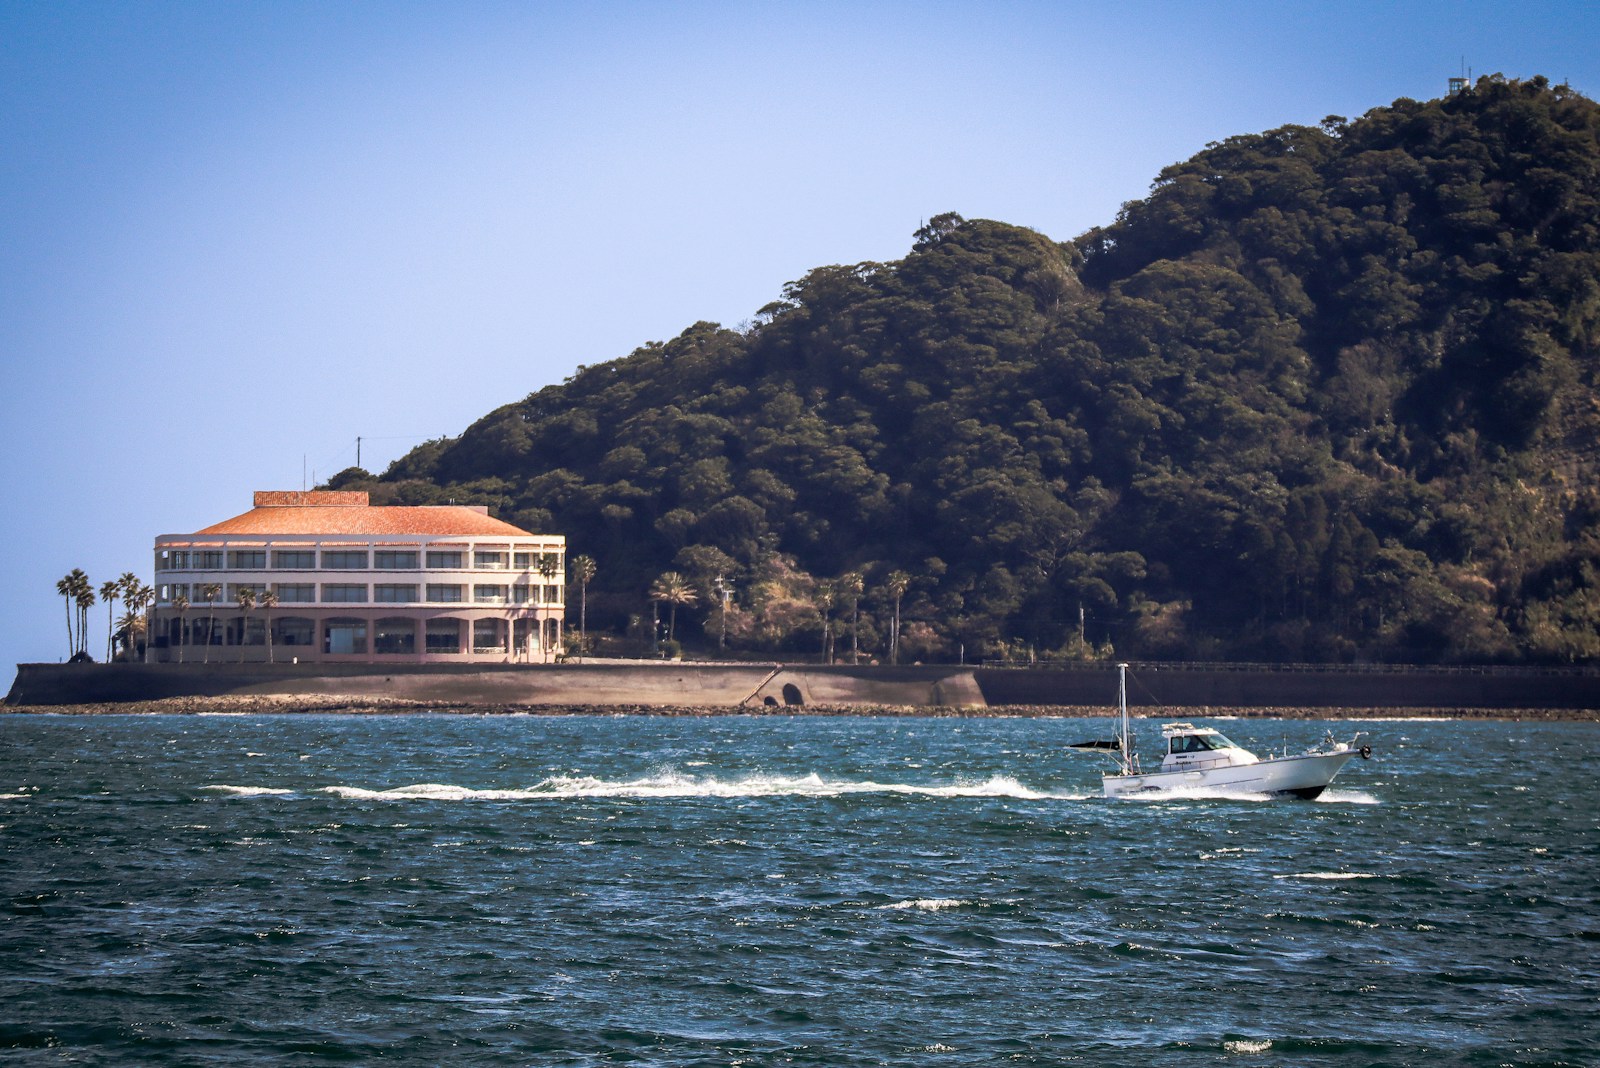
- Avg. temperature in summer 2025 relative to baseline avg.: 4.4°F warmer
- Days in summer 2025 temperatures exceeded 90th percentile norm: 66 days (23 days attributable to climate change)
- 90th percentile summer temperature: 79.7°F
- Est. population: 1,531,646
13. Yokohama, Japan
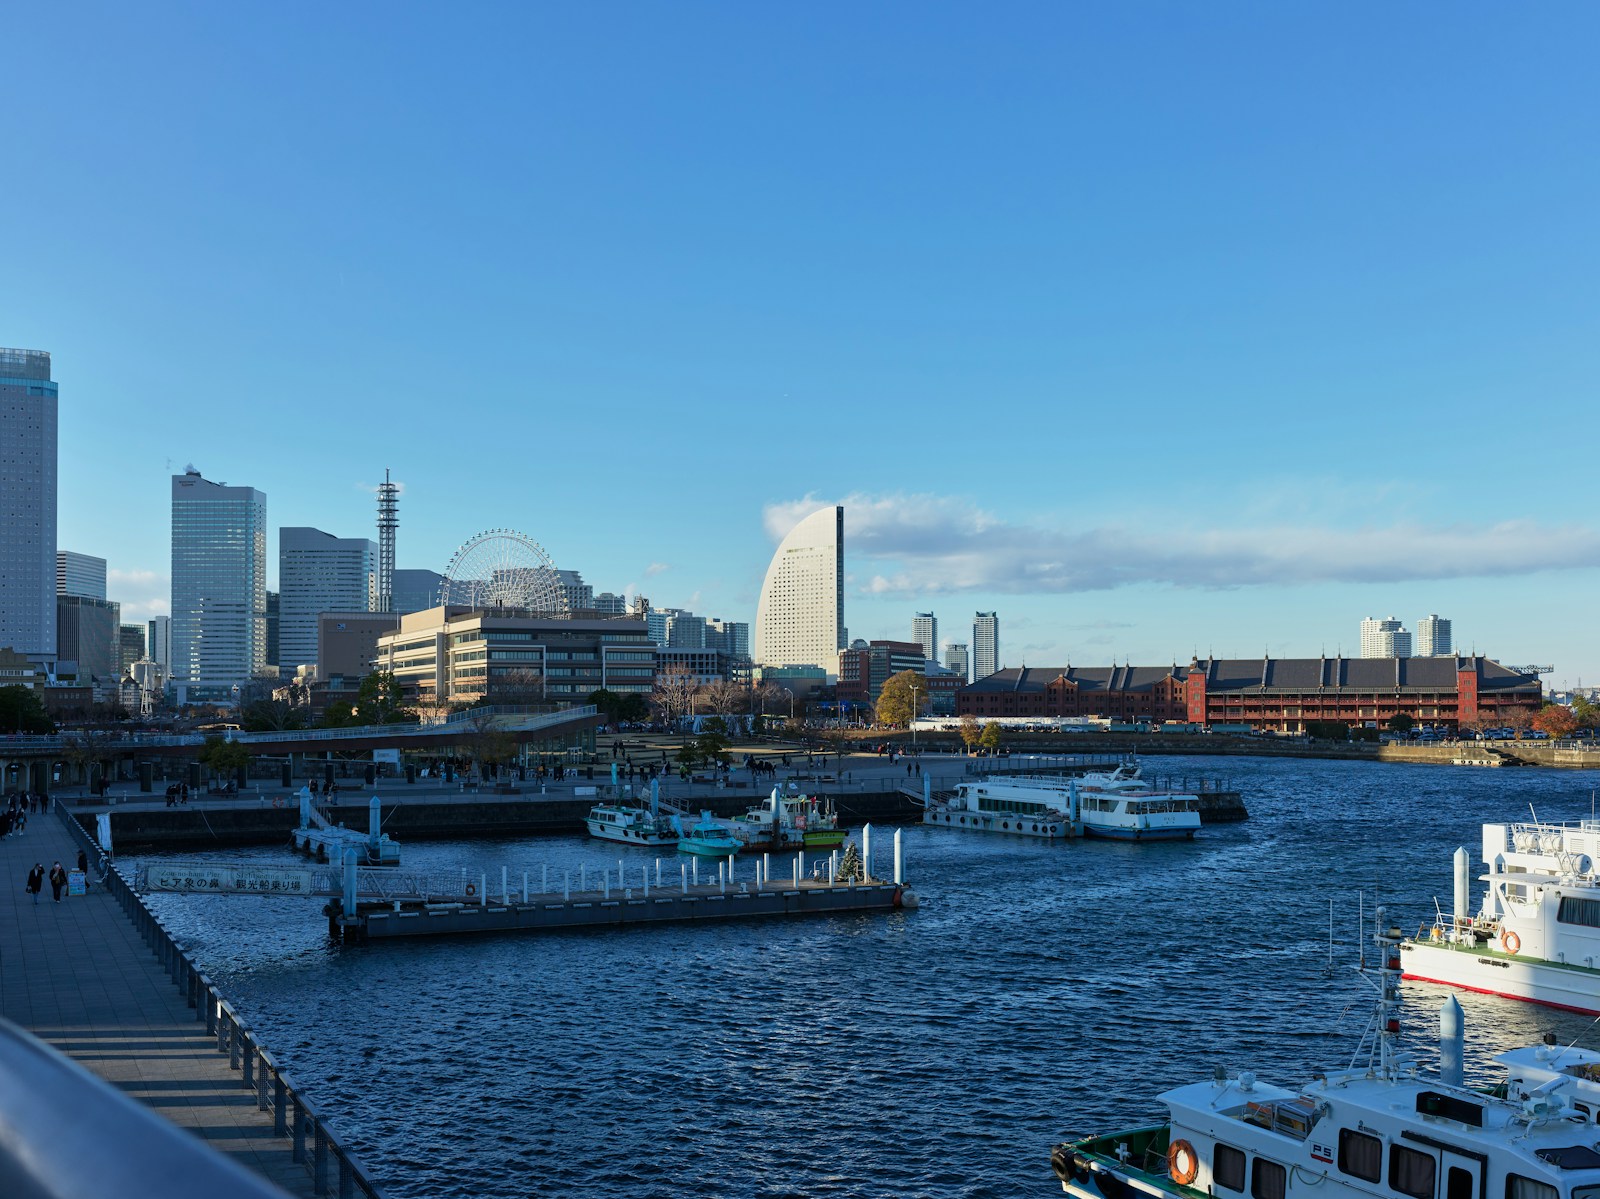
- Avg. temperature in summer 2025 relative to baseline avg.: 4.4°F warmer
- Days in summer 2025 temperatures exceeded 90th percentile norm: 66 days (23 days attributable to climate change)
- 90th percentile summer temperature: 79.7°F
- Est. population: 3,757,630
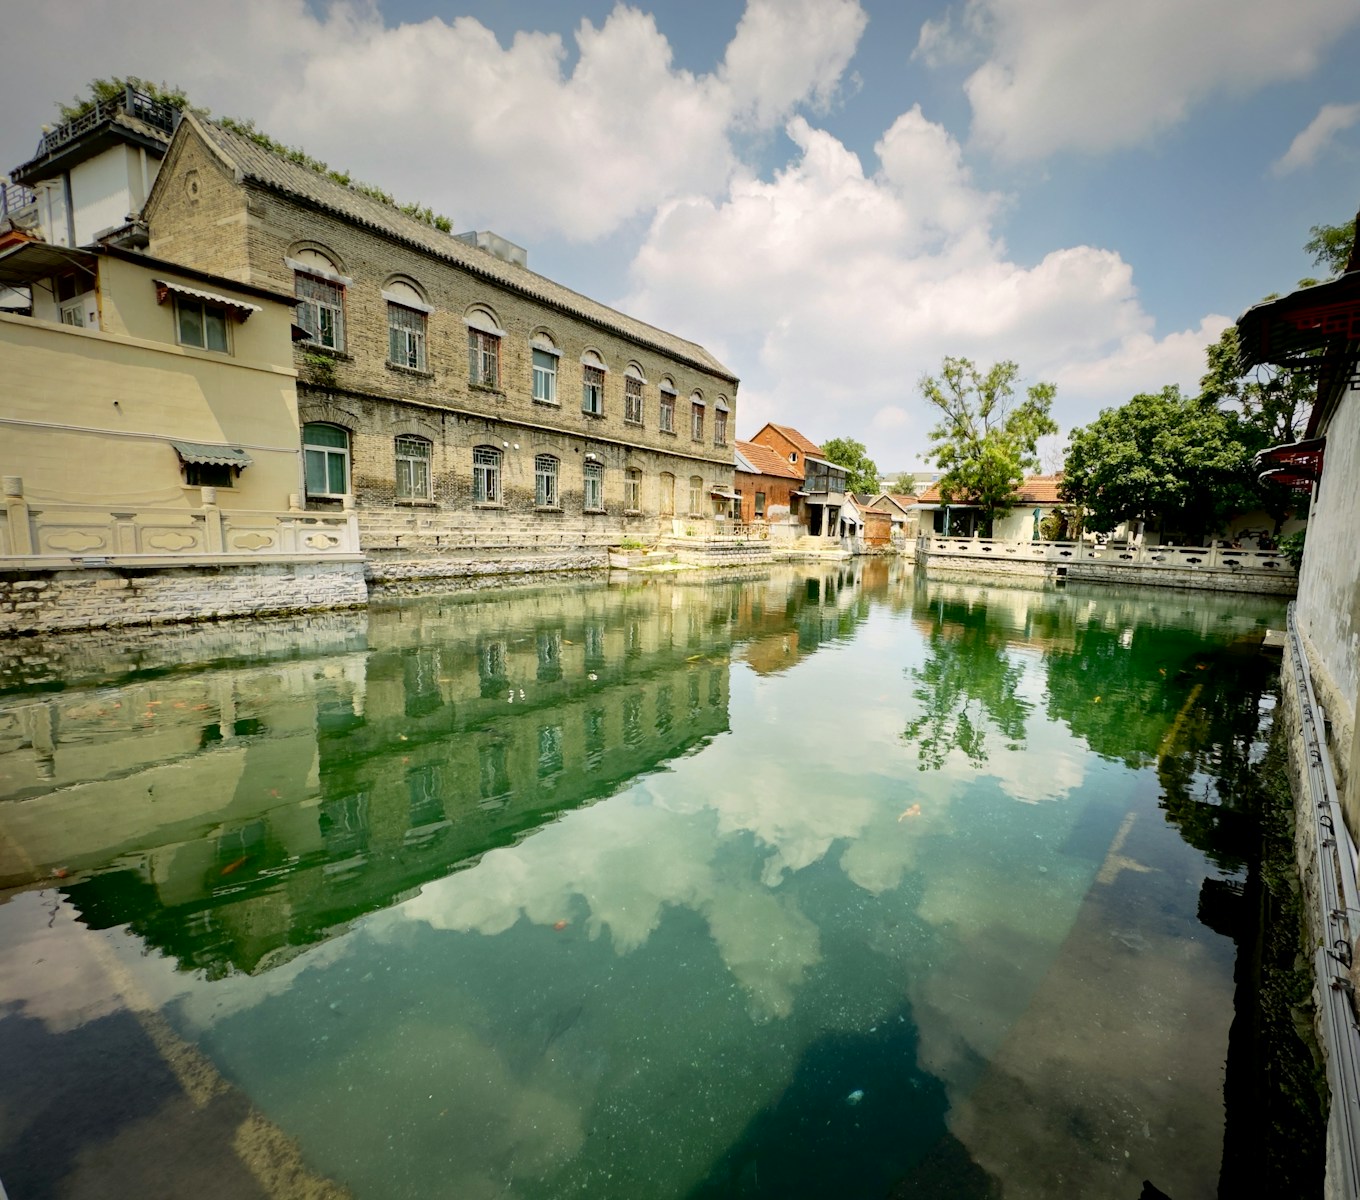
12. Jinan, China
- Avg. temperature in summer 2025 relative to baseline avg.: 4.4°F warmer
- Days in summer 2025 temperatures exceeded 90th percentile norm: 68 days (9 days attributable to climate change)
- 90th percentile summer temperature: 81.7°F
- Est. population: 5,606,374
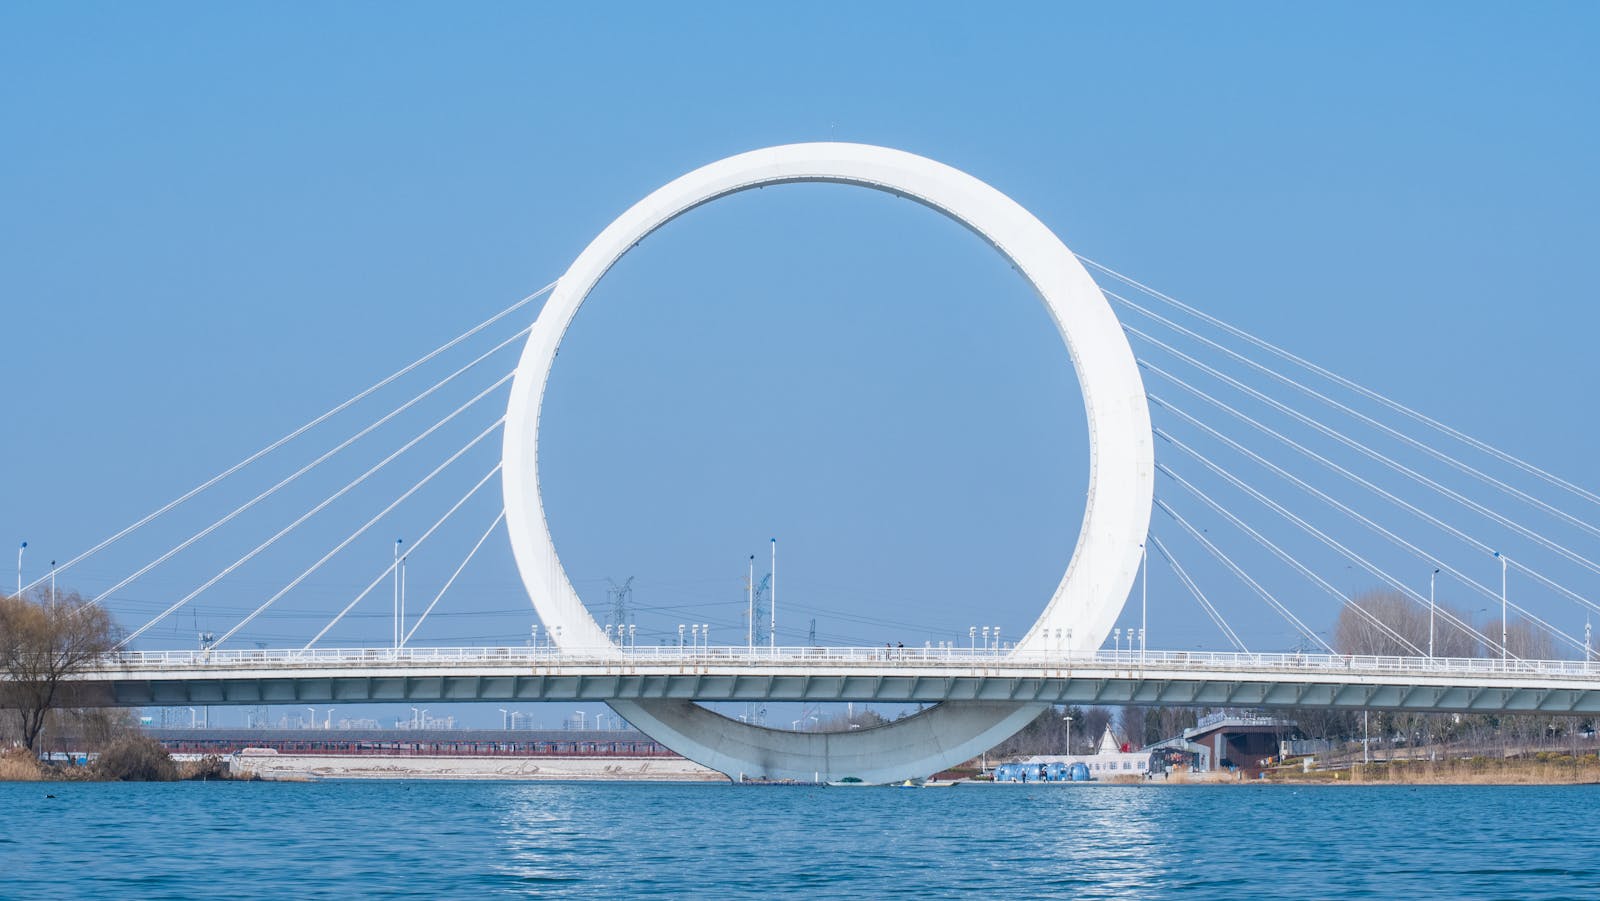
11. Zhengzhou, China
- Avg. temperature in summer 2025 relative to baseline avg.: 4.4°F warmer
- Days in summer 2025 temperatures exceeded 90th percentile norm: 67 days (11 days attributable to climate change)
- 90th percentile summer temperature: 82.6°F
- Est. population: 5,621,593
10. Prizren, Kosovo

- Avg. temperature in summer 2025 relative to baseline avg.: 4.6°F warmer
- Days in summer 2025 temperatures exceeded 90th percentile norm: 59 days (31 days attributable to climate change)
- 90th percentile summer temperature: 71.9°F
- Est. population: 220,128
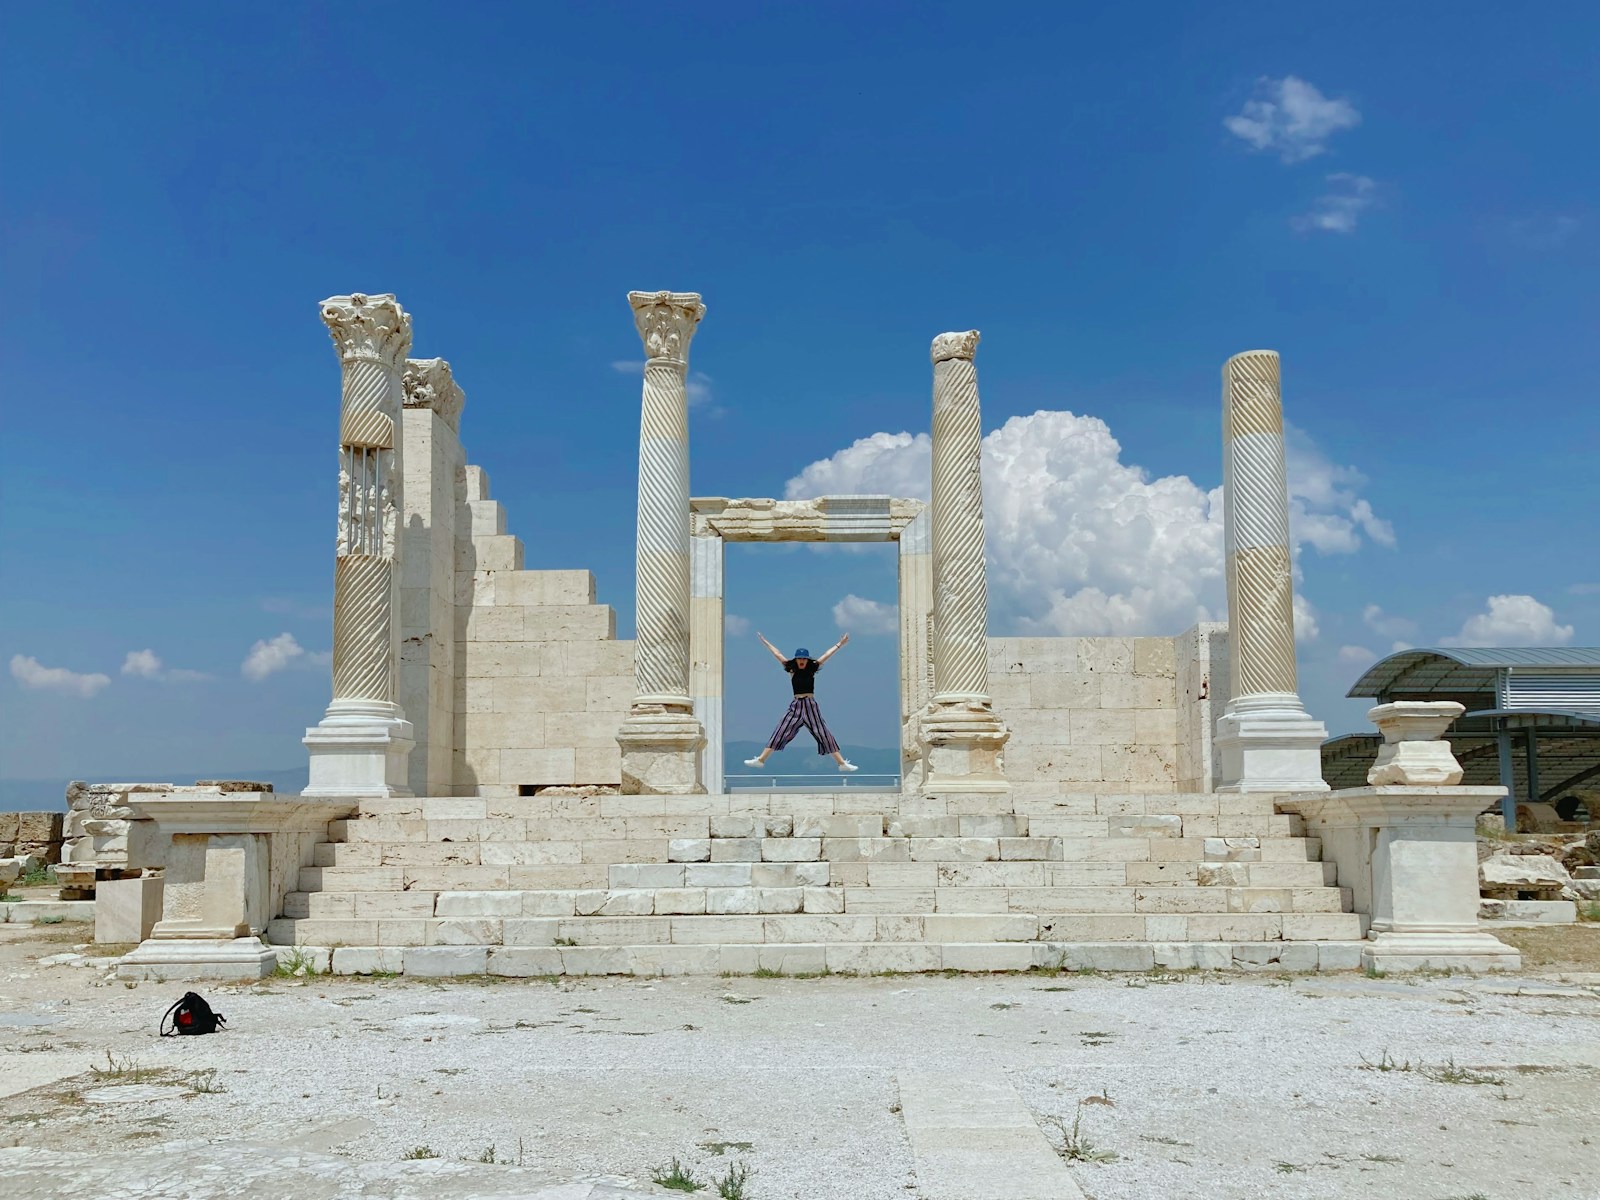
9. Denizli, Turkey
- Avg. temperature in summer 2025 relative to baseline avg.: 4.7°F warmer
- Days in summer 2025 temperatures exceeded 90th percentile norm: 66 days (36 days attributable to climate change)
- 90th percentile summer temperature: 81.0°F
- Est. population: 1,027,782
8. Saitama, Japan

- Avg. temperature in summer 2025 relative to baseline avg.: 5.2°F warmer
- Days in summer 2025 temperatures exceeded 90th percentile norm: 66 days (20 days attributable to climate change)
- 90th percentile summer temperature: 81.3°F
- Est. population: 1,325,843
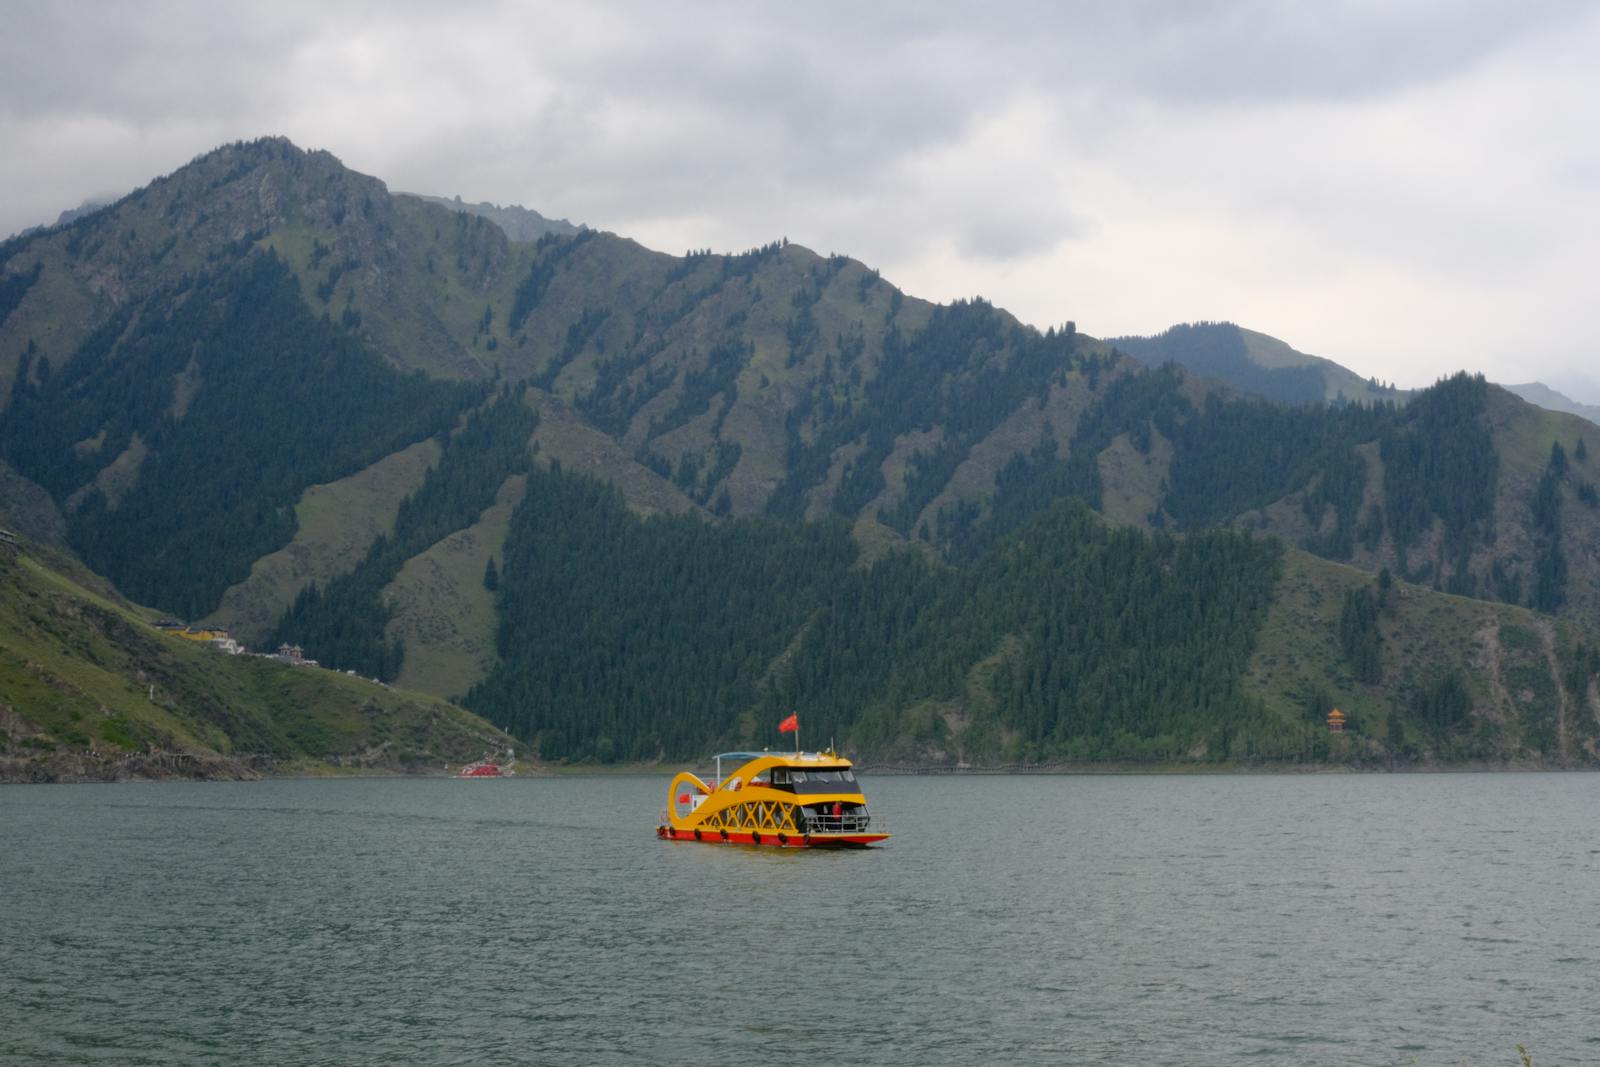
7. Urumqi, China
- Avg. temperature in summer 2025 relative to baseline avg.: 5.2°F warmer
- Days in summer 2025 temperatures exceeded 90th percentile norm: 64 days (27 days attributable to climate change)
- 90th percentile summer temperature: 73.0°F
- Est. population: 4,335,017
6. Tokyo, Japan
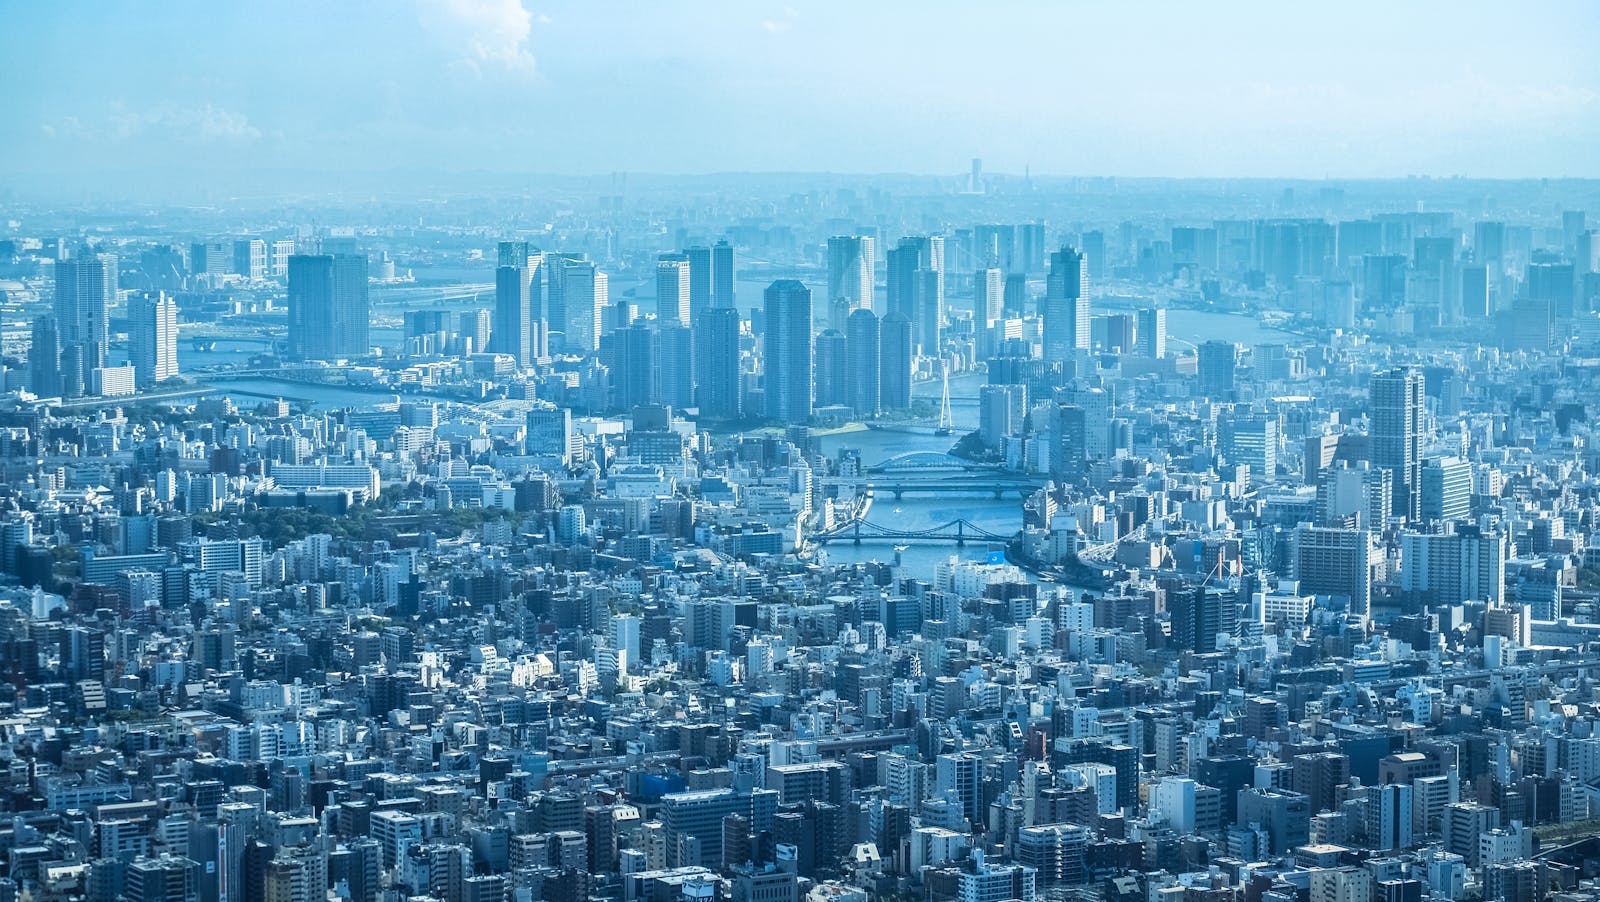
- Avg. temperature in summer 2025 relative to baseline avg.: 5.2°F warmer
- Days in summer 2025 temperatures exceeded 90th percentile norm: 66 days (20 days attributable to climate change)
- 90th percentile summer temperature: 81.3°F
- Est. population: 37,732,000
5. Sendai, Japan

- Avg. temperature in summer 2025 relative to baseline avg.: 5.5°F warmer
- Days in summer 2025 temperatures exceeded 90th percentile norm: 69 days (14 days attributable to climate change)
- 90th percentile summer temperature: 74.7°F
- Est. population: 1,061,177
4. Sapporo, Japan
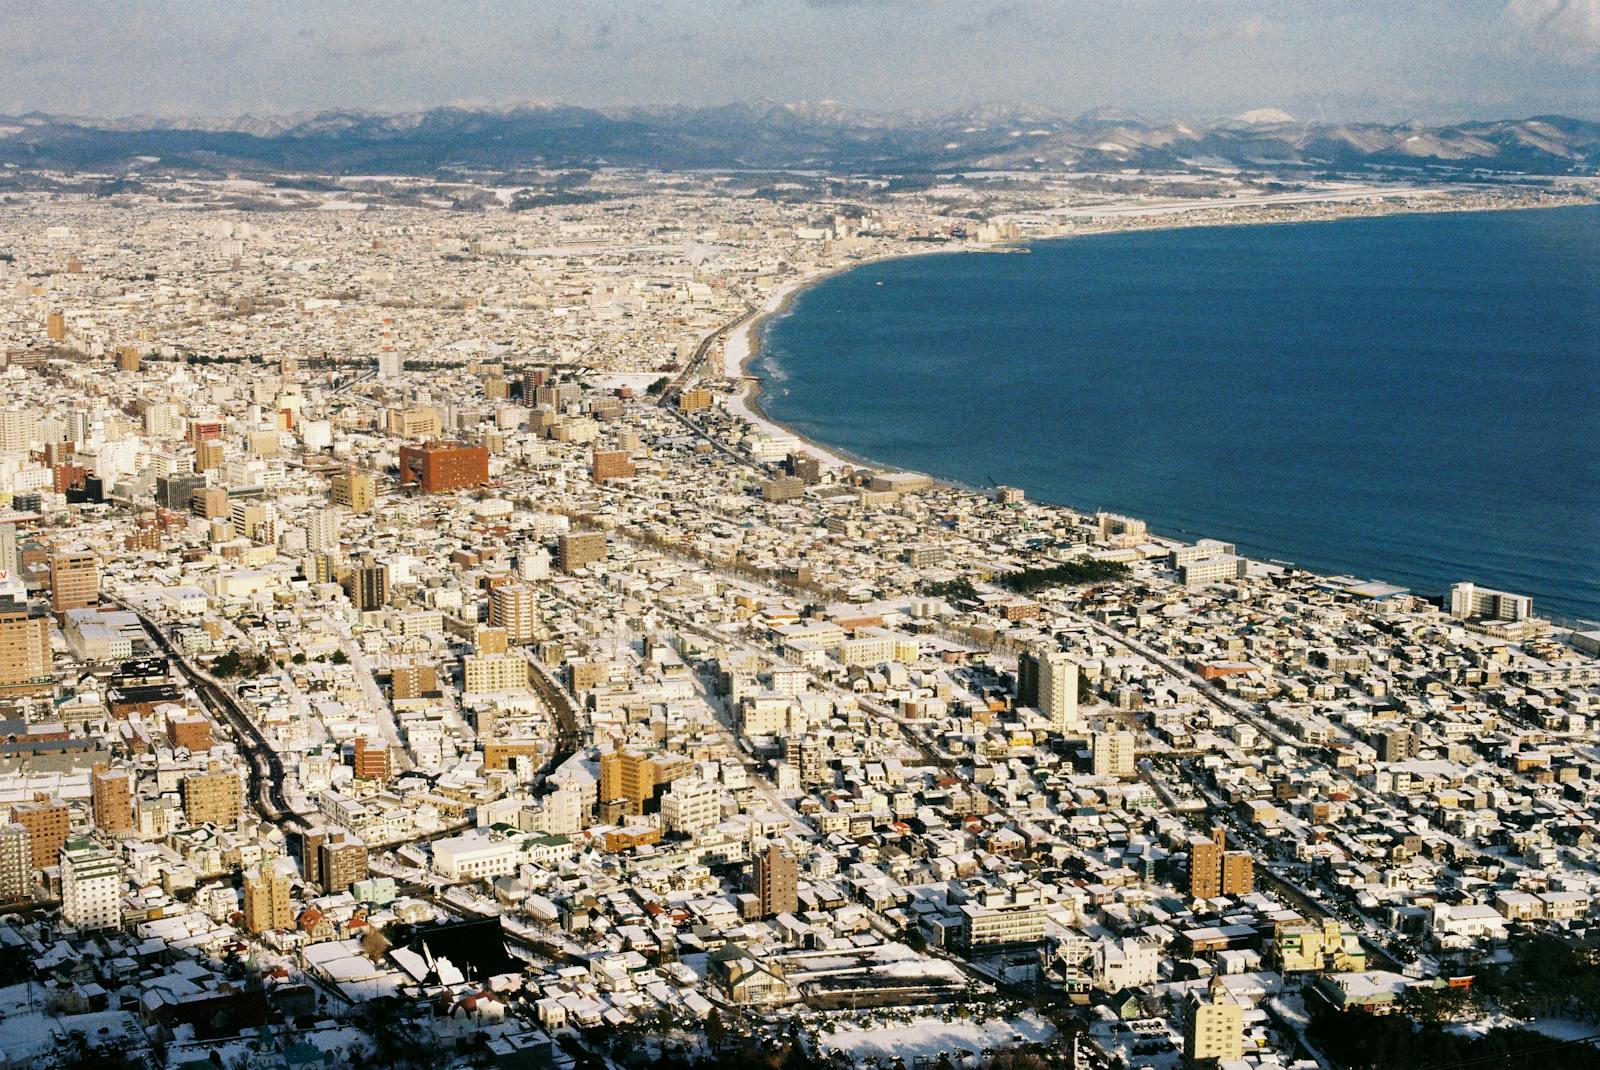
- Avg. temperature in summer 2025 relative to baseline avg.: 6.1°F warmer
- Days in summer 2025 temperatures exceeded 90th percentile norm: 70 days (13 days attributable to climate change)
- 90th percentile summer temperature: 68.3°F
- Est. population: 1,959,313
3. Vladivostok, Russia
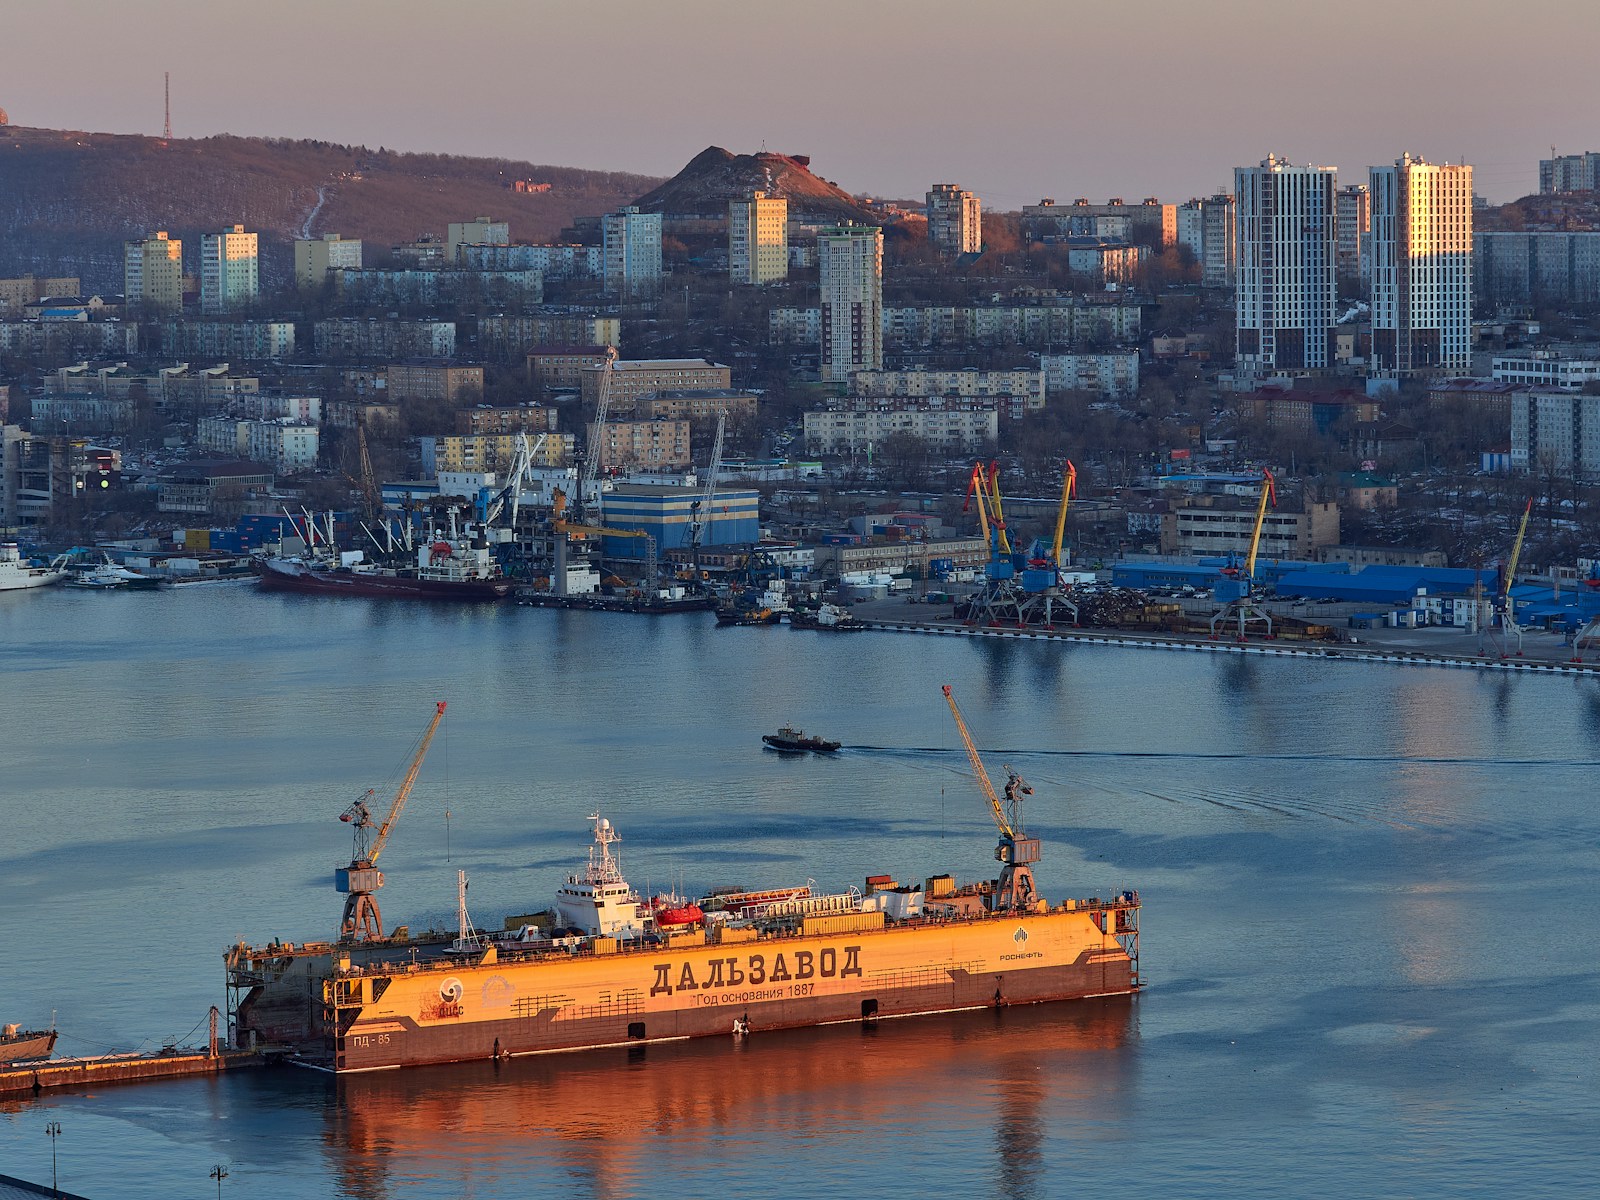
- Avg. temperature in summer 2025 relative to baseline avg.: 6.5°F warmer
- Days in summer 2025 temperatures exceeded 90th percentile norm: 72 days (13 days attributable to climate change)
- 90th percentile summer temperature: 68.6°F
- Est. population: 597,240
2. Yuzhno-Sakhalinsk, Russia
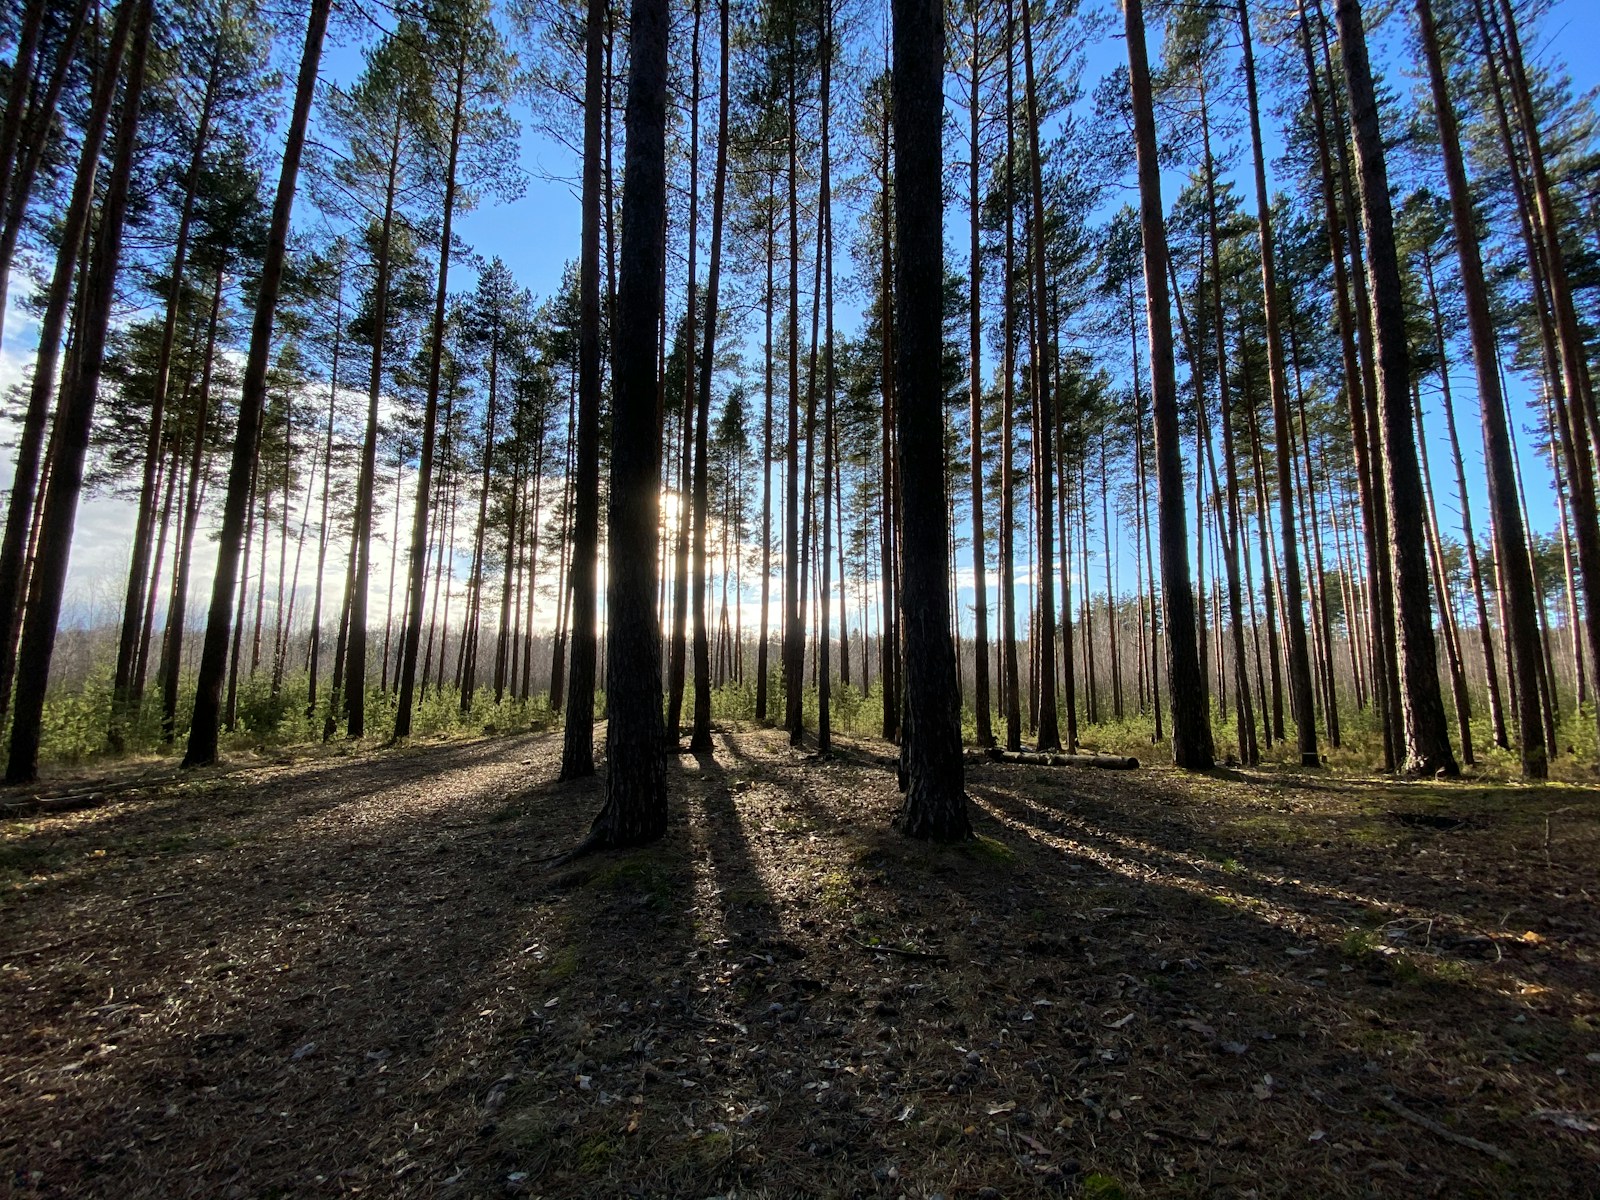
- Avg. temperature in summer 2025 relative to baseline avg.: 6.6°F warmer
- Days in summer 2025 temperatures exceeded 90th percentile norm: 68 days (13 days attributable to climate change)
- 90th percentile summer temperature: 62.4°F
- Est. population: 194,882
1. Dushanbe, Tajikistan
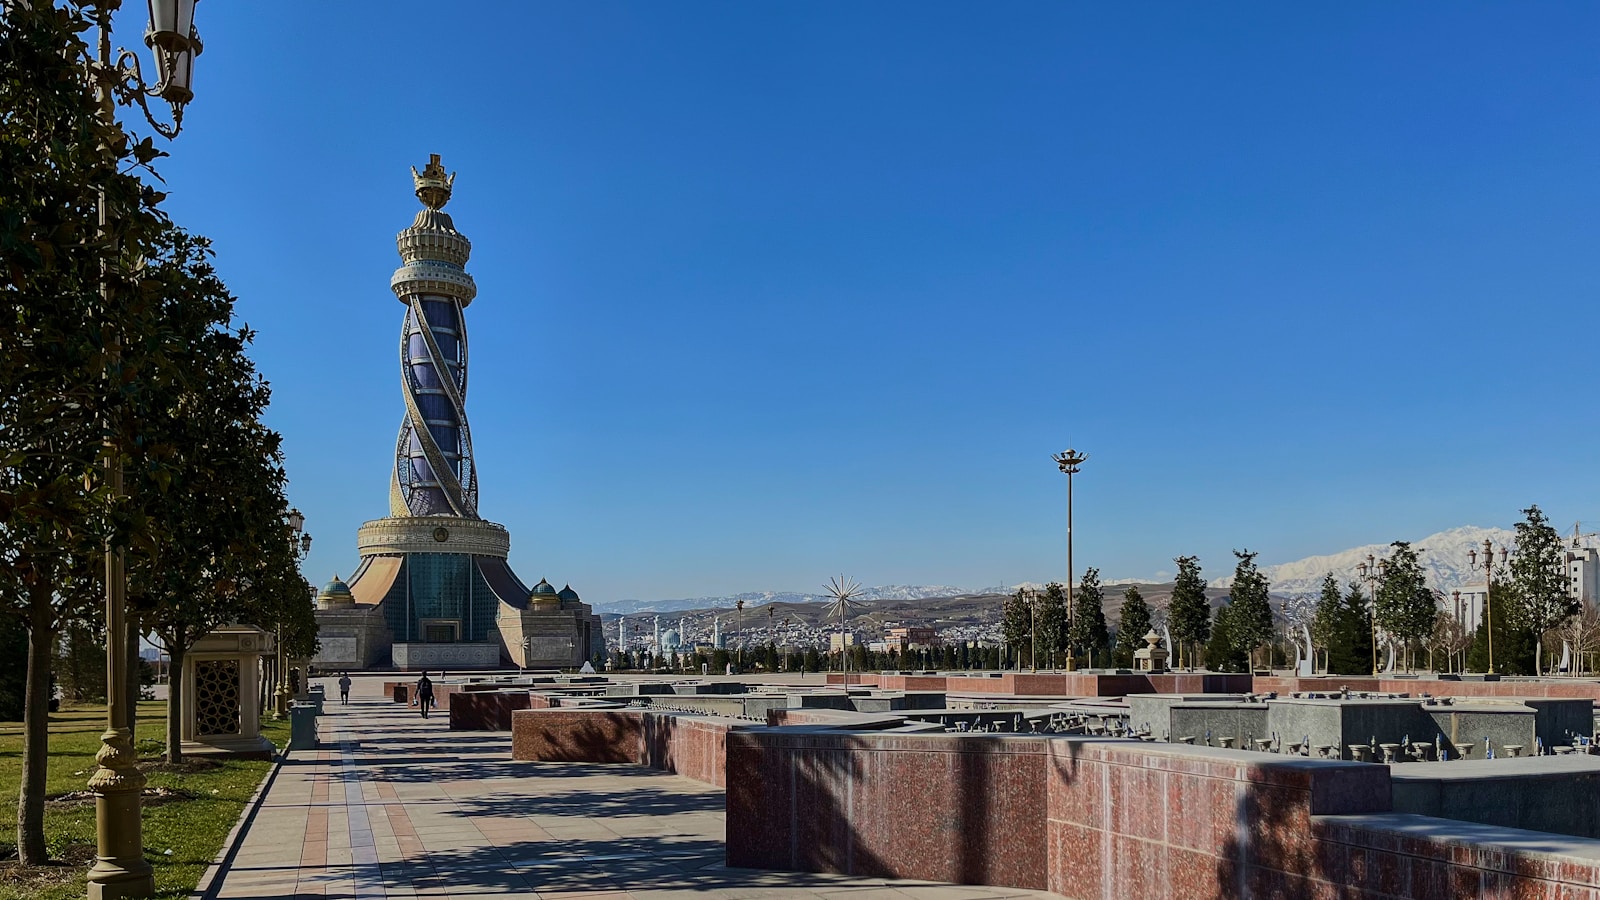
- Avg. temperature in summer 2025 relative to baseline avg.: 7.1°F warmer
- Days in summer 2025 temperatures exceeded 90th percentile norm: 86 days (8 days attributable to climate change)
- 90th percentile summer temperature: 73.1°F
- Est. population: 863,400