Worst Years for American Pollution And What Contributed
 https://climate-crisis-247-bucket.nyc3.digitaloceanspaces.com/wp-content/uploads/2025/07/07212436/459728-150x150.jpeg
The United States generated over 6.3 billion metric tons of greenhouse gas emissions in 2022, making it one of the world’s largest polluters – second only to China. While carbon dioxide, largely generated by automobiles and industry, accounts for the bulk of America’s greenhouse gas emissions – nearly 80% in 2022 – it is not the only culprit. Certain sectors, including agriculture, fossil fuel production, and waste management can also pollute the atmosphere with harmful byproducts like methane and nitrous oxide. Given America’s outsized contribution to global air pollution, slowing the rate of climate change may depend largely on the ability and willingness of the U.S. to reduce its own greenhouse gas emissions – and in recent years, some progress has been made.
According to the latest available data from the U.S. Environmental Protection Agency, greenhouse gas emissions declined by about 3% between 1990 and 2022. Over that period, increased pollution from the transportation, agriculture, commercial, and residential sectors were offset by meaningful emissions reductions in electric power generation and heavy industry. These improvements were due in no small part to adoption of more efficient industrial practices and increased reliance on clean, renewable energy sources.
Continued progress in emissions reduction now appears in jeopardy, however. Within hours of taking office, President Trump reopened drilling opportunities along the U.S. coast, withdrew the U.S. from the Paris Climate Agreement, expedited approval processes for oil drilling and coal mining projects, and froze unspent clean energy funding provided by the Biden-era Inflation Reduction Act. In recent decades, U.S. greenhouse gas emissions peaked in the mid-2000’s. But new federal energy and environmental policies may mean America’s carbon footprint may meaningfully expand in the coming years.
Using data from the EPA, Climate Crisis 247 identified the worst years for greenhouse gas emissions in the United States. We reviewed data on total greenhouse gas emissions – including carbon dioxide, methane, nitrous oxide, and other pollutants, including HFCs and PFCs – for every year of available data, from 1990 to 2022. Years are ranked by accumulated metric tons of greenhouse gas emissions. All supplemental data is also from the EPA. It is important to note that emissions percentages may exceed 100%, as land-use offsets can reduce overall net-pollution in a given year.
33. 2020
- Total U.S. greenhouse gas emissions: 6.0 billion metric tons
- Greenhouse gas emissions by component in 2020: 78.1% carbon dioxide, 12.3% methane, 6.5% nitrous oxide, 3.1% other
- Heaviest polluting U.S. sector by greenhouse gas emissions in 2020: Transportation, 1.6 billion metric tons
32. 2021

- Total U.S. greenhouse gas emissions: 6.3 billion metric tons
- Greenhouse gas emissions by component in 2021: 79.3% carbon dioxide, 11.4% methane, 6.3% nitrous oxide, 3.0% other
- Heaviest polluting U.S. sector by greenhouse gas emissions in 2021: Transportation, 1.8 billion metric tons
31. 2022

- Total U.S. greenhouse gas emissions: 6.3 billion metric tons
- Greenhouse gas emissions by component in 2022: 79.7% carbon dioxide, 11.1% methane, 6.1% nitrous oxide, 3.1% other
- Heaviest polluting U.S. sector by greenhouse gas emissions in 2022: Transportation, 1.8 billion metric tons
30. 1991

- Total U.S. greenhouse gas emissions: 6.5 billion metric tons
- Greenhouse gas emissions by component in 1991: 78.4% carbon dioxide, 13.6% methane, 6.2% nitrous oxide, 1.8% other
- Heaviest polluting U.S. sector by greenhouse gas emissions in 1991: Electric power industry, 1.9 billion metric tons
29. 1990

- Total U.S. greenhouse gas emissions: 6.5 billion metric tons
- Greenhouse gas emissions by component in 1990: 78.5% carbon dioxide, 13.3% methane, 6.2% nitrous oxide, 1.9% other
- Heaviest polluting U.S. sector by greenhouse gas emissions in 1990: Electric power industry, 1.9 billion metric tons
28. 2017

- Total U.S. greenhouse gas emissions: 6.6 billion metric tons
- Greenhouse gas emissions by component in 2017: 79.3% carbon dioxide, 11.6% methane, 6.4% nitrous oxide, 2.7% other
- Heaviest polluting U.S. sector by greenhouse gas emissions in 2017: Transportation, 1.8 billion metric tons
27. 1992
- Total U.S. greenhouse gas emissions: 6.6 billion metric tons
- Greenhouse gas emissions by component in 1992: 78.7% carbon dioxide, 13.3% methane, 6.0% nitrous oxide, 1.9% other
- Heaviest polluting U.S. sector by greenhouse gas emissions in 1992: Electric power industry, 1.9 billion metric tons
26. 2016
- Total U.S. greenhouse gas emissions: 6.6 billion metric tons
- Greenhouse gas emissions by component in 2016: 79.7% carbon dioxide, 11.3% methane, 6.3% nitrous oxide, 2.7% other
- Heaviest polluting U.S. sector by greenhouse gas emissions in 2016: Electric power industry, 1.9 billion metric tons
25. 2019

- Total U.S. greenhouse gas emissions: 6.6 billion metric tons
- Greenhouse gas emissions by component in 2019: 79.4% carbon dioxide, 11.4% methane, 6.3% nitrous oxide, 2.8% other
- Heaviest polluting U.S. sector by greenhouse gas emissions in 2019: Transportation, 1.9 billion metric tons
24. 2012
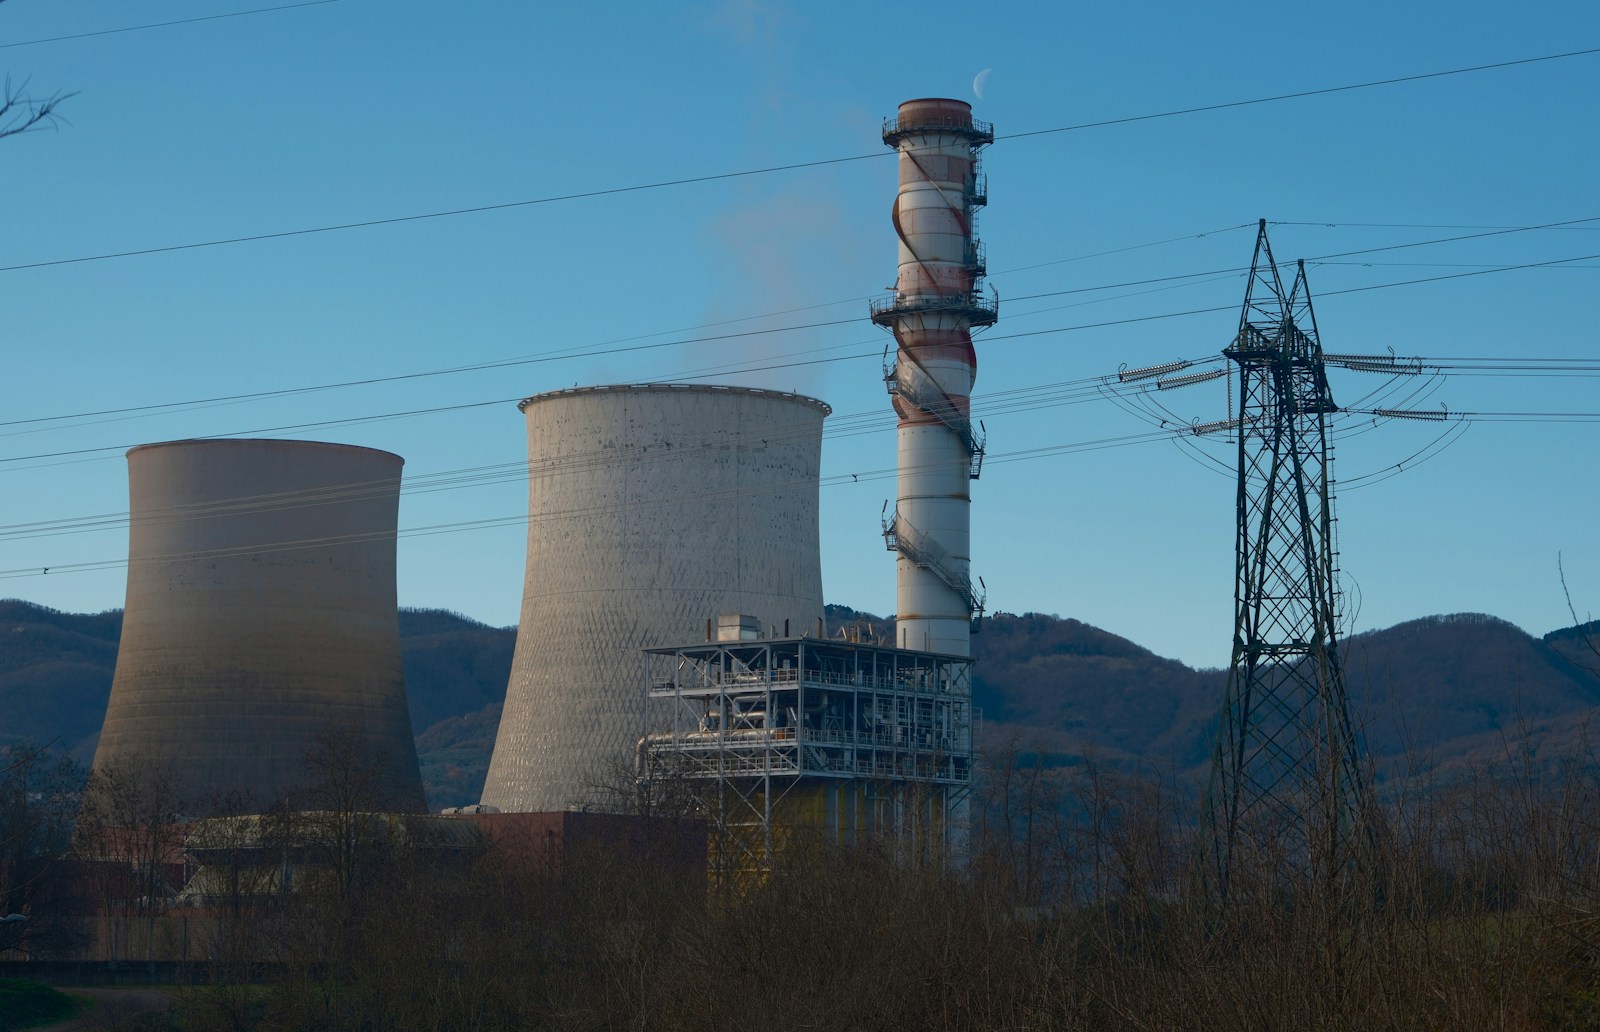
- Total U.S. greenhouse gas emissions: 6.7 billion metric tons
- Greenhouse gas emissions by component in 2012: 80.1% carbon dioxide, 11.5% methane, 5.9% nitrous oxide, 2.6% other
- Heaviest polluting U.S. sector by greenhouse gas emissions in 2012: Electric power industry, 2.1 billion metric tons
23. 1993

- Total U.S. greenhouse gas emissions: 6.7 billion metric tons
- Greenhouse gas emissions by component in 1993: 79.0% carbon dioxide, 12.9% methane, 6.3% nitrous oxide, 1.8% other
- Heaviest polluting U.S. sector by greenhouse gas emissions in 1993: Electric power industry, 2.0 billion metric tons
22. 2015
- Total U.S. greenhouse gas emissions: 6.7 billion metric tons
- Greenhouse gas emissions by component in 2015: 79.7% carbon dioxide, 11.3% methane, 6.3% nitrous oxide, 2.6% other
- Heaviest polluting U.S. sector by greenhouse gas emissions in 2015: Electric power industry, 2.0 billion metric tons
21. 2018
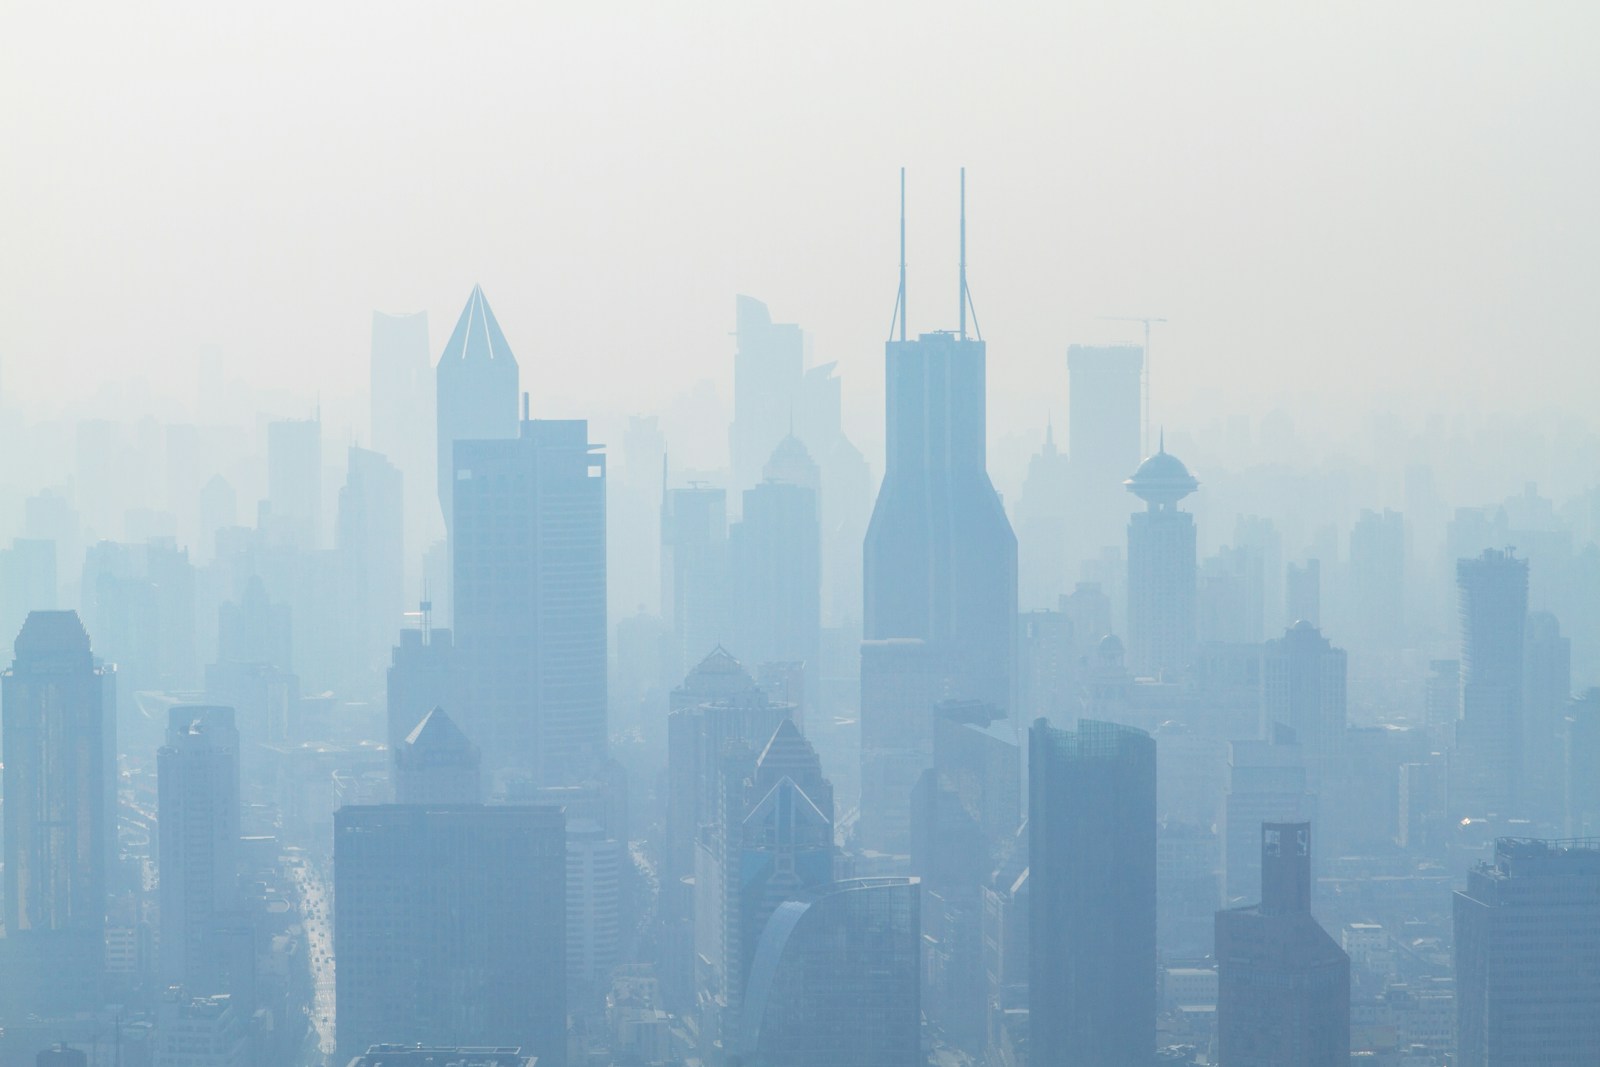
- Total U.S. greenhouse gas emissions: 6.8 billion metric tons
- Greenhouse gas emissions by component in 2018: 79.4% carbon dioxide, 11.4% methane, 6.5% nitrous oxide, 2.7% other
- Heaviest polluting U.S. sector by greenhouse gas emissions in 2018: Transportation, 1.9 billion metric tons
20. 1994
- Total U.S. greenhouse gas emissions: 6.8 billion metric tons
- Greenhouse gas emissions by component in 1994: 79.1% carbon dioxide, 12.9% methane, 6.2% nitrous oxide, 1.9% other
- Heaviest polluting U.S. sector by greenhouse gas emissions in 1994: Electric power industry, 2.0 billion metric tons
19. 2013

- Total U.S. greenhouse gas emissions: 6.8 billion metric tons
- Greenhouse gas emissions by component in 2013: 80.0% carbon dioxide, 11.2% methane, 6.3% nitrous oxide, 2.5% other
- Heaviest polluting U.S. sector by greenhouse gas emissions in 2013: Electric power industry, 2.1 billion metric tons
18. 1995

- Total U.S. greenhouse gas emissions: 6.9 billion metric tons
- Greenhouse gas emissions by component in 1995: 79.1% carbon dioxide, 12.6% methane, 6.2% nitrous oxide, 2.1% other
- Heaviest polluting U.S. sector by greenhouse gas emissions in 1995: Electric power industry, 2.0 billion metric tons
17. 2009

- Total U.S. greenhouse gas emissions: 6.9 billion metric tons
- Greenhouse gas emissions by component in 2009: 79.9% carbon dioxide, 11.7% methane, 6.0% nitrous oxide, 2.4% other
- Heaviest polluting U.S. sector by greenhouse gas emissions in 2009: Electric power industry, 2.2 billion metric tons
16. 2014
- Total U.S. greenhouse gas emissions: 6.9 billion metric tons
- Greenhouse gas emissions by component in 2014: 80.1% carbon dioxide, 11.0% methane, 6.4% nitrous oxide, 2.5% other
- Heaviest polluting U.S. sector by greenhouse gas emissions in 2014: Electric power industry, 2.1 billion metric tons
15. 2011

- Total U.S. greenhouse gas emissions: 6.9 billion metric tons
- Greenhouse gas emissions by component in 2011: 80.2% carbon dioxide, 11.3% methane, 6.1% nitrous oxide, 2.5% other
- Heaviest polluting U.S. sector by greenhouse gas emissions in 2011: Electric power industry, 2.2 billion metric tons
14. 1996

- Total U.S. greenhouse gas emissions: 7.1 billion metric tons
- Greenhouse gas emissions by component in 1996: 79.4% carbon dioxide, 12.2% methane, 6.2% nitrous oxide, 2.2% other
- Heaviest polluting U.S. sector by greenhouse gas emissions in 1996: Electric power industry, 2.1 billion metric tons
13. 2010

- Total U.S. greenhouse gas emissions: 7.1 billion metric tons
- Greenhouse gas emissions by component in 2010: 80.2% carbon dioxide, 11.4% methane, 5.9% nitrous oxide, 2.4% other
- Heaviest polluting U.S. sector by greenhouse gas emissions in 2010: Electric power industry, 2.3 billion metric tons
12. 1997
- Total U.S. greenhouse gas emissions: 7.1 billion metric tons
- Greenhouse gas emissions by component in 1997: 79.8% carbon dioxide, 11.9% methane, 5.9% nitrous oxide, 2.4% other
- Heaviest polluting U.S. sector by greenhouse gas emissions in 1997: Electric power industry, 2.1 billion metric tons
11. 1998
- Total U.S. greenhouse gas emissions: 7.2 billion metric tons
- Greenhouse gas emissions by component in 1998: 79.9% carbon dioxide, 11.6% methane, 5.9% nitrous oxide, 2.6% other
- Heaviest polluting U.S. sector by greenhouse gas emissions in 1998: Electric power industry, 2.2 billion metric tons
10. 1999

- Total U.S. greenhouse gas emissions: 7.2 billion metric tons
- Greenhouse gas emissions by component in 1999: 80.4% carbon dioxide, 11.3% methane, 5.8% nitrous oxide, 2.5% other
- Heaviest polluting U.S. sector by greenhouse gas emissions in 1999: Electric power industry, 2.2 billion metric tons
9. 2001
- Total U.S. greenhouse gas emissions: 7.3 billion metric tons
- Greenhouse gas emissions by component in 2001: 81.0% carbon dioxide, 11.1% methane, 5.8% nitrous oxide, 2.1% other
- Heaviest polluting U.S. sector by greenhouse gas emissions in 2001: Electric power industry, 2.3 billion metric tons
8. 2008

- Total U.S. greenhouse gas emissions: 7.3 billion metric tons
- Greenhouse gas emissions by component in 2008: 80.8% carbon dioxide, 11.2% methane, 5.7% nitrous oxide, 2.3% other
- Heaviest polluting U.S. sector by greenhouse gas emissions in 2008: Electric power industry, 2.4 billion metric tons
7. 2002

- Total U.S. greenhouse gas emissions: 7.3 billion metric tons
- Greenhouse gas emissions by component in 2002: 81.1% carbon dioxide, 10.9% methane, 5.8% nitrous oxide, 2.2% other
- Heaviest polluting U.S. sector by greenhouse gas emissions in 2002: Electric power industry, 2.3 billion metric tons
6. 2003

- Total U.S. greenhouse gas emissions: 7.4 billion metric tons
- Greenhouse gas emissions by component in 2003: 81.3% carbon dioxide, 10.8% methane, 5.7% nitrous oxide, 2.1% other
- Heaviest polluting U.S. sector by greenhouse gas emissions in 2003: Electric power industry, 2.4 billion metric tons
5. 2000
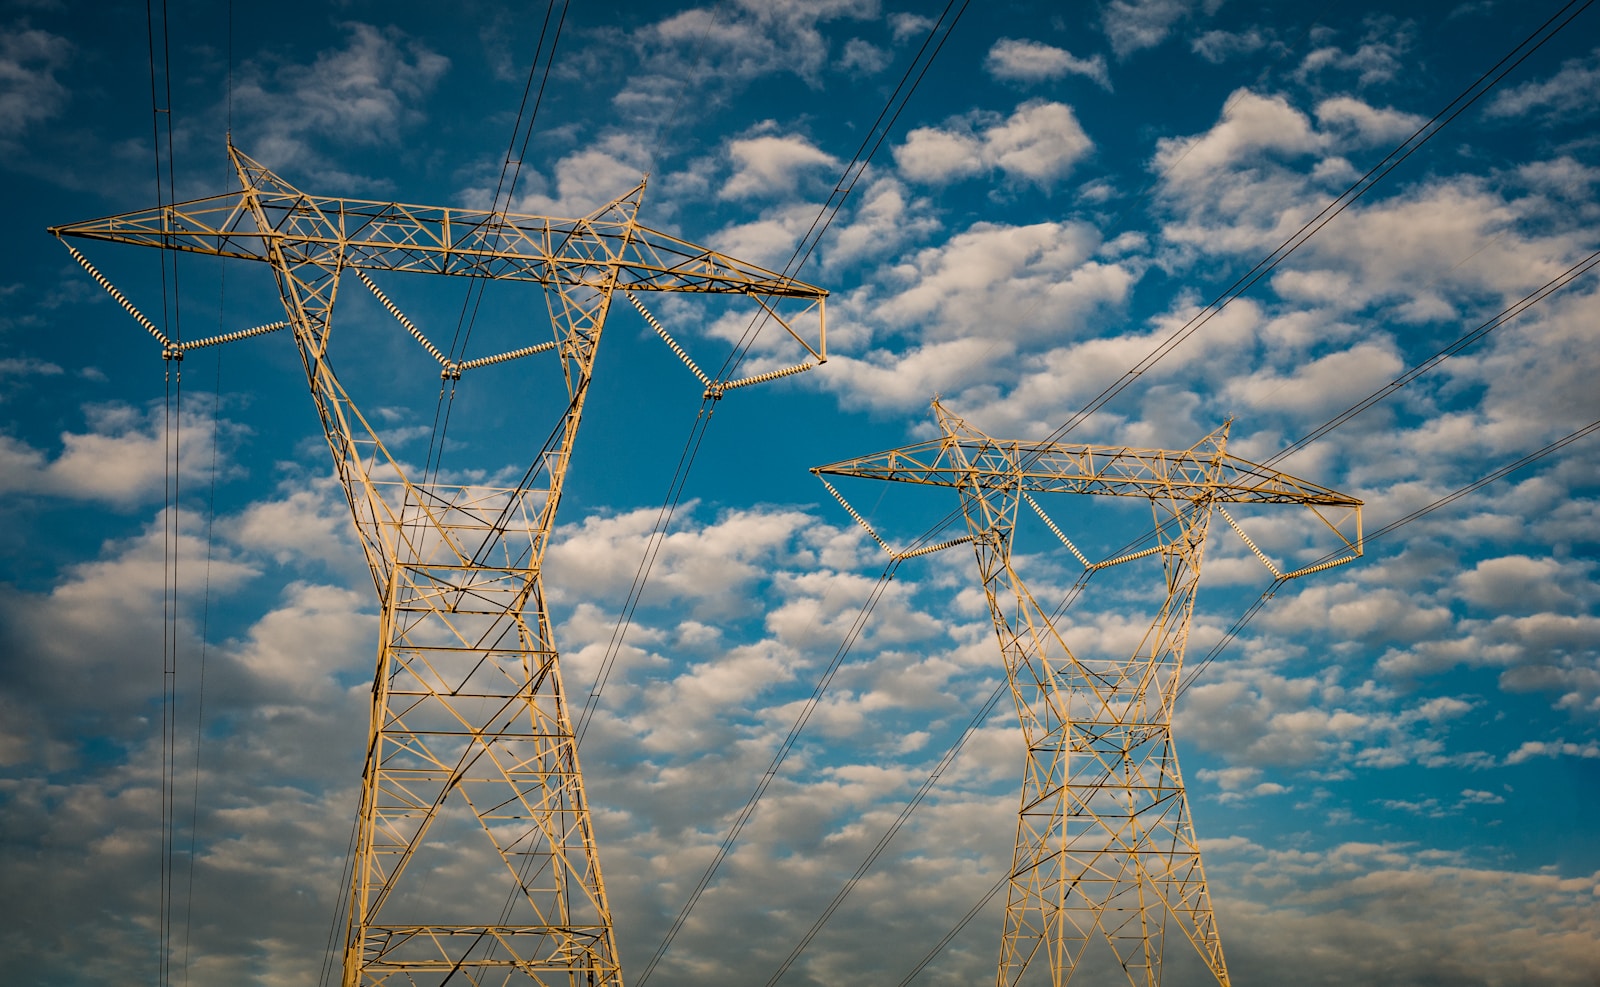
- Total U.S. greenhouse gas emissions: 7.4 billion metric tons
- Greenhouse gas emissions by component in 2000: 81.2% carbon dioxide, 11.0% methane, 5.5% nitrous oxide, 2.3% other
- Heaviest polluting U.S. sector by greenhouse gas emissions in 2000: Electric power industry, 2.4 billion metric tons
4. 2006

- Total U.S. greenhouse gas emissions: 7.4 billion metric tons
- Greenhouse gas emissions by component in 2006: 81.4% carbon dioxide, 10.9% methane, 5.7% nitrous oxide, 2.1% other
- Heaviest polluting U.S. sector by greenhouse gas emissions in 2006: Electric power industry, 2.4 billion metric tons
3. 2004

- Total U.S. greenhouse gas emissions: 7.5 billion metric tons
- Greenhouse gas emissions by component in 2004: 81.6% carbon dioxide, 10.6% methane, 5.7% nitrous oxide, 2.1% other
- Heaviest polluting U.S. sector by greenhouse gas emissions in 2004: Electric power industry, 2.4 billion metric tons
2. 2005

- Total U.S. greenhouse gas emissions: 7.5 billion metric tons
- Greenhouse gas emissions by component in 2005: 81.7% carbon dioxide, 10.6% methane, 5.6% nitrous oxide, 2.0% other
- Heaviest polluting U.S. sector by greenhouse gas emissions in 2005: Electric power industry, 2.5 billion metric tons
1. 2007
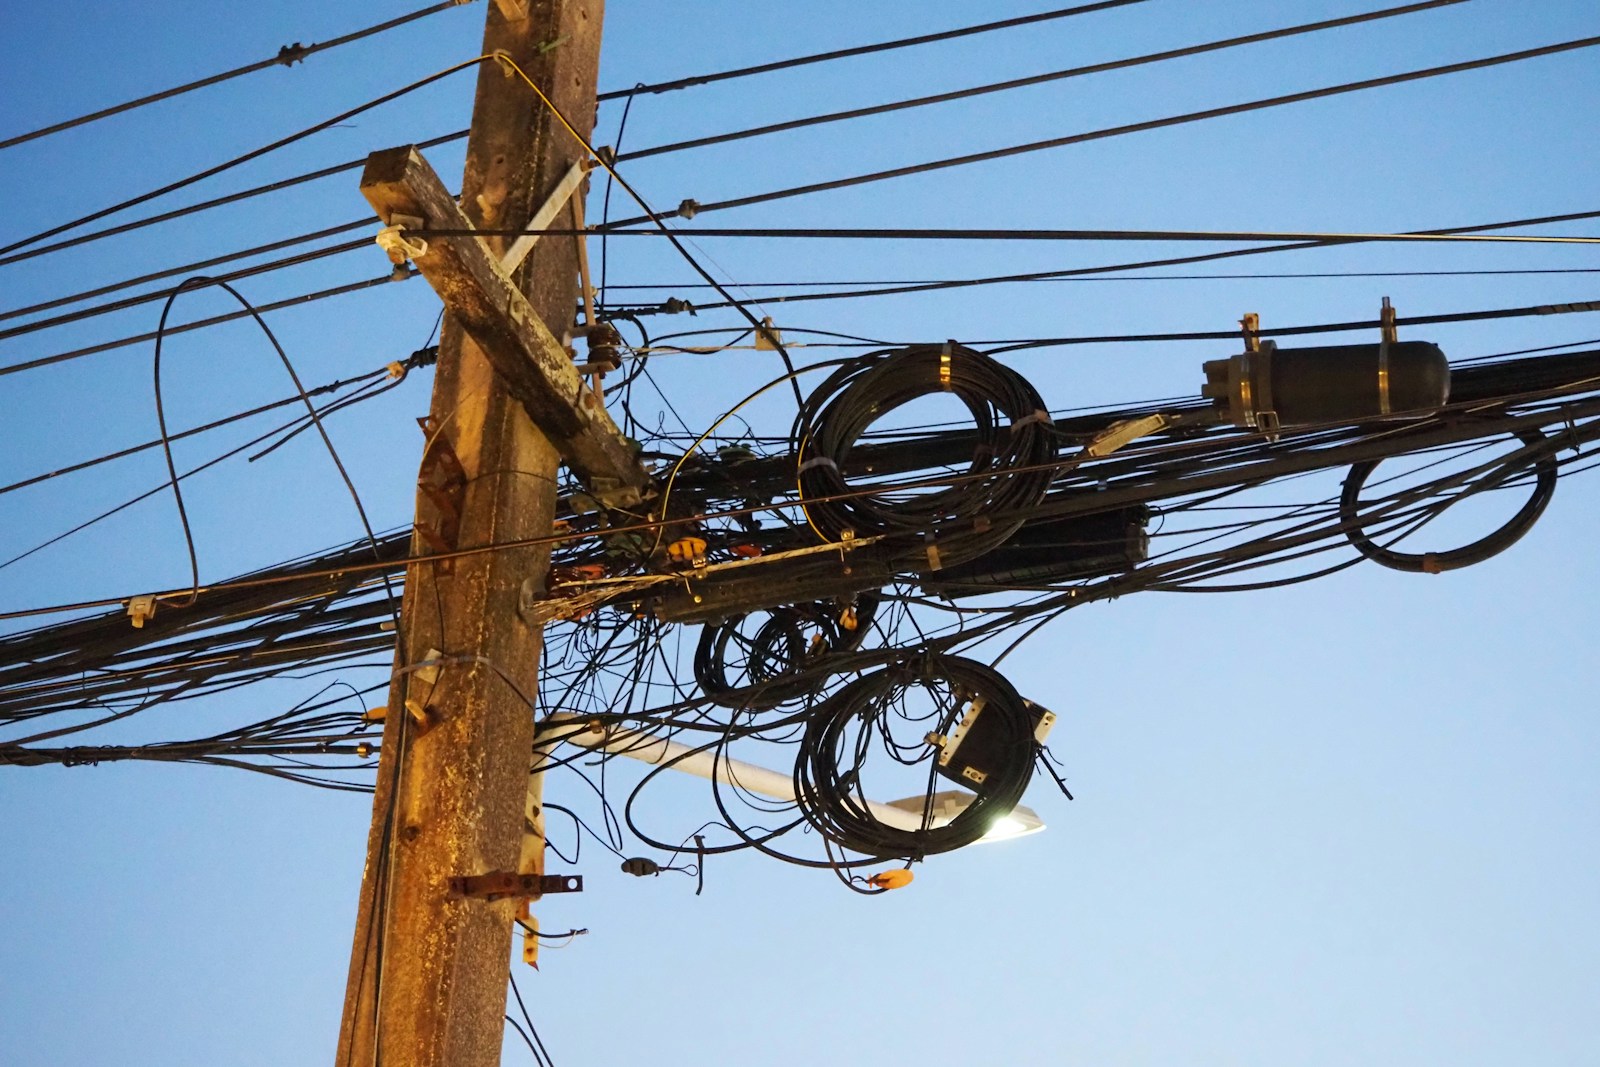
- Total U.S. greenhouse gas emissions: 7.5 billion metric tons
- Greenhouse gas emissions by component in 2007: 81.3% carbon dioxide, 10.8% methane, 5.7% nitrous oxide, 2.2% other
- Heaviest polluting U.S. sector by greenhouse gas emissions in 2007: Electric power industry, 2.5 billion metric tons
Sponsor
Find a Vetted Financial Advisor
- Finding a fiduciary financial advisor doesn't have to be hard. SmartAsset's free tool matches you with up to 3 financial advisors that serve your area in 5 minutes.
- Each advisor has been vetted by SmartAsset and is held to a fiduciary standard to act in your best interests. Get on the path toward achieving your financial goals!
More from ClimateCrisis 247
- The Jobs With the Most Workers Exposed to the Outdoors
- Where the Most Americans Are at Risk of Power Plant Emissions
- Countries With the Most Ambitious Climate Goals
- These 25 Cities Are Finding Ways to Lower Surface Temperature
