
Hottest Cities Where the Most People Don’t Have Air Conditioning
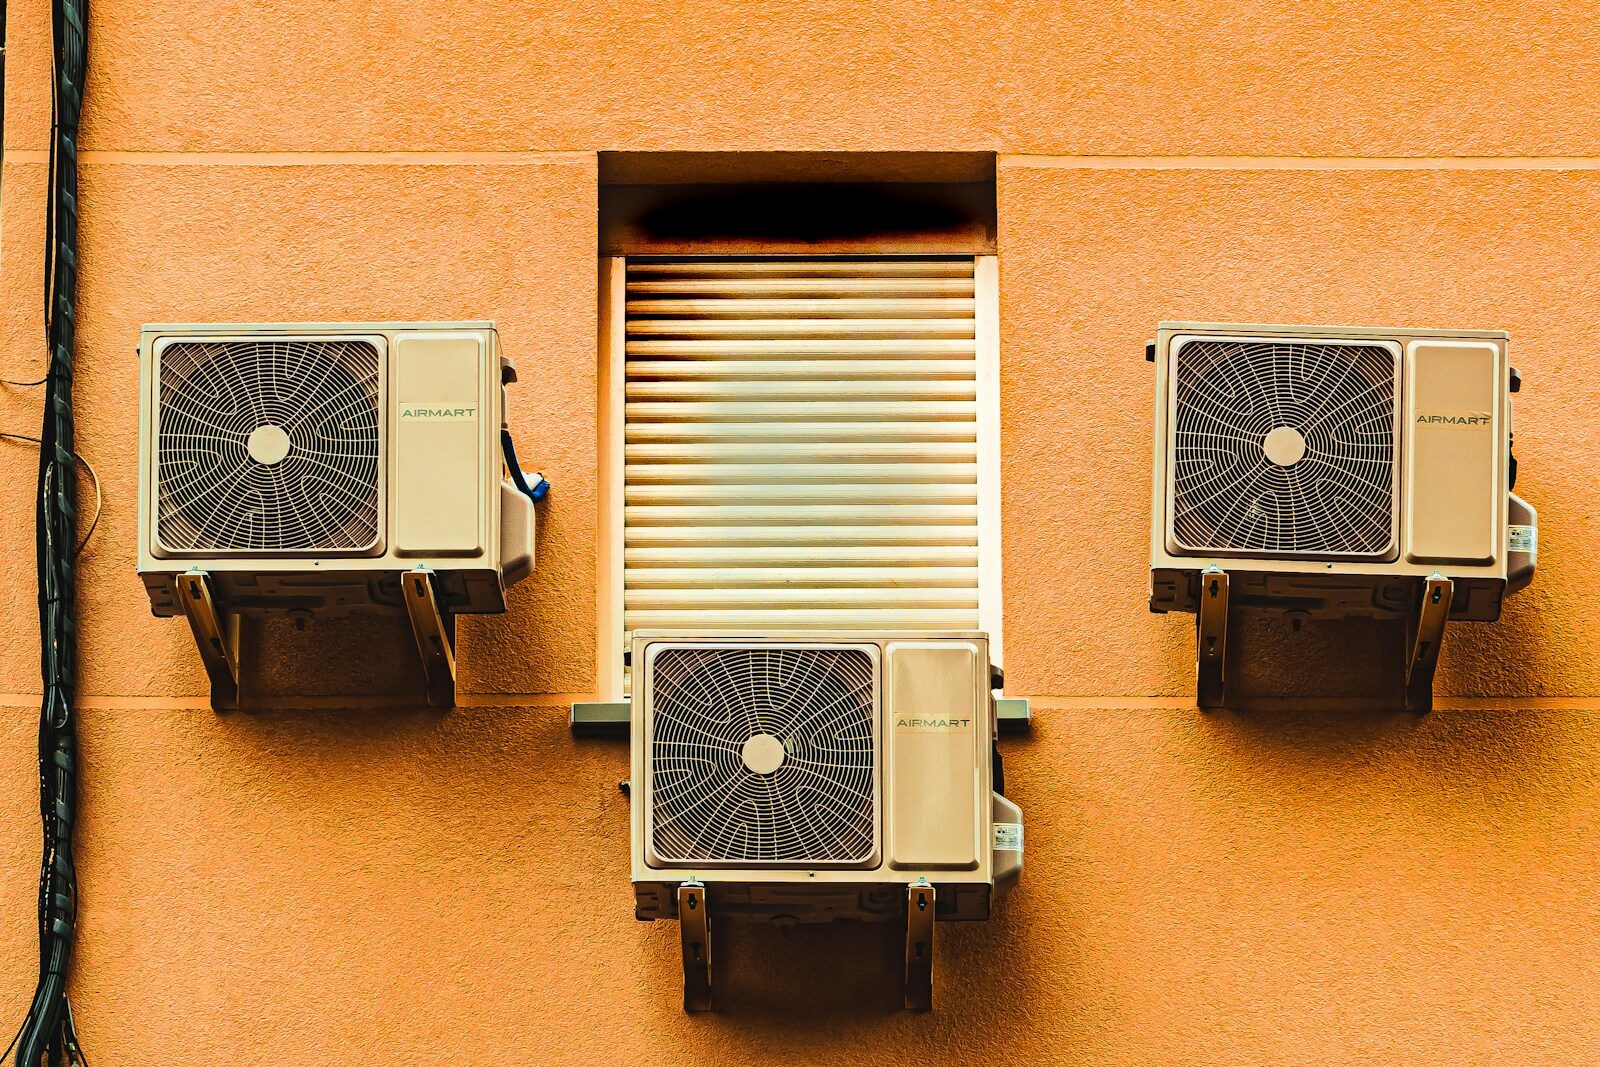
Air conditioning has played an instrumental, and often under-appreciated, role in shaping the United States. The first modern, electrical air conditioning unit was invented in 1902. By mid-century, air conditioning became practical and affordable enough for widespread residential use – and a leading driver of a population boom in some of the hottest parts of the country. Florida, for example, reported a peak annual population growth rate of 8% during the 1950s, approximately four times the comparable national rate at the time. That same decade, the number of people living in Phoenix, Arizona surged from about 107,000 to nearly 440,000.
Today, residential air conditioning is ubiquitous in nearly every corner of the country. According to the U.S. Census Bureau, 93% of all homes nationwide have some form of air conditioning. Even in the Northeast, a region where dangerously high temperatures are relatively rare, 92% of all new homes are built with air conditioning.
Despite the rapid and widespread adoption of residential air conditioning, there are still more than 8.8 million homes nationwide without it – and many of them are concentrated in places where high summer temperatures are a virtual guarantee.
Using data from the Census’ Local Air Conditioning Estimates program, Climate Crisis 247 identified the hottest cities where the most people do not have air conditioning. We ranked all metro areas with available data, aggregated from the county level, on the share of occupied housing units with no form of air conditioning. Only cities with historical average daily summer temperatures of at least 70°F are listed. Supplemental data on local electricity prices and summer temperatures are from the Electricity Price Hub and the National Oceanic and Atmospheric Administration, and are for the most populous county within each listed metro area. Additional data on state and metro area poverty rates and median household income are 1-year estimates from the Census’ 2024 American Community Survey.
Among the 10 metro areas on this list, anywhere from 10.9% to 50% of households do not have air conditioning. Limited air conditioning use in these places may be attributable in part to economic constraints, as several cities on this list have above-average electricity prices, and others have relatively high concentrations of poverty.
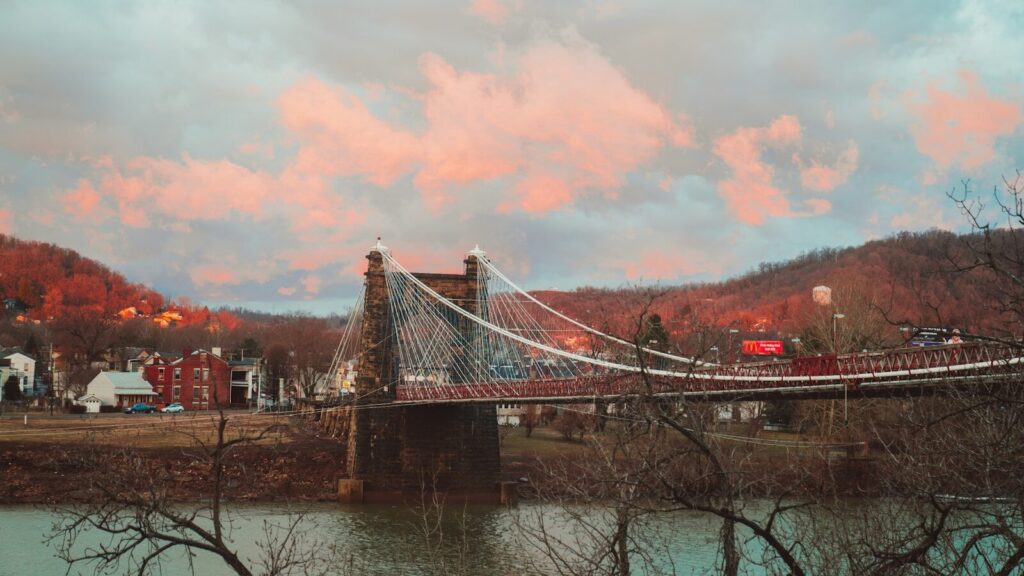
10. Wheeling, West Virginia
- Households with no air conditioning: 10.9% (6,210 total)
- Historical summer temperature norms: 70.5°F daily average (82.4°F daily high; 58.6°F daily low)
- Summer temperatures in 2025: 72.3°F daily average (83.1°F daily high; 61.5°F daily low)
- Average local electricity price: $0.16 per kilowatt hour (1.9% more that statewide average)
- Median household income: $55,531 ($5,267 less than statewide median)
- Poverty rate: 19.4% (2.7 ppt. more that statewide rate)
9. Cumberland, Maryland
- Households with no air conditioning: 11.4% (4,363 total)
- Historical summer temperature norms: 70.8°F daily average (83.4°F daily high; 58.1°F daily low)
- Summer temperatures in 2025: 72.8°F daily average (84.7°F daily high; 60.9°F daily low)
- Average local electricity price: $0.13 per kilowatt hour (28.2% less that statewide average)
- Median household income: $66,580 ($36,325 less than statewide median)
- Poverty rate: 15.0% (5.9 ppt. more that statewide rate)
8. Morgantown, West Virginia
- Households with no air conditioning: 11.7% (6,694 total)
- Historical summer temperature norms: 70.2°F daily average (81.6°F daily high; 58.9°F daily low)
- Summer temperatures in 2025: 72.3°F daily average (83.2°F daily high; 61.4°F daily low)
- Average local electricity price: $0.14 per kilowatt hour (11.5% less that statewide average)
- Median household income: $67,242 ($6,444 more than statewide median)
- Poverty rate: 18.0% (1.3 ppt. more that statewide rate)
7. Vallejo, California
- Households with no air conditioning: 16.1% (25,083 total)
- Historical summer temperature norms: 71.2°F daily average (86.9°F daily high; 55.5°F daily low)
- Summer temperatures in 2025: 72.8°F daily average (88.5°F daily high; 57.1°F daily low)
- Average local electricity price: $0.40 per kilowatt hour (35.4% more that statewide average)
- Median household income: $94,930 ($5,219 less than statewide median)
- Poverty rate: 10.2% (1.6 ppt. less that statewide rate)
6. Los Angeles, California
- Households with no air conditioning: 21.2% (945,736 total)
- Historical summer temperature norms: 72.0°F daily average (85.2°F daily high; 58.8°F daily low)
- Summer temperatures in 2025: 74.6°F daily average (87.1°F daily high; 62.0°F daily low)
- Average local electricity price: $0.34 per kilowatt hour (16.0% more that statewide average)
- Median household income: $96,405 ($3,744 less than statewide median)
- Poverty rate: 12.4% (0.6 ppt. more that statewide rate)
5. Flagstaff, Arizona
- Households with no air conditioning: 22.8% (12,232 total)
- Historical summer temperature norms: 70.6°F daily average (86.1°F daily high; 55.1°F daily low)
- Summer temperatures in 2025: 74.0°F daily average (90.2°F daily high; 57.7°F daily low)
- Average local electricity price: $0.17 per kilowatt hour (3.7% more that statewide average)
- Median household income: $75,164 ($6,322 less than statewide median)
- Poverty rate: 15.0% (3.3 ppt. more that statewide rate)
4. Farmington, New Mexico
- Households with no air conditioning: 23.0% (9,443 total)
- Historical summer temperature norms: 70.8°F daily average (86.6°F daily high; 54.9°F daily low)
- Summer temperatures in 2025: 75.2°F daily average (91.2°F daily high; 59.2°F daily low)
- Average local electricity price: $0.17 per kilowatt hour (12.8% more that statewide average)
- Median household income: $66,426 ($1,390 less than statewide median)
- Poverty rate: 19.0% (2.6 ppt. more that statewide rate)
3. San Diego, California
- Households with no air conditioning: 25.8% (299,246 total)
- Historical summer temperature norms: 72.8°F daily average (87.0°F daily high; 58.6°F daily low)
- Summer temperatures in 2025: 74.7°F daily average (89.1°F daily high; 60.3°F daily low)
- Average local electricity price: $0.37 per kilowatt hour (26.5% more that statewide average)
- Median household income: $109,132 ($8,983 more than statewide median)
- Poverty rate: 10.0% (1.8 ppt. less that statewide rate)
2. Honolulu, Hawaii
- Households with no air conditioning: 36.9% (124,374 total)
- Historical summer temperature norms: 76.2°F daily average (82.7°F daily high; 69.6°F daily low)
- Summer temperatures in 2025: 76.6°F daily average (81.9°F daily high; 71.2°F daily low)
- Average local electricity price: $0.50 per kilowatt hour (3.8% less that statewide average)
- Median household income: $105,205 ($4,460 more than statewide median)
- Poverty rate: 8.8% (1.2 ppt. less that statewide rate)
1. Kahului, Hawaii
- Households with no air conditioning: 50.0% (27,761 total)
- Historical summer temperature norms: 72.8°F daily average (79.5°F daily high; 66.2°F daily low)
- Summer temperatures in 2025: 73.4°F daily average (80.0°F daily high; 66.7°F daily low)
- Average local electricity price: $0.65 per kilowatt hour (24.0% more that statewide average)
- Median household income: $101,168 ($423 more than statewide median)
- Poverty rate: 9.7% (0.3 ppt. less that statewide rate)
More from ClimateCrisis 247
- Sea Level Rise Will Cost These U.S. Cities Billions by 2040
- Water Bills Surged More Than Other Costs in US Homes Over 10 Years, a ‘Striking’ New Report Shows
- The World’s Oceans Have ‘Dead Zones’ Now; these are the Largest
- These are the 10 Largest Wildfires in 2026 So far





