New Power Outage Data Reveals Patterns In Energy Inequality, Made Worse By Climate Change
In a well-synchronized dance of supply and demand, the U.S. electric grid powers the lives of hundreds of millions of Americans, sending unstorable energy through high-voltage transmission lines from the power plants where it is generated to the homes and businesses where it is consumed. But compound pressures of the 21st century – an aging grid infrastructure, rising electricity demand, and escalating extreme weather events – threaten to turn that dance from a smooth waltz into a mosh pit. And in severe circumstances that induce widespread, life-threatening power outages, the dance can descend into danse macabre – the dance of death.
In February 2021, Winter Storm Uri swept through large parts of the South and Northeast. Freezing temperatures resulted in way higher-than-normal energy demand, stressing out local electric grids and leading to extended power outages in some parts of the country. In Texas, energy authorities managed the strain by inducing rolling blackouts, leaving more than 4 million collective customers in complete darkness during historic low temperatures, with low-income and vulnerable populations bearing the brunt of the blackouts . According to some estimates, Uri caused approximately 700 deaths in Texas, many due to hypothermia or power failure in medical devices that depend on electricity.
In general, there is little empirical evidence on the distribution of power outages across the United States. Local coverage of regional disasters reveal that some parts of the country suffer more than others, and that the distribution of electricity disturbance events parallels other trends in environmental inequality, but researchers have long lacked large-scale data demonstrating how energy inequality functions on a national, systemic level.
New, comprehensive Power outage data
In May 2024, however, researchers from the Department of Energy’s Oak Ridge National Laboratory released the most comprehensive dataset on power outages in the United States to date through the Environment for Analysis of Geo-Located Energy Information platform. Using EAGLE-I data for 2021 through 2023, Climate Crisis 247 identified the counties where residents experience the most power outages. We reviewed additional data on natural hazards and health to see how extreme weather affects energy infrastructure and how vulnerable populations face disproportionate outage burdens.
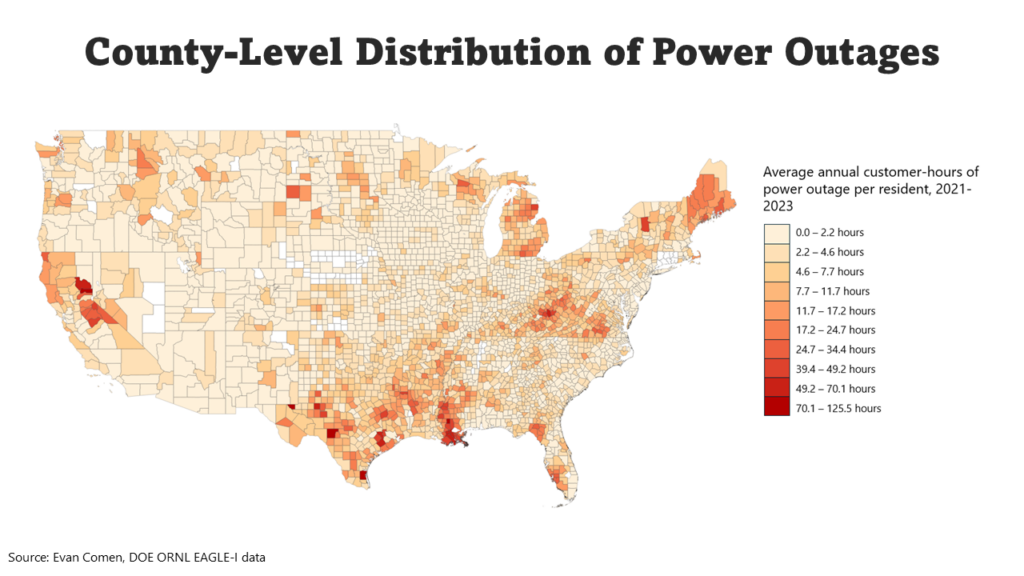
Nationwide, Americans suffered an average of 3.0 customer-hours of power outage in 2023. In some parts of the country, however, residents endured more than 30 times that. In a map of average customer-hours of power outage per resident, high-outage clusters stick out in regions like the Sierra Nevada mountains in California, southeastern Louisiana, the southern coalfields region of West Virginia, and various patches in central and southern Texas.
| Rank | County | Average customer-hours of power outage per resident, 2021-2023 |
|---|---|---|
| 1 | Loving County, TX | 125.5 |
| 2 | Kenedy County, TX | 124.9 |
| 3 | Sierra County, CA | 105.9 |
| 4 | St. Helena Parish, LA | 91.4 |
| 5 | Edwards County, TX | 91.0 |
| 6 | Lafourche Parish, LA | 70.1 |
| 7 | Plumas County, CA | 68.8 |
| 8 | Wharton County, TX | 67.1 |
| 9 | St. John the Baptist Parish, LA | 62.8 |
| 10 | Glasscock County, TX | 62.5 |
| 11 | Austin County, TX | 60.4 |
| 12 | St. Charles Parish, LA | 58.7 |
| 13 | St. James Parish, LA | 55.1 |
| 14 | Franklin, VA | 51.2 |
| 15 | Wayne County, WV | 49.4 |
| 16 | Claiborne County, MS | 49.2 |
| 17 | Plaquemines Parish, LA | 47.3 |
| 18 | Alcona County, MI | 47.3 |
| 19 | Tangipahoa Parish, LA | 47.1 |
| 20 | Mariposa County, CA | 47.0 |
| 21 | Irion County, TX | 46.3 |
| 22 | Wilkinson County, MS | 45.0 |
| 23 | Lincoln County, WV | 41.6 |
| 24 | Marion County, TX | 40.8 |
| 25 | Alpine County, CA | 40.4 |
| 26 | Lawrence County, KY | 40.3 |
| 27 | Jefferson County, MS | 39.8 |
| 28 | Jefferson Parish, LA | 39.2 |
| 29 | Colorado County, TX | 38.5 |
| 30 | Terrebonne Parish, LA | 38.3 |
| 31 | Hamilton County, NY | 38.0 |
| 32 | Leon County, TX | 38.0 |
| 33 | Waller County, TX | 37.6 |
| 34 | Livingston Parish, LA | 34.6 |
| 35 | Borden County, TX | 34.4 |
| 36 | Red River Parish, LA | 33.3 |
| 37 | Tuolumne County, CA | 32.9 |
| 38 | Elliott County, KY | 32.7 |
| 39 | Calaveras County, CA | 32.2 |
| 40 | Tensas Parish, LA | 31.8 |
| 41 | Sterling County, TX | 31.4 |
| 42 | Charlotte County, FL | 31.2 |
| 43 | Orleans Parish, LA | 30.6 |
| 44 | Lee County, FL | 30.4 |
| 45 | Charlotte County, VA | 30.3 |
| 46 | Lunenburg County, VA | 30.0 |
| 47 | Ascension Parish, LA | 29.2 |
| 48 | Assumption Parish, LA | 29.0 |
| 49 | Franklin County, TX | 29.0 |
| 50 | Hillsdale County, MI | 28.0 |
| 51 | Sabine Parish, LA | 28.0 |
| 52 | Gillespie County, TX | 27.9 |
| 53 | Madison County, FL | 27.9 |
| 54 | Mono County, CA | 27.8 |
| 55 | Vilas County, WI | 27.4 |
| 56 | Carter County, KY | 27.4 |
| 57 | Franklin County, MS | 27.1 |
| 58 | Hancock County, ME | 27.0 |
| 59 | Nevada County, CA | 26.2 |
| 60 | Del Norte County, CA | 26.2 |
| 61 | Wirt County, WV | 26.1 |
| 62 | Harding County, SD | 26.0 |
| 63 | De Soto Parish, LA | 25.9 |
| 64 | Lincoln County, ME | 25.8 |
| 65 | Real County, TX | 24.7 |
| 66 | Lafayette County, FL | 24.6 |
| 67 | Taylor County, FL | 24.3 |
| 68 | Oxford County, ME | 24.2 |
| 69 | Copiah County, MS | 23.9 |
| 70 | Robertson County, TX | 23.6 |
| 71 | Hamilton County, FL | 23.5 |
| 72 | Mason County, TX | 23.5 |
| 73 | St. Bernard Parish, LA | 23.2 |
| 74 | Reagan County, TX | 23.1 |
| 75 | Clay County, WV | 22.9 |
| 76 | San Juan County, WA | 22.6 |
| 77 | Mingo County, WV | 22.6 |
| 78 | Owsley County, KY | 22.5 |
| 79 | Amador County, CA | 22.4 |
| 80 | East Feliciana Parish, LA | 22.3 |
| 81 | Knott County, KY | 22.2 |
| 82 | Duval County, TX | 22.1 |
| 83 | Dinwiddie County, VA | 22.1 |
| 84 | Cabell County, WV | 22.1 |
| 85 | Calhoun County, WV | 21.9 |
| 86 | Menifee County, KY | 21.8 |
| 87 | Jackson County, MI | 21.7 |
| 88 | St. Tammany Parish, LA | 21.7 |
| 89 | Hocking County, OH | 21.6 |
| 90 | Sharkey County, MS | 21.2 |
| 91 | Suwannee County, FL | 21.1 |
| 92 | Marshall County, WV | 21.1 |
| 93 | Prairie County, AR | 21.0 |
| 94 | Chambers County, TX | 21.0 |
| 95 | Attala County, MS | 20.9 |
| 96 | Ritchie County, WV | 20.9 |
| 97 | Forest County, PA | 20.8 |
| 98 | DeSoto County, FL | 20.8 |
| 99 | Trinity County, TX | 20.8 |
| 100 | Jeff Davis County, TX | 20.7 |
Many of the counties with the most outages are in storm-prone regions where frequent severe weather causes numerous grid disruptions. According to data from FEMA’s National Risk Index, for example, an estimated 6.8% of agriculture value in Kenedy County, Texas, is lost every year to hurricanes, the largest percentage of any U.S. county. Of the 100 counties with the most power outages per capita, 48 are considered by FEMA to have relatively high or very high hurricane loss.
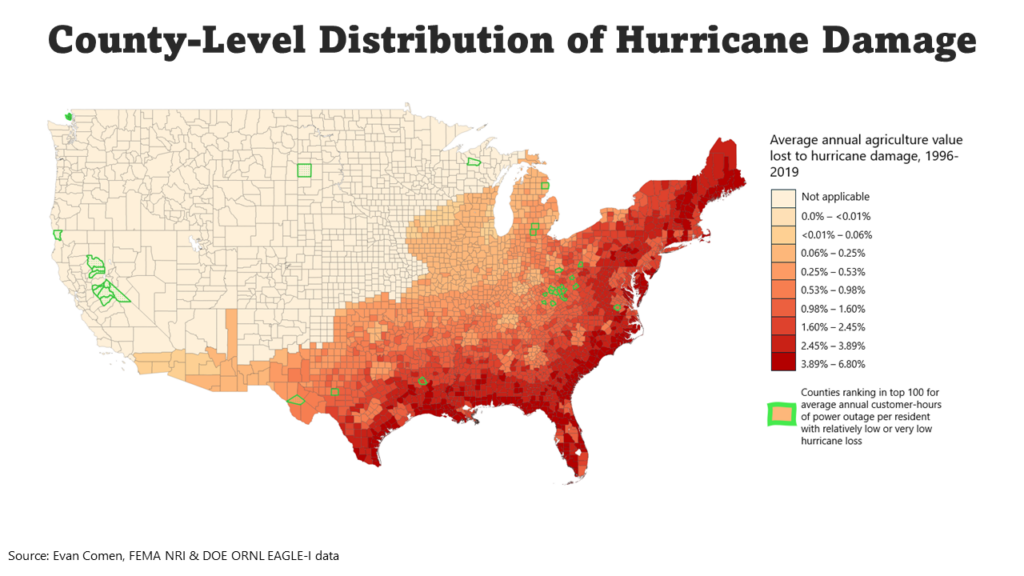
While severe weather is the leading cause of power outage, not all blackout-prone counties are in hurricane country. The neighboring Great Lakes counties of Alcona, Oscoda, Ogemaw, and Arenac in Michigan all rank among the top 100 most outage-prone counties, despite having relatively low or very low hurricane loss. Other problematic regions where storms are likely not to blame for above-average outage activity – but rather issues stemming from infrastructure quality or management – include Lawrence, Elliott, and Carter County in Kentucky; Wayne, Lincoln, and Mingo County in West Virginia; and Central Valley California. Vilas County, Wisconsin and Harding County, South Dakota also stand out.
Compounding burdens
While most Americans rely on a functioning electric grid to go about their daily routines, a power outage can be the difference between life and death for the medically vulnerable. In September 2017, for example, Hurricane Irma made landfall in southern Florida, causing power outages for nearly two-thirds of electricity customers in the state and compromising the health of millions of high-risk individuals. In one Hollywood nursing home, power outages led to the failure of the facility’s air conditioning system and the deaths of a dozen residents due to heat exposure.
The problem is particularly acute for those reliant on electricity-dependent life support equipment like ventilators and dialysis machines. Nationwide, 9.1 in 1,000 Americans use durable medical equipment that requires electricity to function. During a widespread power outage, patients in facilities without robust backup power generation are at greater risk of mortality. In many poor, rural parts of the country, populations face the dual burden of frequent power outages and a high prevalence of patients dependent on electric medical equipment.
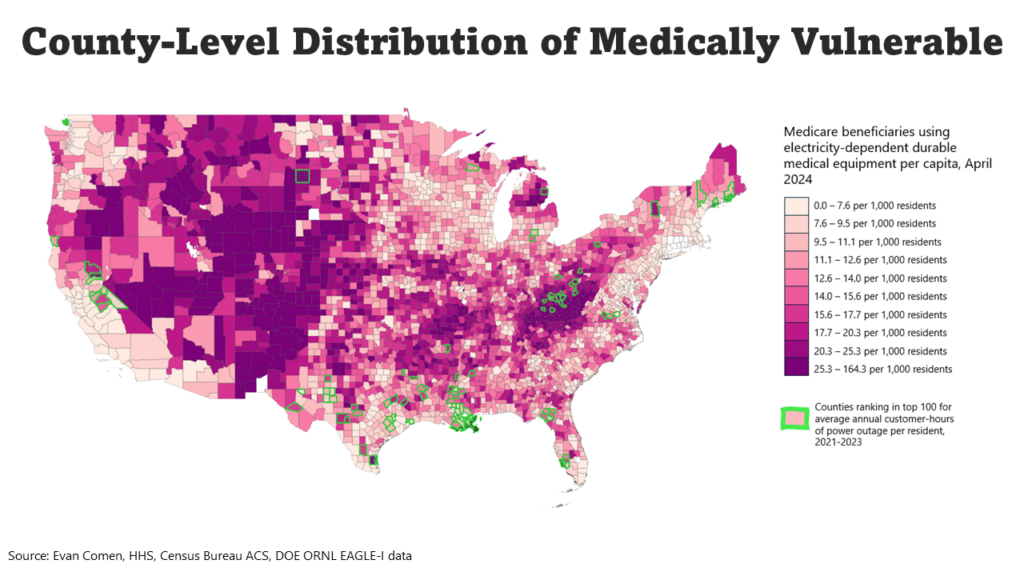
A bivariate analysis reveals the places where an unstable electricity supply and a high prevalence of medically vulnerable residents compound to the greatest burden. In Franklin, Virginia, for example, residents experience an average of 51.2 customer-hours of power outage per year – more than 15 times the national figure – putting the city’s most vulnerable – 89.6 in 1,000 Franklin residents use electricity-dependent medical equipment, nearly 10 times the national figure – in a particularly high-risk position.
Income and energy inequality
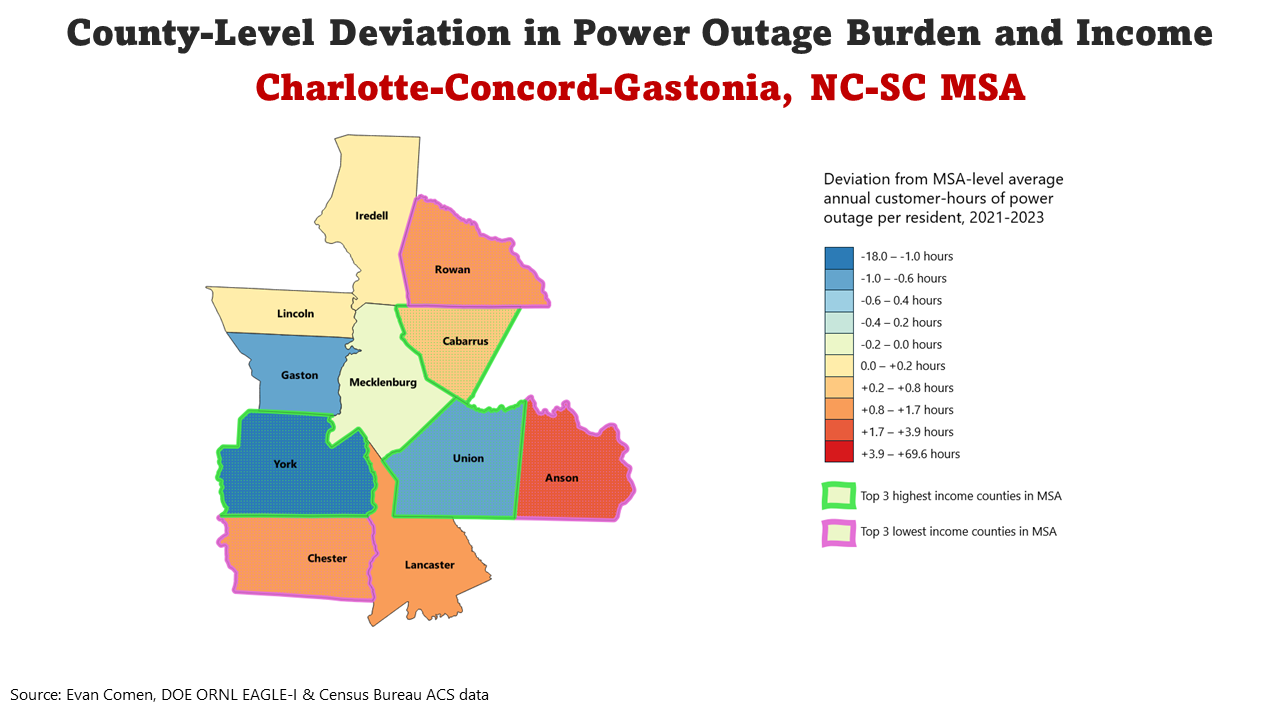
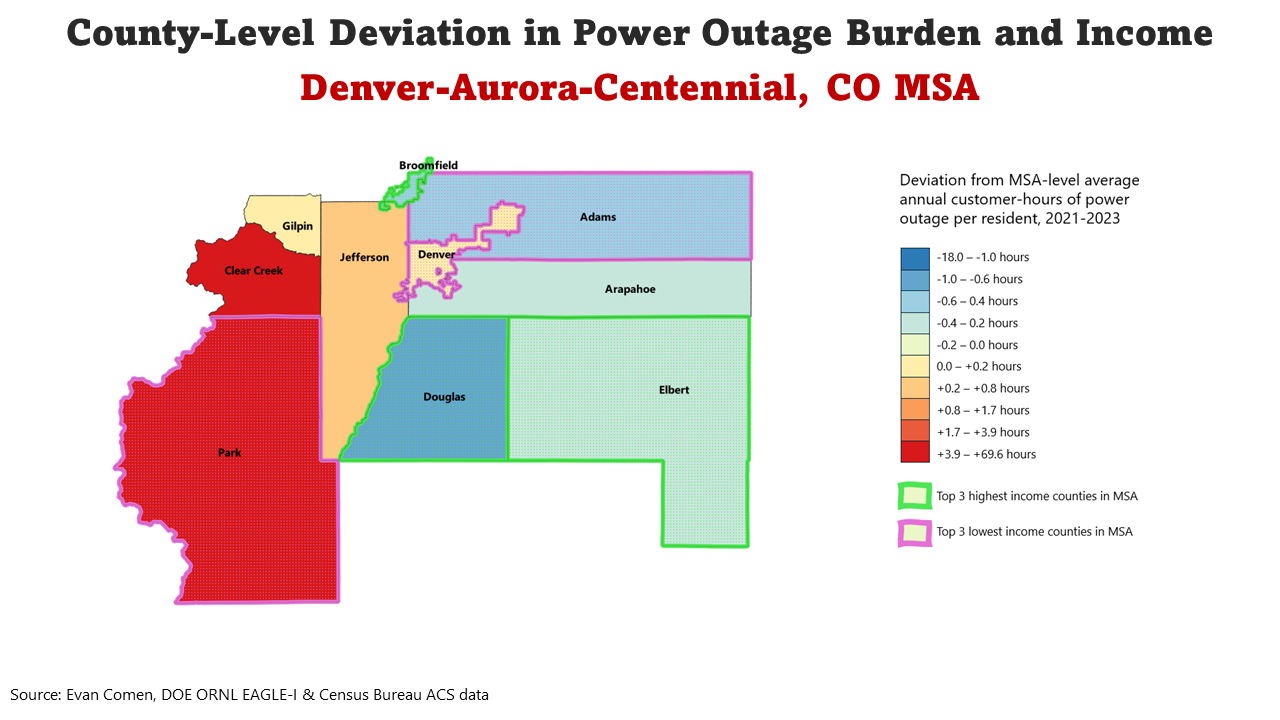
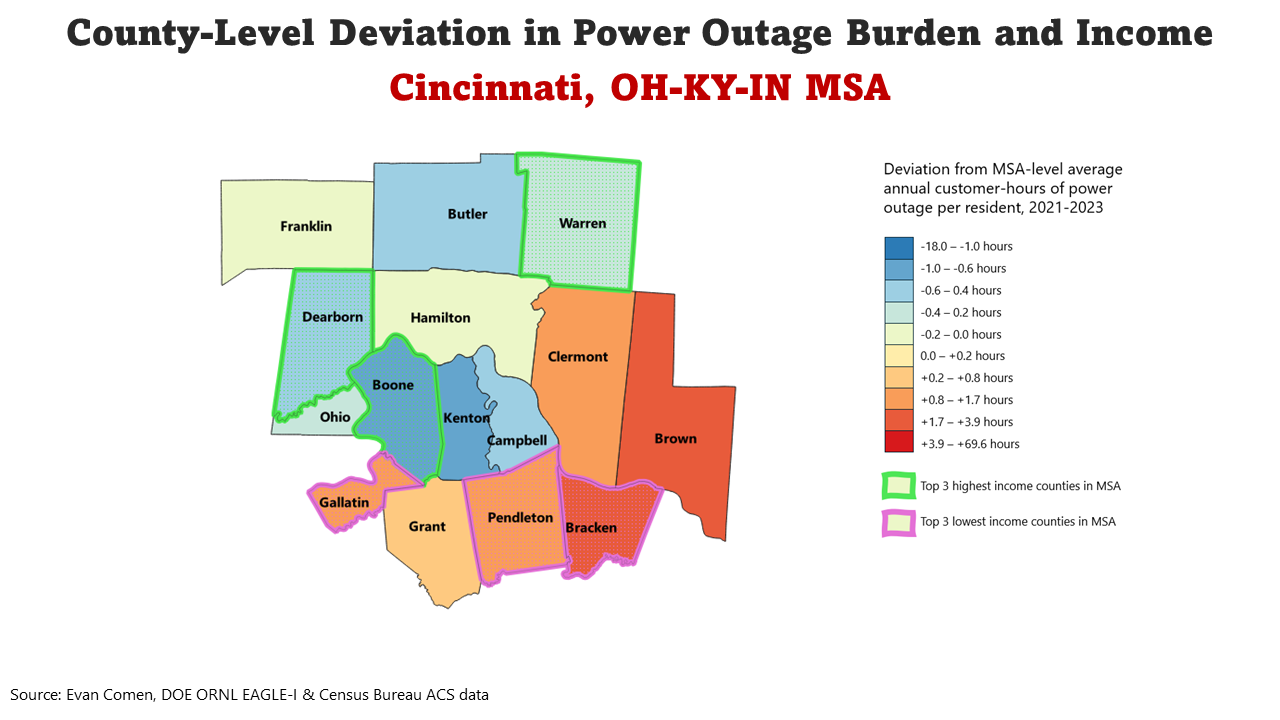
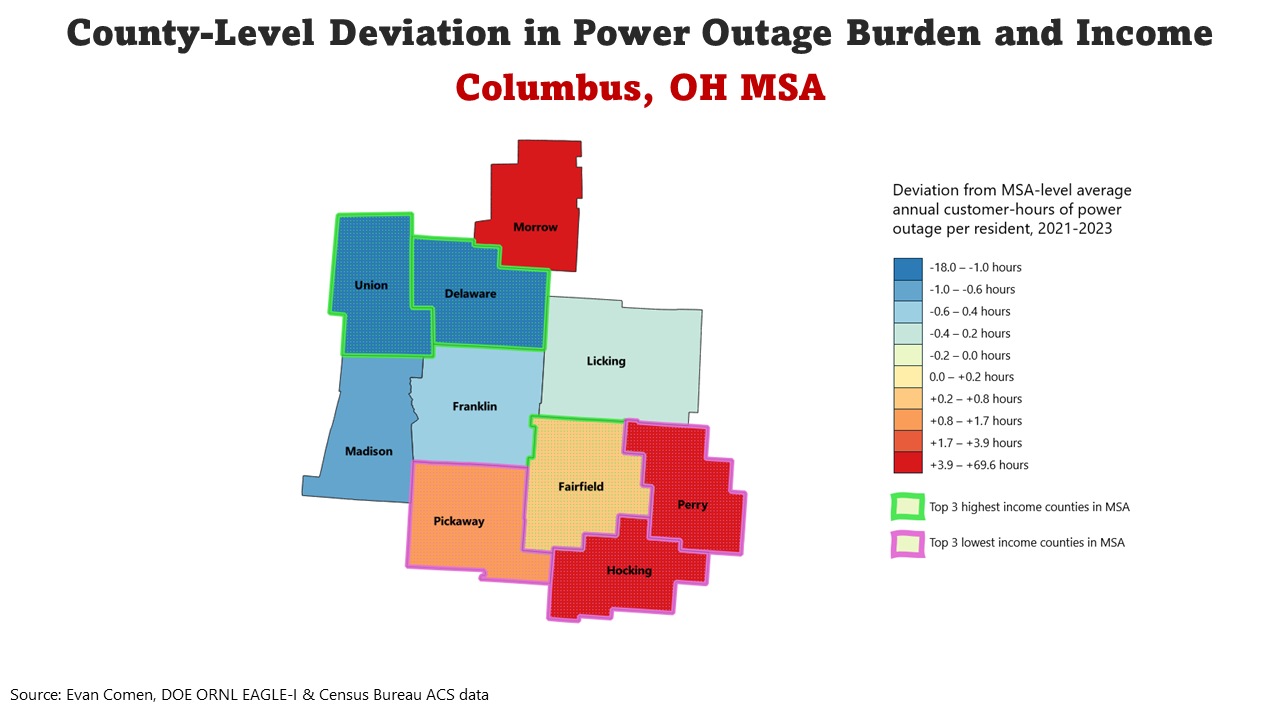
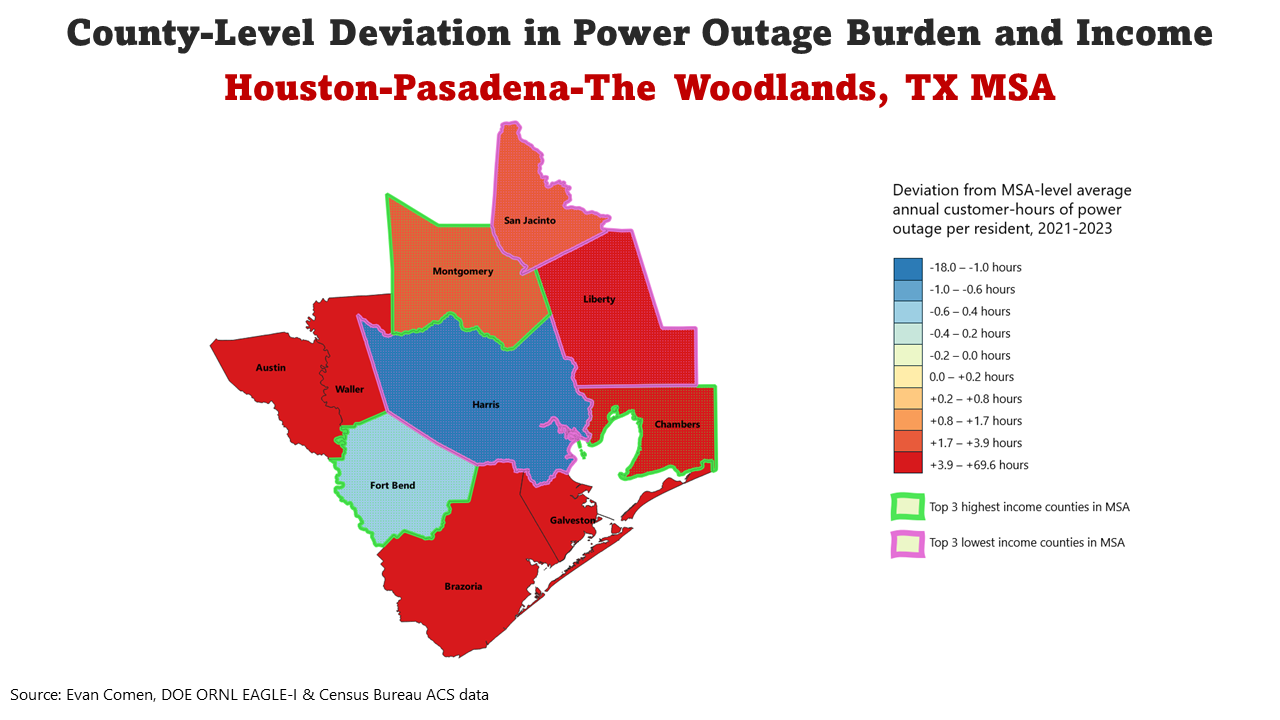
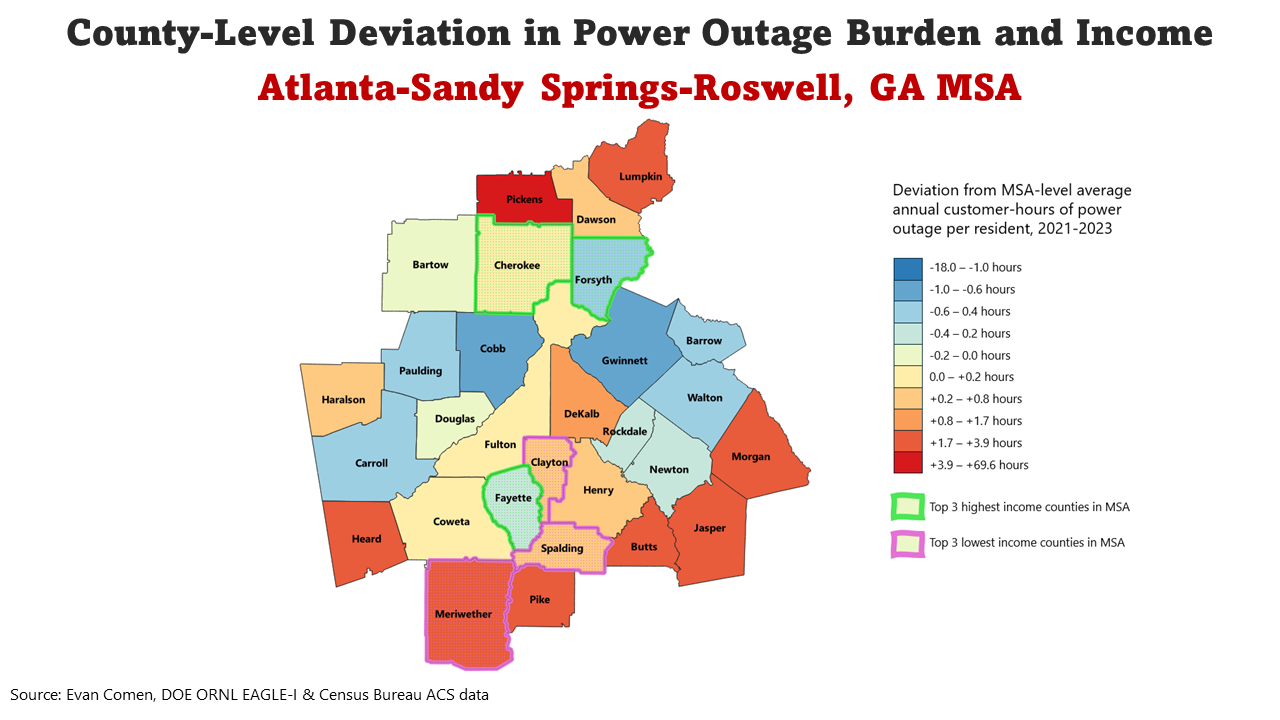
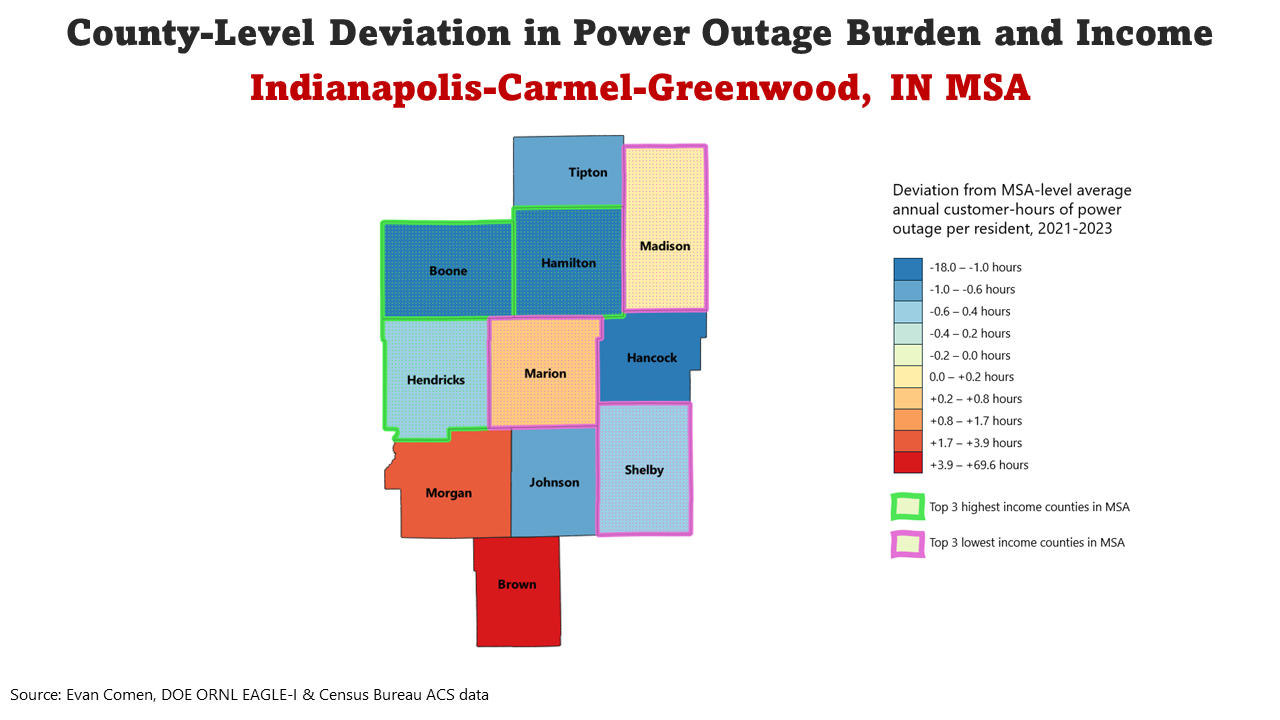
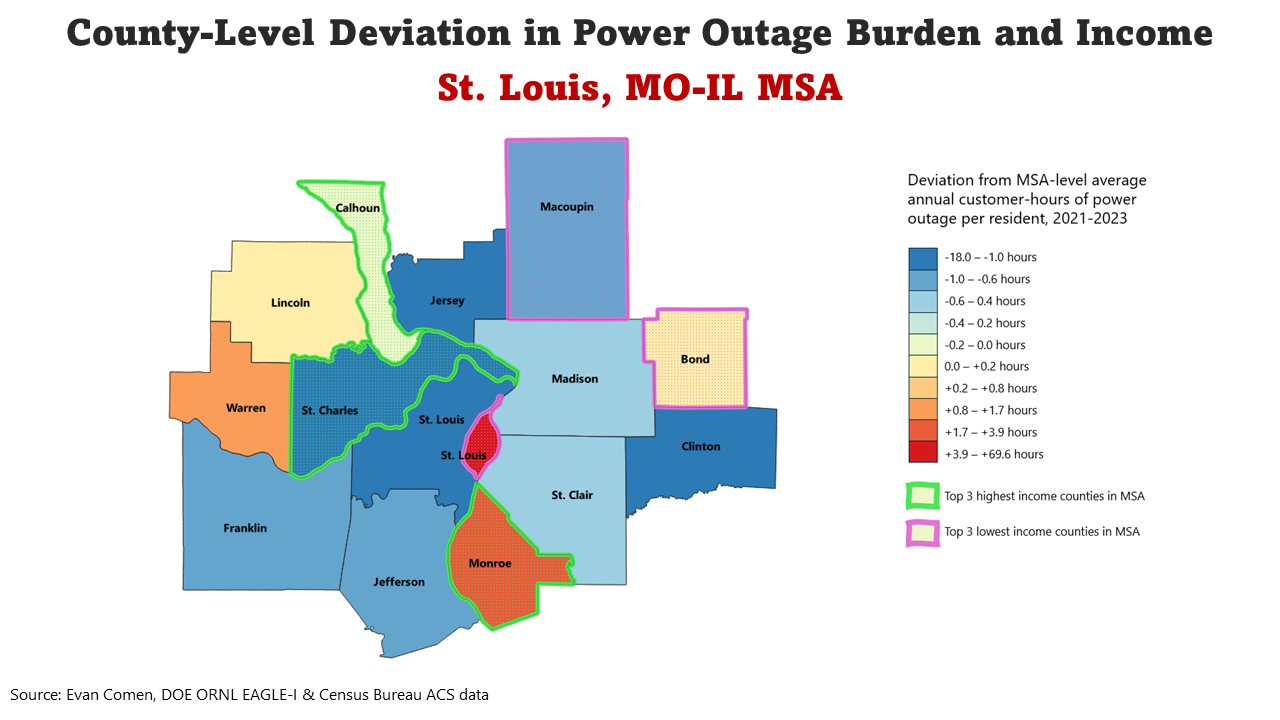
Poor communities tend to go without power longer and more often than rich ones. But while on a national scale the duration and frequency of power outages are largely functions of hurricane impact, variations in the quality of infrastructure and inequitable demand management strategies can create smaller-scale disparities in electricity access along socioeconomic lines. Citywide variations in power outage distribution reveal stark patterns of income and energy inequality at the local level.
In the Charlotte metropolitan area, for example, Anson County, Chester County, and Rowan County – the three poorest counties in the MSA by median household income – also rank as the top three counties with the most power outages. Meanwhile, York County – the third wealthiest in the MSA – experiences the fewest power outages. Within the metropolitan statistical area, an increase of $10,000 in median household income is associated with an average decrease of 33 minutes in power outages per year at the county level.
Preventing further crisis
Without intervention, existing disparities are likely to worsen. Storms and severe weather are the primary cause of power loss, responsible for 83% of all large-scale outages that affected at least 50,000 customers from 2000 to 2021. And as climate change leads to more frequent severe weather events – and increasing energy demand from data centers, EVs, and a growing population conflict with supply challenges related to the green energy transition – strain on the grid could reach crisis levels.
To prevent future disaster, authorities must invest in improving energy reliability and develop strategies to mitigate existing vulnerabilities in the electric grid. In the meantime, state and local agencies can use data like these to identify existing power outage hotspots and implement policies to better ensure the safety and well-being of all Americans on the grid.
Methodology
To determine the counties with the most power outages, Climate Crisis 247 reviewed data on power outages in 15-minute intervals from the Department of Energy’s Oak Ridge National Laboratory. Counties were ranked based on the number of average annual customer-hours of power outage per resident in the years 2021 to 2023. Supplemental data on the annualized percentage of agriculture value lost to hurricane damage from 1996 to 2019 is from the FEMA National Risk Index. Data on the number of Medicare beneficiaries using electricity-dependent durable medical equipment is from the U.S. Department of Health & Human Services and is for April 2024. Data on median household income and population is from the U.S. Census Bureau’s American Community Survey and are five-year estimates for 2022.
Sponsor
Find a Vetted Financial Advisor
- Finding a fiduciary financial advisor doesn't have to be hard. SmartAsset's free tool matches you with up to 3 financial advisors that serve your area in 5 minutes.
- Each advisor has been vetted by SmartAsset and is held to a fiduciary standard to act in your best interests. Get on the path toward achieving your financial goals!

