Cities in Alabama and Ohio Are Reducing Air Pollution the Most; See The Full List
 https://climate-crisis-247-bucket.nyc3.cdn.digitaloceanspaces.com/wp-content/uploads/2024/12/07233431/60575-150x150.jpeg
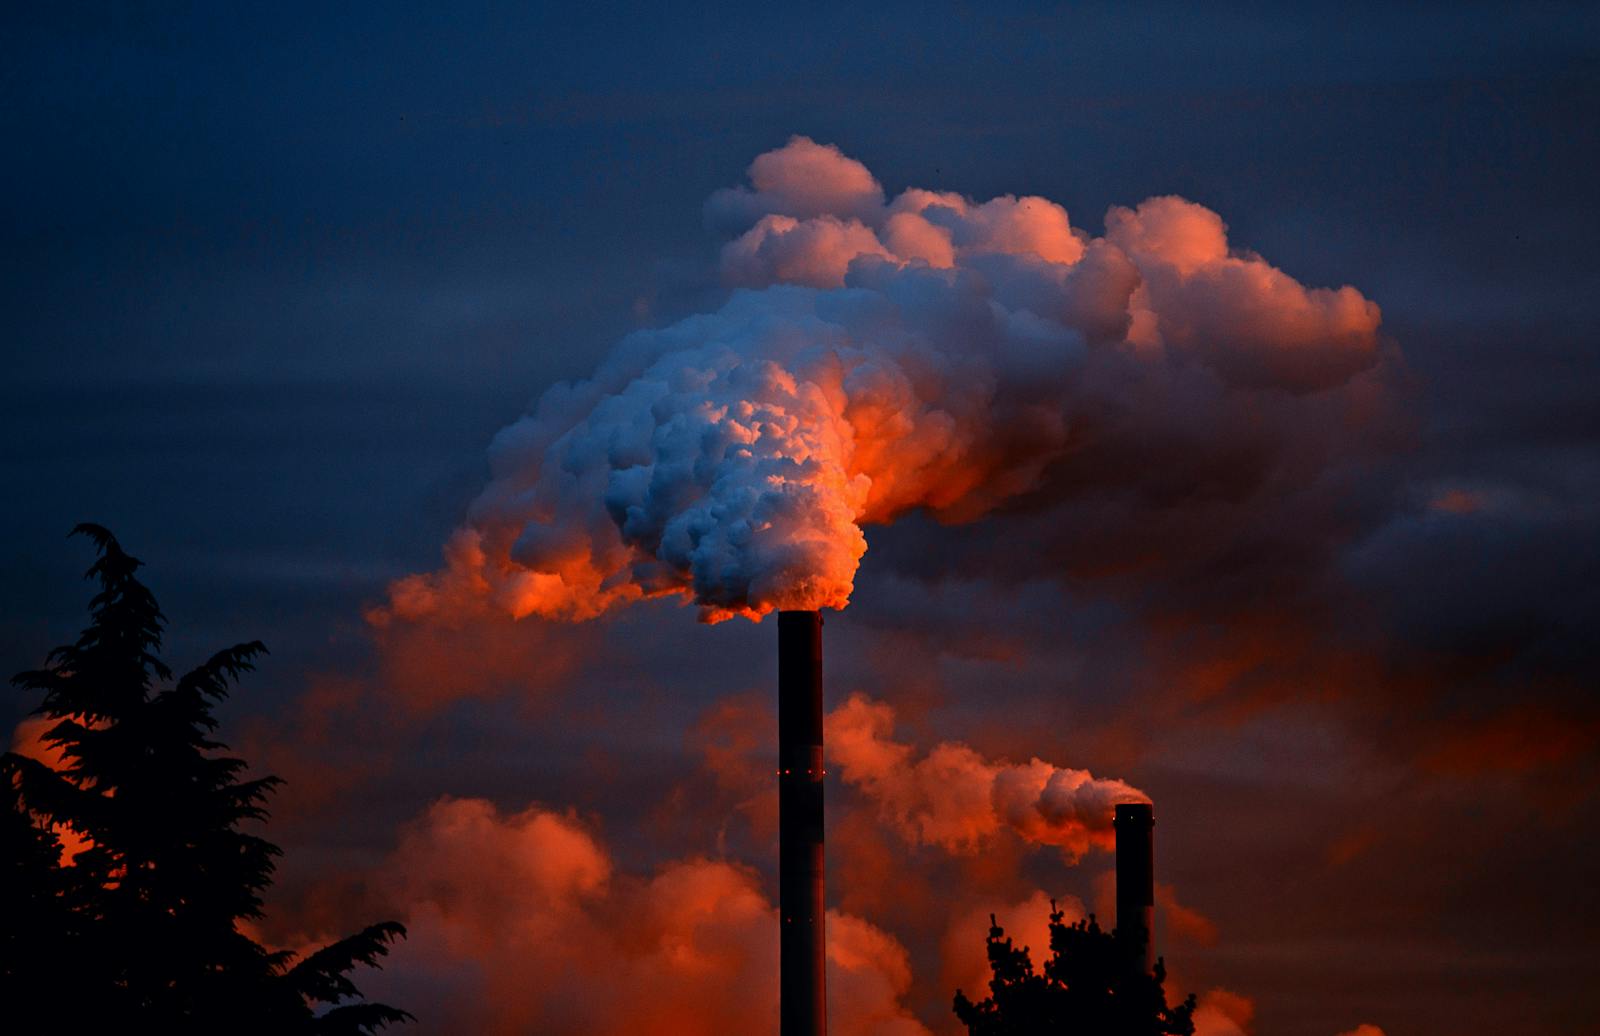
The steady increase in air quality in the United States over the last 25 years has been one of the most significant public health achievements of the 21st century. On average, particulate matter concentration has fallen 36.8% in the U.S. from 2000 to 2023, with a handful of major cities making far greater improvements.
Whence the next pandemic? Cities Where the Next Pandemic Is Most Likely to Break Out
New border crisis? Climate Change Pushing Vampire Bats North Into Texas
Some cities – many of them former manufacturing hubs throughout the South and Rust Belt – have managed to reduce PM2.5 concentrations by more than half since 2000. Other cities have achieved significant reductions in particulate matter concentration while accommodating rapid population growth. A look at EPA data reveals the cities that have reduced air pollution the most in the last 25 years.
To determine the cities reducing air pollution the most, Climate Crisis 247 reviewed historical data on air quality from the EPA. Metropolitan statistical areas were ranked based on the raw change in average annual PM2.5 concentration from 2000 to 2023. Supplemental data on population is from the U.S. Census Bureau.
25. Columbia, SC

- Average PM2.5 concentration, 2023: 8.0 µg/m³ (-7.9 µg/m³ from 2000)
- Average PM2.5 concentration, 2000: 15.9 µg/m³
- Population change, 2000-2023: +32.4%
- Total population, 2023: 856,889
24. Cleveland-Elyria, OH

- Average PM2.5 concentration, 2023: 9.9 µg/m³ (-7.9 µg/m³ from 2000)
- Average PM2.5 concentration, 2000: 17.8 µg/m³
- Population change, 2000-2023: +0.5%
- Total population, 2023: 2,158,932
23. Canton-Massillon, OH

- Average PM2.5 concentration, 2023: 10.7 µg/m³ (-7.9 µg/m³ from 2000)
- Average PM2.5 concentration, 2000: 18.6 µg/m³
- Population change, 2000-2023: -1.8%
- Total population, 2023: 399,474
22. Winston-Salem, NC

- Average PM2.5 concentration, 2023: 9.4 µg/m³ (-8.0 µg/m³ from 2000)
- Average PM2.5 concentration, 2000: 17.4 µg/m³
- Population change, 2000-2023: +64.9%
- Total population, 2023: 695,630
21. Lancaster, PA

- Average PM2.5 concentration, 2023: 9.8 µg/m³ (-8.0 µg/m³ from 2000)
- Average PM2.5 concentration, 2000: 17.8 µg/m³
- Population change, 2000-2023: +18.7%
- Total population, 2023: 558,589
20. Charlotte-Concord-Gastonia, NC-SC
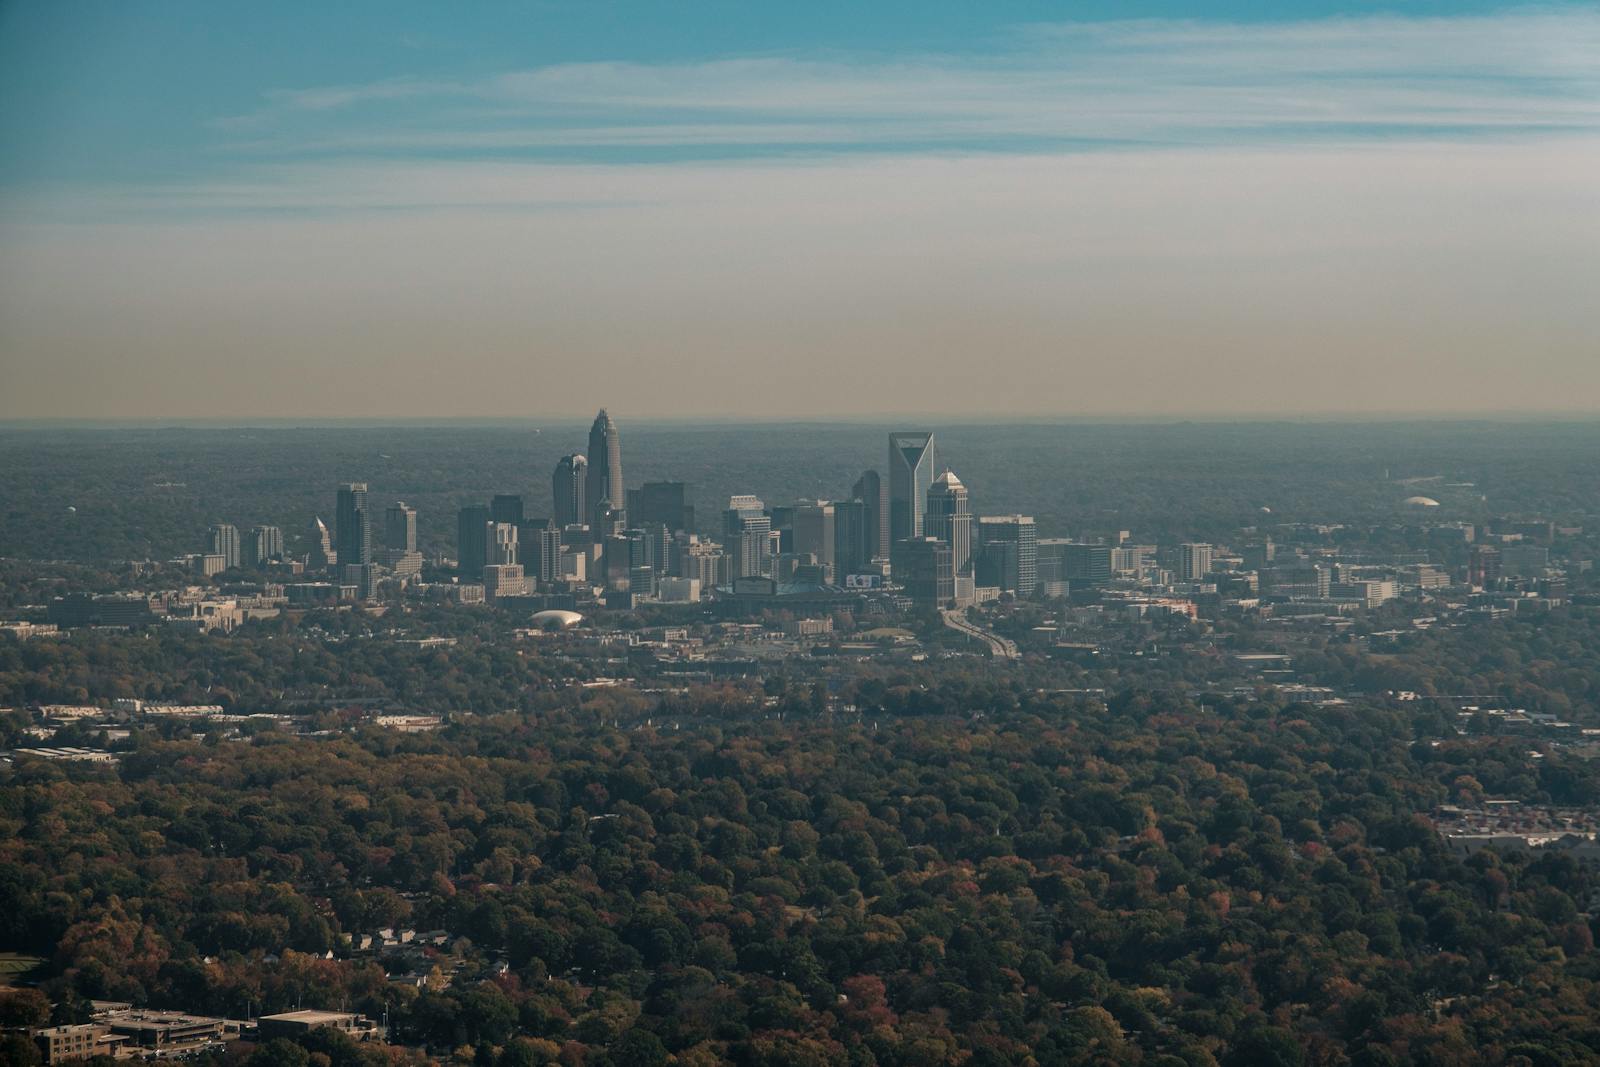
- Average PM2.5 concentration, 2023: 8.3 µg/m³ (-8.1 µg/m³ from 2000)
- Average PM2.5 concentration, 2000: 16.4 µg/m³
- Population change, 2000-2023: +110.8%
- Total population, 2023: 2,805,115
19. Modesto, CA

- Average PM2.5 concentration, 2023: 10.5 µg/m³ (-8.2 µg/m³ from 2000)
- Average PM2.5 concentration, 2000: 18.7 µg/m³
- Population change, 2000-2023: +23.4%
- Total population, 2023: 551,430
18. Kingsport-Bristol-Bristol, TN-VA

- Average PM2.5 concentration, 2023: 8.4 µg/m³ (-8.2 µg/m³ from 2000)
- Average PM2.5 concentration, 2000: 16.6 µg/m³
- Population change, 2000-2023: +4.7%
- Total population, 2023: 312,490
17. Lexington-Fayette, KY

- Average PM2.5 concentration, 2023: 8.3 µg/m³ (-8.3 µg/m³ from 2000)
- Average PM2.5 concentration, 2000: 16.6 µg/m³
- Population change, 2000-2023: +27.4%
- Total population, 2023: 520,045
16. Fort Payne, AL

- Average PM2.5 concentration, 2023: 8.9 µg/m³ (-8.3 µg/m³ from 2000)
- Average PM2.5 concentration, 2000: 17.2 µg/m³
- Population change, 2000-2023: +12.6%
- Total population, 2023: 72,569
15. Columbus, OH

- Average PM2.5 concentration, 2023: 9.9 µg/m³ (-8.3 µg/m³ from 2000)
- Average PM2.5 concentration, 2000: 18.2 µg/m³
- Population change, 2000-2023: +35.2%
- Total population, 2023: 2,180,271
14. Akron, OH
- Average PM2.5 concentration, 2023: 7.5 µg/m³ (-8.7 µg/m³ from 2000)
- Average PM2.5 concentration, 2000: 16.2 µg/m³
- Population change, 2000-2023: +0.5%
- Total population, 2023: 698,398
13. Parkersburg-Vienna, WV
- Average PM2.5 concentration, 2023: 8.9 µg/m³ (-8.9 µg/m³ from 2000)
- Average PM2.5 concentration, 2000: 17.8 µg/m³
- Population change, 2000-2023: -46.8%
- Total population, 2023: 87,628
12. Los Angeles-Long Beach-Anaheim, CA
- Average PM2.5 concentration, 2023: 9.9 µg/m³ (-9.0 µg/m³ from 2000)
- Average PM2.5 concentration, 2000: 18.9 µg/m³
- Population change, 2000-2023: N/A
- Total population, 2023: 12,799,100
11. Atlanta-Sandy Springs-Roswell, GA
- Average PM2.5 concentration, 2023: 9.8 µg/m³ (-9.0 µg/m³ from 2000)
- Average PM2.5 concentration, 2000: 18.8 µg/m³
- Population change, 2000-2023: +48.4%
- Total population, 2023: 6,305,839
10. Asheville, NC

- Average PM2.5 concentration, 2023: 6.4 µg/m³ (-9.0 µg/m³ from 2000)
- Average PM2.5 concentration, 2000: 15.4 µg/m³
- Population change, 2000-2023: +13.0%
- Total population, 2023: 417,202
9. Gainesville, GA

- Average PM2.5 concentration, 2023: 8.9 µg/m³ (-9.2 µg/m³ from 2000)
- Average PM2.5 concentration, 2000: 18.1 µg/m³
- Population change, 2000-2023: +56.0%
- Total population, 2023: 217,267
8. Bakersfield, CA

- Average PM2.5 concentration, 2023: 12.2 µg/m³ (-9.2 µg/m³ from 2000)
- Average PM2.5 concentration, 2000: 21.4 µg/m³
- Population change, 2000-2023: +38.1%
- Total population, 2023: 913,820
7. Chattanooga, TN-GA

- Average PM2.5 concentration, 2023: 9.1 µg/m³ (-9.3 µg/m³ from 2000)
- Average PM2.5 concentration, 2000: 18.4 µg/m³
- Population change, 2000-2023: +21.8%
- Total population, 2023: 580,353
6. Charleston, WV

- Average PM2.5 concentration, 2023: 8.8 µg/m³ (-9.3 µg/m³ from 2000)
- Average PM2.5 concentration, 2000: 18.1 µg/m³
- Population change, 2000-2023: -34.4%
- Total population, 2023: 203,259
5. Hickory-Lenoir-Morganton, NC

- Average PM2.5 concentration, 2023: 8.5 µg/m³ (-9.4 µg/m³ from 2000)
- Average PM2.5 concentration, 2000: 17.9 µg/m³
- Population change, 2000-2023: +8.2%
- Total population, 2023: 370,030
4. Gadsden, AL

- Average PM2.5 concentration, 2023: 9.8 µg/m³ (-9.7 µg/m³ from 2000)
- Average PM2.5 concentration, 2000: 19.5 µg/m³
- Population change, 2000-2023: -0.2%
- Total population, 2023: 103,241
3. Riverside-San Bernardino-Ontario, CA

- Average PM2.5 concentration, 2023: 9.6 µg/m³ (-10.3 µg/m³ from 2000)
- Average PM2.5 concentration, 2000: 19.9 µg/m³
- Population change, 2000-2023: +44.0%
- Total population, 2023: 4,688,053
2. Birmingham-Hoover, AL

- Average PM2.5 concentration, 2023: 9.6 µg/m³ (-10.4 µg/m³ from 2000)
- Average PM2.5 concentration, 2000: 20.0 µg/m³
- Population change, 2000-2023: +12.5%
- Total population, 2023: 1,184,290
1. Portsmouth, OH

- Average PM2.5 concentration, 2023: 8.8 µg/m³ (-12.3 µg/m³ from 2000)
- Average PM2.5 concentration, 2000: 21.1 µg/m³
- Population change, 2000-2023: -9.1%
- Total population, 2023: 71,969
Sponsor
Find a Vetted Financial Advisor
- Finding a fiduciary financial advisor doesn't have to be hard. SmartAsset's free tool matches you with up to 3 financial advisors that serve your area in 5 minutes.
- Each advisor has been vetted by SmartAsset and is held to a fiduciary standard to act in your best interests. Get on the path toward achieving your financial goals!