Average Temperatures in 2025 Are Already Well Above Average in These US Cities
 https://climatecrisis247.com/wp-content/uploads/2025/07/od9eozfsoh0-150x150.jpg
In recent weeks, parts of the United States have reported historic and dangerous heat waves. As of early July, Phoenix, Arizona, has already reported 10 days of temperatures exceeding 110°F. Record breaking heat in Dallas last month has been linked to at least two deaths. In Las Vegas and Needles, California, temperatures recently matched all-time highs of 117°F and 125°F, respectively. The latest forecasts indicate that, in most of the country – including places more accustomed to cooler climates – relief will not be coming soon.
Starting over the July Fourth weekend, temperatures are expected to approach or exceed the triple digits in parts of the Midwest, including Detroit, Minneapolis, and Omaha. By early next week, extreme heat is expected to reach the Eastern Seaboard. According to recent reports, an estimated 190 million Americans are expected to experience temperatures above 90°F within the coming days, and another 17 million live in areas that will likely report temperatures of 100°F or more.
While most of the country is used to high temperatures in June and July, data from the earlier months of 2025 show that cities across the country have already been living temperatures that are well above normal for much of the year. There are at least 14.2 million Americans residing in places where average temperatures exceed baseline trends by about 2°F or more over the first five months of 2025.
Using data from the National Atmospheric and Oceanic Administration, Climate Crisis 247 identified the U.S. cities where temperatures are already well above average this year. We reviewed data for over 200 cities, towns, and places in the U.S. and ranked them on the average local temperature between January and May, 2025. Only places where average temperatures exceed the baseline by at least 1.5°F are listed. Baseline temperatures, as classified by NOAA, are average temperatures over the months of January through May each year from 1991 through 2020.
26. Allentown, Pennsylvania

- Average temperature in 2025 compared to baseline: 1.5°F above avg.
- Average local temperature, January-May 2025: 42.9°F
- Baseline average local temperature (January-May 1991-2020): 41.4°F
- Local population: 125,320
25. Bridgeport, Connecticut

- Average temperature in 2025 compared to baseline: 1.5°F above avg.
- Average local temperature, January-May 2025: 43.9°F
- Baseline average local temperature (January-May 1991-2020): 42.4°F
- Local population: 148,012
24. Atlanta, Georgia
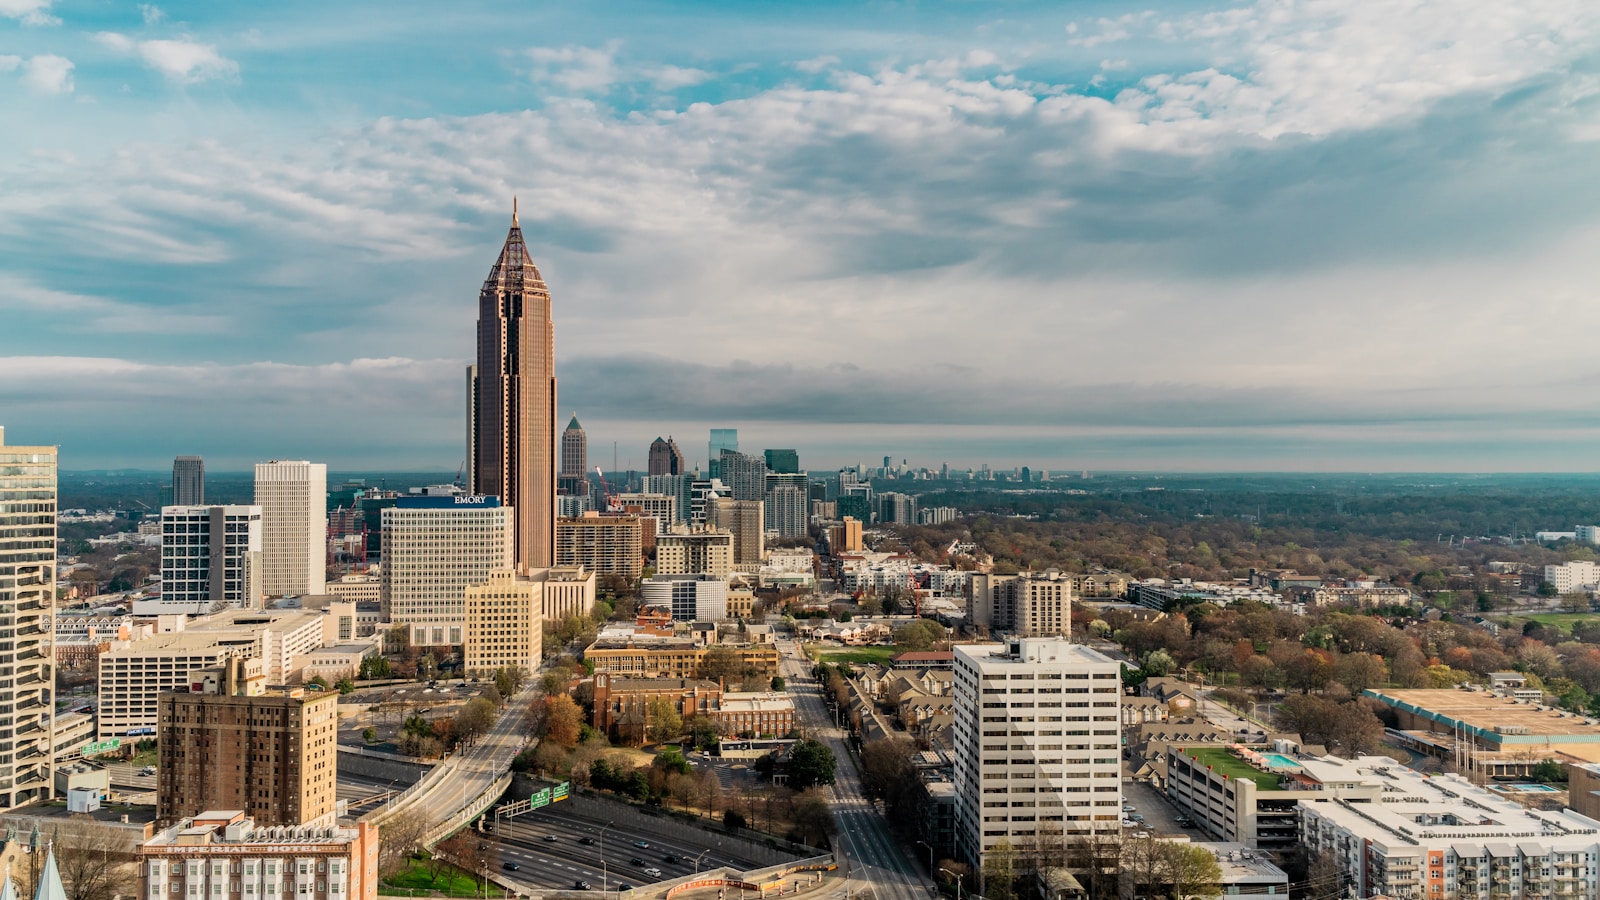
- Average temperature in 2025 compared to baseline: 1.5°F above avg.
- Average local temperature, January-May 2025: 58.4°F
- Baseline average local temperature (January-May 1991-2020): 56.8°F
- Local population: 499,287
23. Monroe, Louisiana

- Average temperature in 2025 compared to baseline: 1.5°F above avg.
- Average local temperature, January-May 2025: 60.5°F
- Baseline average local temperature (January-May 1991-2020): 59.0°F
- Local population: 47,241
22. Tampa, Florida

- Average temperature in 2025 compared to baseline: 1.5°F above avg.
- Average local temperature, January-May 2025: 70.9°F
- Baseline average local temperature (January-May 1991-2020): 69.4°F
- Local population: 393,389
21. Key West, Florida

- Average temperature in 2025 compared to baseline: 1.5°F above avg.
- Average local temperature, January-May 2025: 75.9°F
- Baseline average local temperature (January-May 1991-2020): 74.4°F
- Local population: 25,824
20. Caribou, Maine

- Average temperature in 2025 compared to baseline: 1.6°F above avg.
- Average local temperature, January-May 2025: 29.9°F
- Baseline average local temperature (January-May 1991-2020): 28.3°F
- Local population: 7,427
19. Rochester, Minnesota

- Average temperature in 2025 compared to baseline: 1.6°F above avg.
- Average local temperature, January-May 2025: 35.1°F
- Baseline average local temperature (January-May 1991-2020): 33.5°F
- Local population: 121,638
18. Williamsport, Pennsylvania

- Average temperature in 2025 compared to baseline: 1.6°F above avg.
- Average local temperature, January-May 2025: 43.4°F
- Baseline average local temperature (January-May 1991-2020): 41.8°F
- Local population: 27,629
17. New York, New York (as reported at JFK airport)
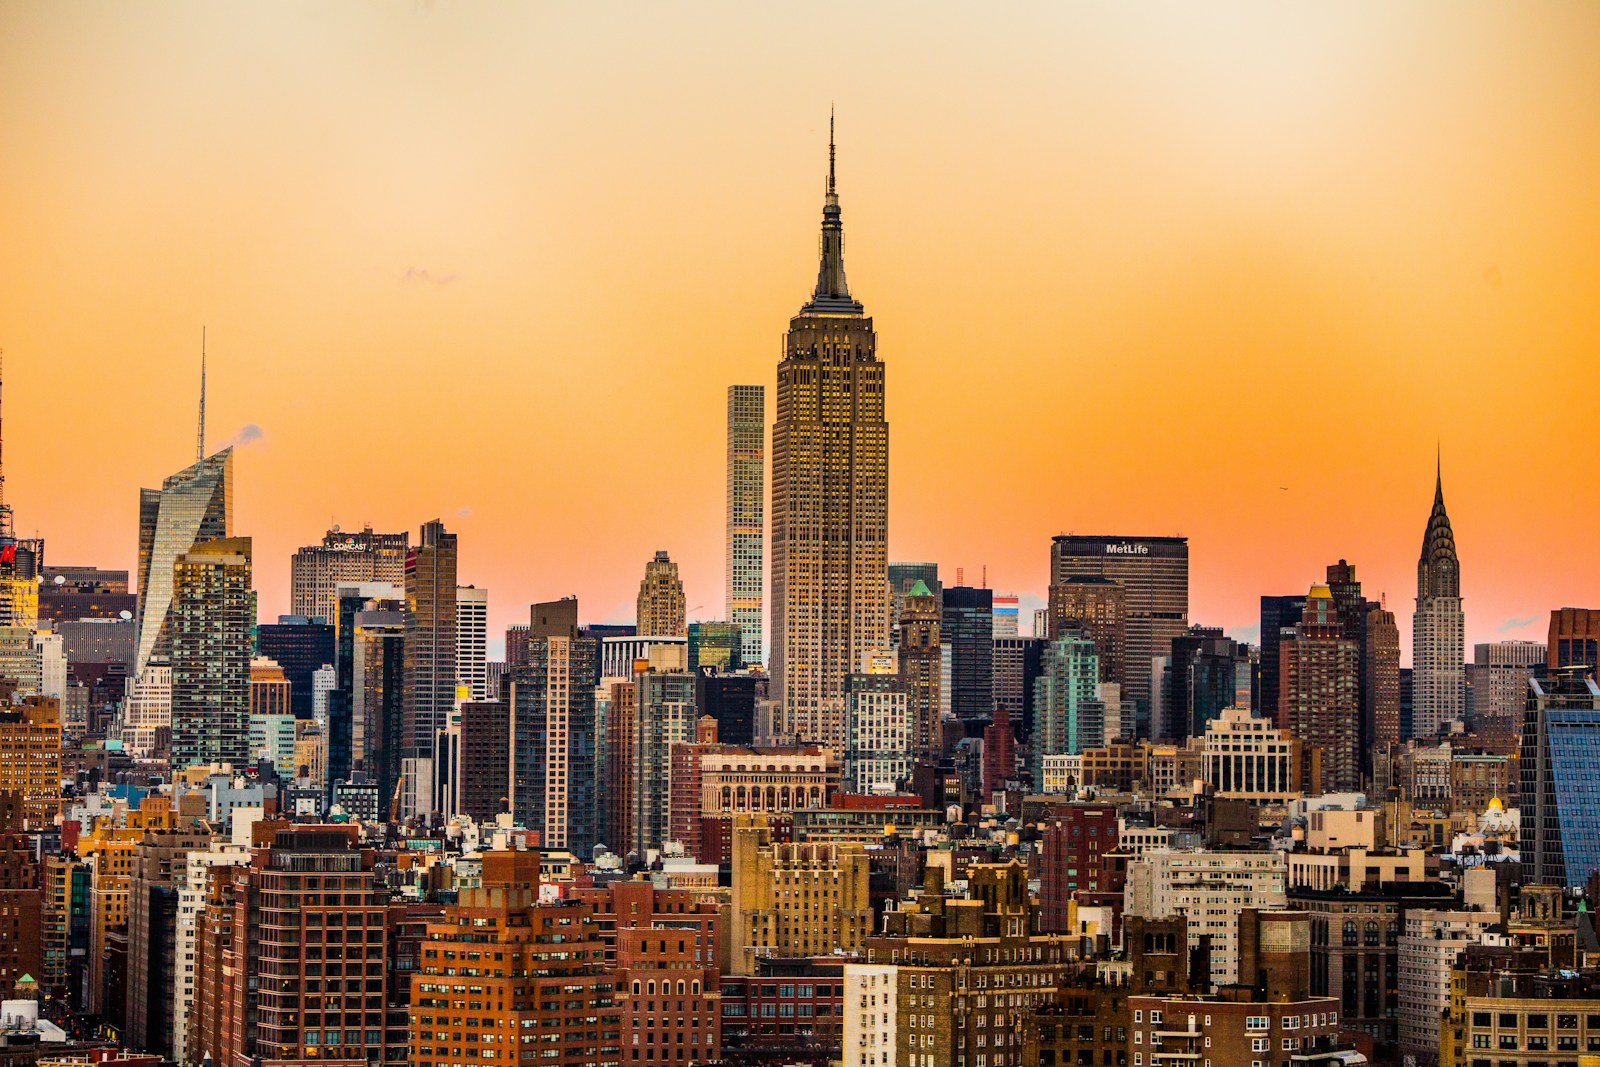
- Average temperature in 2025 compared to baseline: 1.6°F above avg.
- Average local temperature, January-May 2025: 45.3°F
- Baseline average local temperature (January-May 1991-2020): 43.7°F
- Local population: 8,516,202
16. Atlantic City, New Jersey

- Average temperature in 2025 compared to baseline: 1.6°F above avg.
- Average local temperature, January-May 2025: 46.4°F
- Baseline average local temperature (January-May 1991-2020): 44.8°F
- Local population: 38,486
15. Lubbock, Texas
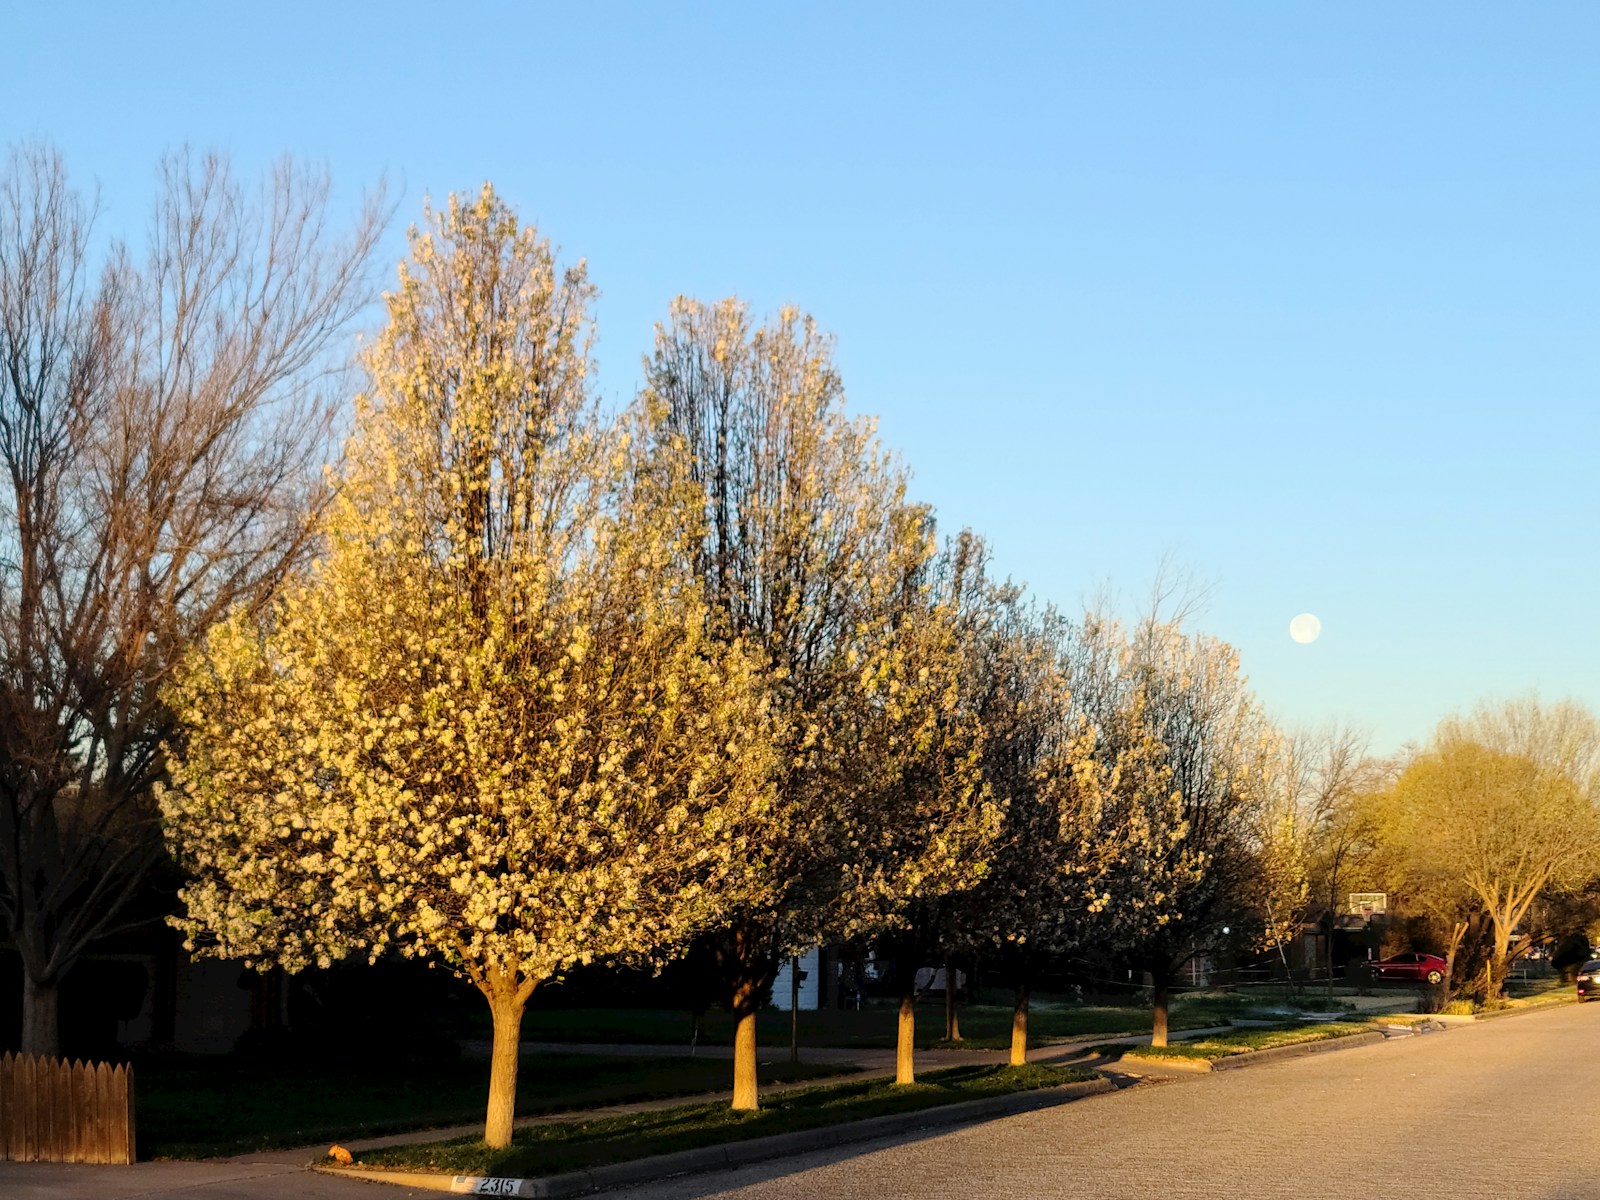
- Average temperature in 2025 compared to baseline: 1.6°F above avg.
- Average local temperature, January-May 2025: 55.7°F
- Baseline average local temperature (January-May 1991-2020): 54.1°F
- Local population: 261,078
14. Charlotte, North Carolina
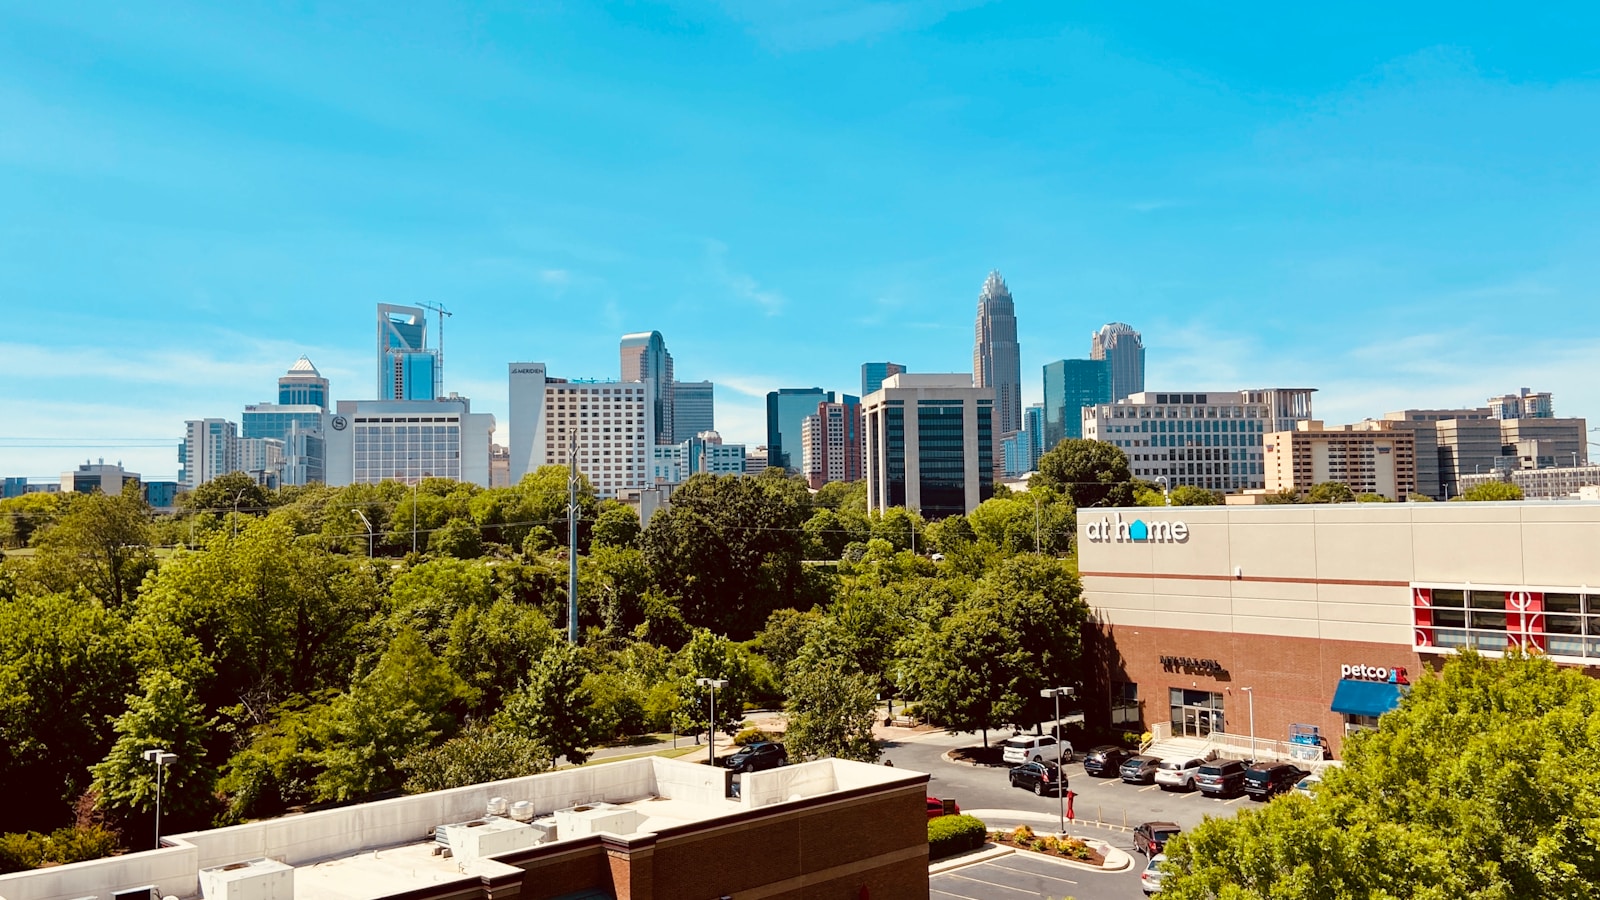
- Average temperature in 2025 compared to baseline: 1.6°F above avg.
- Average local temperature, January-May 2025: 56.1°F
- Baseline average local temperature (January-May 1991-2020): 54.6°F
- Local population: 886,283
13. Raleigh, North Carolina

- Average temperature in 2025 compared to baseline: 1.6°F above avg.
- Average local temperature, January-May 2025: 56.6°F
- Baseline average local temperature (January-May 1991-2020): 54.9°F
- Local population: 470,763
12. Fort Myers, Florida

- Average temperature in 2025 compared to baseline: 1.6°F above avg.
- Average local temperature, January-May 2025: 73.3°F
- Baseline average local temperature (January-May 1991-2020): 71.7°F
- Local population: 91,730
11. New Orleans, Louisiana

- Average temperature in 2025 compared to baseline: 1.7°F above avg.
- Average local temperature, January-May 2025: 66.1°F
- Baseline average local temperature (January-May 1991-2020): 64.4°F
- Local population: 376,035
10. Alamosa, Colorado

- Average temperature in 2025 compared to baseline: 1.8°F above avg.
- Average local temperature, January-May 2025: 36.4°F
- Baseline average local temperature (January-May 1991-2020): 34.7°F
- Local population: 9,847
9. Providence, Rhode Island

- Average temperature in 2025 compared to baseline: 1.8°F above avg.
- Average local temperature, January-May 2025: 42.5°F
- Baseline average local temperature (January-May 1991-2020): 40.7°F
- Local population: 190,214
8. Jackson, Mississippi

- Average temperature in 2025 compared to baseline: 1.8°F above avg.
- Average local temperature, January-May 2025: 61.2°F
- Baseline average local temperature (January-May 1991-2020): 59.4°F
- Local population: 149,827
7. Ely, Nevada

- Average temperature in 2025 compared to baseline: 1.9°F above avg.
- Average local temperature, January-May 2025: 39.5°F
- Baseline average local temperature (January-May 1991-2020): 37.5°F
- Local population: 3,941
6. Elko, Nevada

- Average temperature in 2025 compared to baseline: 1.9°F above avg.
- Average local temperature, January-May 2025: 41.6°F
- Baseline average local temperature (January-May 1991-2020): 39.7°F
- Local population: 20,624
5. Grand Junction, Colorado

- Average temperature in 2025 compared to baseline: 1.9°F above avg.
- Average local temperature, January-May 2025: 47.2°F
- Baseline average local temperature (January-May 1991-2020): 45.4°F
- Local population: 67,027
4. Norfolk, Virginia

- Average temperature in 2025 compared to baseline: 1.9°F above avg.
- Average local temperature, January-May 2025: 54.4°F
- Baseline average local temperature (January-May 1991-2020): 52.5°F
- Local population: 235,037
3. Cape Hatteras, North Carolina

- Average temperature in 2025 compared to baseline: 1.9°F above avg.
- Average local temperature, January-May 2025: 56.9°F
- Baseline average local temperature (January-May 1991-2020): 55.0°F
- Local population: N/A
2. San Antonio, Texas

- Average temperature in 2025 compared to baseline: 1.9°F above avg.
- Average local temperature, January-May 2025: 65.9°F
- Baseline average local temperature (January-May 1991-2020): 64.0°F
- Local population: 1,458,954
1. Grand Forks, North Dakota

- Average temperature in 2025 compared to baseline: 3.1°F above avg.
- Average local temperature, January-May 2025: 30.6°F
- Baseline average local temperature (January-May 1991-2020): 27.4°F
- Local population: 58,882
More from ClimateCrisis 247
- See Where Chantal Caused the Worst Flooding
- Deadliest Floods in Recent US History
- Kerr County, Guadalupe River, and the Cities Where Flooding Is at Historic Extremes Right Now
- Tropical Depression Chantal to Bring More Than 4 Inches of Rain to These Cities This Week
